Abstract
The interactions of π-arene-Ru(II)-chloroquine complexes with human serum albumin (HSA), apotransferrin and holotransferrin have been studied by circular dichroism (CD) and UV-Visible spectroscopies, together with isothermal titration calorimetry (ITC). The data for [Ru(η6-p-cymene)(CQ)(H2O)Cl]PF6 (1), [Ru(η6-benzene)(CQ)(H2O)Cl]PF6 (2), [Ru(η6-p-cymene)(CQ)(H2O)2][PF6]2 (3), [Ru(η6-p-cymene)(CQ)(en)][PF6]2 (4), [Ru(η6-p-cymene)(η6-CQDP)][BF4]2 (5) (CQ: chloroquine; DP: diphosphate; en: ethylenediamine), in comparison with CQDP and [Ru(η6-p-cymene)(en)Cl][PF6] (6) as controls demonstrate that 1, 2, 3, and 5, which contain exchangeable ligands, bind to HSA and to apotransferrin in a covalent manner. The interaction did not affect the α-helical content in apotransferrin but resulted in a loss of this type of structure in HSA. The binding was reversed in both cases by a decrease in pH and in the case of the Ru-HSA adducts, also by addition of chelating agents. A weaker interaction between complexes 4 and 6 and HSA was measured by ITC but was not detectable spectroscopically. No interactions were observed for complexes 4 and 6 with apotransferrin or for CQDP with either protein. The combined results suggest that the arene-Ru(II)-chloroquine complexes, known to be active against resistant malaria and several lines of cancer cells, also display a good transport behavior that makes them good candidates for drug development.
Keywords: Ruthenium complexes, human serum albumin, transferrin, binding affinity, chloroquine
1. Introduction
Since the discovery of cisplatin, much effort has been devoted to search for other effective metallodrugs; Ru(III) compounds are emerging as promising new drugs, such as the antimetastatic agent NAMI, Na[trans-RuCl4(DMSO)(Im)] (Im = imidazole) [1], and two complexes that are active against solid colon tumors, KP1019 (indH)[trans-RuCl4(ind)2]) (ind = indazole) and KP418 (imH)[trans-RuCl4(im)2]) [2–4].
We have been investigating Ru(II) complexes for different therapeutic applications; Ru(KTZ)2Cl2 and Ru(CTZ)2Cl2 (KTZ, ketoconazole; CTZ, clotrimazole) are more active against Trypanosoma cruzi, the causative agent of Chagas' disease, and less toxic to normal mammalian cells than the free organic drugs through a dual mechanism involving DNA binding and sterol biosynthesis inhibition [5–8]. Ru(KTZ)2Cl2 also induces cytotoxicity and apoptosis-associated caspase-3 activation in several cancer cell lines [9]. Recently we reported that the complexes Ru(η6-arene)(CQ)L2 (1–4) and [Ru(η6-p-cymene)(η6-CQDP)][BF4]2 (5) (CQ, chloroquine; DP, diphosphate) are more active than CQ against resistant strains of Plasmodium falciparum, the deadliest malaria parasite, as a result of lipophilicity, basicity and structural features. These Ru-CQ complexes are also active against HCT-116 colon cancer, LS141 dedifferentiated liposarcoma, Jurkat human T lymphocyte leukemia and SUP-T1 lymphoma while displaying low toxicity toward normal cells [10–12]. Although 1–5 interact with DNA through intercalation of the CQ moiety, such interactions are not the main mechanism of antitumor action [12]. Related compounds [Ru(η6-arene)(X)(Y-Z)] (where Y-Z is a chelating ligand) are known to be cytotoxic against human ovarian tumor cell lines through covalent Ru-DNA interactions [13,14]; [Ru(η6-p-cymene)(PTA)Cl2] (RAPTA-C) and similar Ru(II) complexes containing the 1,3,5-triaza-7-phosphaadamantane (PTA) ligand are promising against metastases, although their mechanism of action is not well understood [15].
The distribution, excretion, activity and toxicity of a drug are determined, at least in part, by its interactions with serum proteins [16–18]. Human serum albumin (HSA), the most abundant blood plasma protein, reversibly binds pharmaceuticals, mainly at the hydrophobic cavities of subdomains IIA and IIIA [19,20]. Transferrin is responsible for mobilization of iron by binding two Fe+3 ions in sites containing two tyrosines, one histidine, one asparagine and a carbonate ion, in an overall octahedral environment [21]; only about 30% of transferrin is saturated with iron under normal homeostasis in humans, which means that simultaneous interactions with other metal ions are possible.
The Ru(III) complex NAMI binds up to 5 eq of drug per HSA molecule [22], mainly at the imidazole nitrogen of the histidine residues in domains IIA and IIIA [23]; KP1019 and KP418 display a similar behavior [2–4]. All three Ru(III) compounds also form stable adducts with apotransferrin. In contrast, little information is available on the interactions of Ru(II) complexes with plasma proteins [24]. As part of our efforts to understand the pharmacologic behavior of Ru(II) compounds, we now report the results of a study on the ability of the arene-Ru(II)-CQ complexes 1–5 to bind to HSA and transferrin, by use of circular dichroism (CD), UV-Visible spectroscopies and isothermal titration calorimetry (ITC).
2. Experimental
2.1. General
Ru complexes were synthesized as described in ref. 11. HSA, apotransferrin, hemin, EDTA, citric acid, buffers and solvents were from Sigma-Aldrich. Solvents were purified by use of a PureSolv purification unit from Innovative Technology, Inc. Apotransferrin was double purified by dialysis in phosphate buffer 10 mM with 5 mM NaHCO3 (pH 7.4) at 5°C over periods of 4 and 24 h respectively. All other chemicals were used as received. CD studies were carried out in a Chirascan CD Spectrometer equipped with a thermostated cuvette holder; spectrophotometric experiments were performed in an Agilent 8453 diode-array instrument equipped with a HP 89090 Peltier temperature control accessory and ITC measurements were performed using a VP-ITC calorimeter (Microcal).
2.2. Interaction with HSA
The interaction of complexes 1–5 (and controls) with HSA was studied by CD spectroscopy at 180–260 nm (intrinsic region; 0.3 cm cuvette) and 300–600 nm (visible region; 1 cm cuvette) in 10 mM phosphate buffer, pH 7.4. In situ titrations were performed as follows: a 2 ml sample of a 1.5×10⁻⁴ M HSA buffer solution was titrated by stepwise addition of 20 μl of a 15 mM solution of each drug in deionized water (1 eq per addition); the interaction was monitored in the 300–600 nm range until saturation was reached. The same concentrations were used for incubations overnight. Two ml samples of 1.5×10⁻⁴ M HSA solution were treated with increasing amounts of drug (1–12 eq) and incubated for 20 h at 37°C; the interaction was monitored by the appearance of a band in the visible region. To study the intrinsic region (180–260 nm), 1 ml samples of 3×10⁻⁶ M HSA were incubated for 20 h at 37°C with the appropriate amount of 1.5 mM stock solutions of each drug to reach 1–13 eq. The secondary structure composition was calculated in the 190–260 nm range with the CDNN analysis tool for deconvolution, included in the software package of the Chirascan CD Spectrophotometer.
To determine the influence of the Ru(II) complexes on the binding of hemin to HSA, a 8×10⁻⁵ M solution of protein in buffer was used. The hemin concentration (4.68 mM) was evaluated spectrophotometrically in 0.01 M NaOH using an absorption coefficient of 58.4 mM−1cm−1 at 385 nm [25]. Two ml samples of the stock solution of HSA were first incubated for 20 h at 37°C with different amounts of a 15 mM solution of each drug in order to obtain ratios of 1:2, 1:4 and 1:6. In a second step, 1 eq of hemin was added from the stock solution in NaOH to each sample and the mixtures were incubated at 37°C for 1 h. A control solution containing HSA and hemin with no drug was used as a reference. All spectra were corrected by subtraction of a blank consisting of a solution of drug in buffer at the appropriate concentration for each sample. The presence of the HSA-heme adduct was monitored spectrophotometrically at 405 nm.
For binding reversibility studies, 2 ml samples of 1.5×10⁻⁴ M HSA previously incubated for 20 h at 37°C with 10 eq of each drug were treated with 20 μl of 37% HCl to reach pH 4.0. Changes were followed in the visible region (300–600 nm). The binding reversibility studies using chelating agents (citric acid and EDTA) were performed in a similar way using the required amount of a 60 mM solution of each chelator for 1:1 and 1:3 complex:chelator ratios.
ITC titrations were performed at 25 °C in phosphate buffer (pH 7.4). Protein and metal complex solutions were equilibrated with nitrogen for 1/2 h and degassed under vacuum before titration. Multiple injections (10 μl each) of the metal complex solution (6 mM) were added to a HSA (40 μM) solution under continuous stirring. The slow changes in signals (microcal per second) required 600 seconds to equilibrate after each injection. Data were analyzed for binding stoichiometry, dissociation constant, and other thermodynamic parameters using the Origin software by integrating raw data (heat pulse in microcalories per second per injection) and fitting to a standard single-site binding model. Control titrations without protein were performed and subtracted from the data in order to adjust for the heat of dilution of the metal complexes. Analogous experiments were performed using CQDP or [Ru(η6-p-cymene)(en)Cl][PF6] as controls.
2.3. Interaction with apotransferrin and holotransferrin
The interaction of the Ru complexes and controls (CQDP and 6) with apotransferrin was studied by CD spectroscopy at 180–260 nm (intrinsic region; 0.3 cm cuvette), 230–320 nm (aromatic region; 1 cm cuvette) and 320–600 nm (visible region; 1 cm cuvette), with all solutions in 10 mM phosphate buffer containing 5 mM NaHCO3, pH 7.4. The concentration of apotransferrin was calculated spectrophotometrically after dialysis using ε280 = 74,400 M−1 cm−1 [26]. Two ml samples of 3.75×10⁻⁵ M apotransferrin solutions were used for the aromatic and the visible regions. The required amount of stock solutions of Fe3+ and Ru(II) complexes (15 mM) in deionized water was added to the protein solution to reach ratios up to 2 eq for Fe3+ and between 1–10 eq for Ru(II) complexes. The mixtures were incubated at 37°C for 20 h.
For the studies in the intrinsic region (180–260 nm), 1 ml samples of 2×10⁻⁶ M apotransferrin were incubated at 37°C for 20 h with the required amount of a 0.5 mM solution of the metal complex. Molar ratios ranged from 0.5–2 for Fe3+ and from 1–9 for Ru(II) complexes. The replacement of Fe3+ in holotransferrin by Ru(II)-CQ complexes was followed in the visible region of the CD spectra. A series of 2 ml solutions of apotransferrin (3.75×10⁻⁵ M) was loaded with 2 eq of Fe+3; the mixtures were incubated at 37°C for 20 h. In a second step, 2 and 6 eq of each Ru(II) complex were added, the mixtures were allowed to incubate for an additional 20 h period and changes in the CD spectra were monitored. For binding reversibility studies, 2 ml samples of 3.75×10⁻⁵ M apotransferrin previously incubated for 20 h at 37°C with 10 eq of each drug were treated with 20 μl of 37% HCl to reach pH 4.0. Changes were monitored in the visible region (300–600 nm). ITC experiments were performed using the same conditions as for HSA.
3. Results and discussion
3.1. Aqueous form of the Arene-Ru(II)-chloroquine complexes
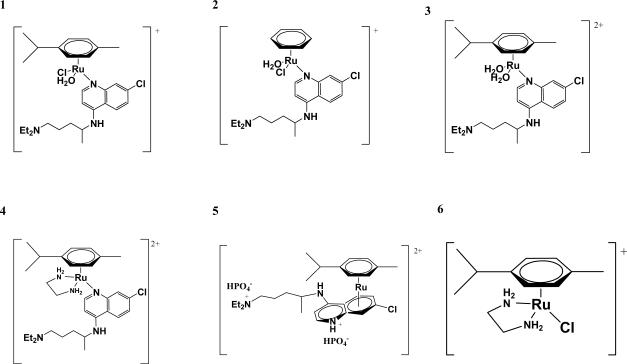
The synthesis, characterization and antimalarial and anticancer activity of Ru(II)-CQ complexes were discussed by us in previous publications [10–12]. Fig. 1 shows the structure of the arene-Ru(II)-CQ complexes in aqueous solution. All compounds are stable in water in the absence of other potential ligands, as confirmed by the fact that their NMR spectra remain unchanged for several days [11].
Fig. 1.
Aqueous form of the arene-Ru(II)-chloroquine complexes and the reference complex [Ru(η6-p-cymene)(en)Cl][PF6] (See ref. 11).
3.2. Interaction with HSA
3.2.1. Binding and conformational changes by circular dichroism
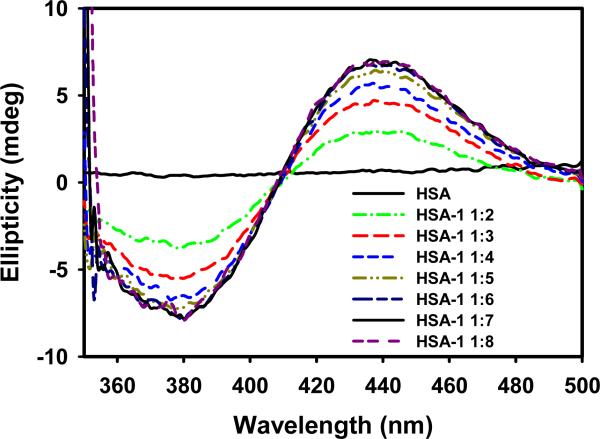
Titrations of HSA were performed with each of the six complexes or CQDP and monitored in the visible region of the CD spectrum. The free protein, CQDP and the Ru(II) complexes show no signals in this region but two characteristic bands, a maximum at 436 nm and a minimum at 380 nm, appear during titration with 1, 3 and 5. Fig. 2 shows the CD spectra from the titration of HSA with complex 1 as an example. These bands are a typical consequence of optical activity associated with d-d transitions of the metal atom (Cotton Effect) upon interaction with the protein [22] and constitute unambiguous proof of a modification in the coordination sphere of the metal, thus confirming a Ru-protein interaction, most likely of a covalent nature. Saturation was reached with 6–7 eq of the drugs, a slightly higher value than that reported for Ru(III)-indazole complexes [27–29] (4–5 eq). In contrast, complexes 2, 4 and 6 did not induce any changes in the CD spectrum of HSA during the titration up to 7-fold molar excess.
Fig. 2.
CD spectra (visible region) of HSA titrated with complex 1.
In an analogous behavior to that of complexes 2, 4 and 6, CQDP did not show any measurable binding by either CD or by absorption or fluorescence titrations (data not shown). In contrast, work from 1952 described a pH-dependent binding of CQDP to HSA monitored spectrophotometrically at pH 7.4 with an affinity constant of 5.4×10³ M−1 [30]. A similar binding constant (7.7×10³ M−1) was quantified by capillary electrophoresis at pH 7.4 [31]. If an interaction is taking place between CQDP or complexes 2, 4, and 6 with HSA it is too weak to be detected by any of the spectroscopic techniques employed by us; however, we were able to measure these interactions for the Ru-CQ complexes by ITC (vide infra), but again no interaction was detected for CQDP.
After long incubations of HSA with 1, 3 and 5 (20 h at 37°C) the CD spectra showed only a positive band at 428 nm (see supplementary material, Fig.S1). Complex 2, which did not induce any changes during the titration experiment, displayed a positive band at 420 nm and a negative one at 365 nm after 20 h incubation, similar to the ones resulting from the titration experiments with 1, 3, or 5; saturation in these cases was reached after adding 10–12 eq of the drugs. Similar experiments with compounds 4, 6 and CQDP did not provide any evidence of interaction and analogous results were observed after 40 h of incubation (data not shown). Assuming that most of the complex added binds to the protein after the long incubations, the number of eq at which saturation is reached becomes a good indicator of the number of binding sites available for any given compound. The fact that the immediate changes were not the same as those at longer time of incubation, along with the fact that different amounts of Ru(II) complexes were necessary to saturate the protein in titration and incubation experiments suggest that different binding sites with different affinities are involved at short and long interaction times. In a kinetic experiment using HSA loaded with 7 eq of Ru(II) complexes (data not shown), the transition between the initial and the final conformations took about 1.5 h to equilibrate. Ru(III) complexes are known to bind mainly to histidines of subdomains IIA and IIIA in HSA [27,32,33] and we propose an analogous interaction for Ru(II)-CQ complexes. The lack of an exchangeable water or chloride ligand in 4 and the inertness of the chloride in 6 [11] prevent a covalent interaction, which explains the lack of CD bands in the visible region and the inability of those compounds to modify the secondary structure of HSA (see below); the results of kinetic experiments indicate that the water ligand in 2 is exchanged only slowly in the presence of HSA. Complex 5 is also coordinatively saturated, but it seems to bind covalently to HSA; therefore, we must assume that one of the two π-bonded ligands is rapidly exchanged by the protein.
In order to obtain further information on the structural perturbation induced by the complexes on HSA, the intrinsic region (180–260 nm) was studied (see supplementary material, Fig.S2). The CD spectrum of HSA exhibits two negative bands at 209 and 220 nm in the UV region, characteristic of right-handed α-helices [19,34]. Binding of Ru(II)-CQ complexes decreased the intensity of both bands, indicating a loss in the α-helix content to an extent that depends on the compound and the Ru/HSA ratio. Saturation was observed after addition of 10 eq of each drug, in agreement with the results obtained in the visible region; the amount of α-helices decreased between 10% and 20% at this concentration depending on the Ru-CQ complex. The results in table 1 show that the loss of α-helical content upon interaction with the metal drug is redistributed in four other forms of secondary structures with a slight preference for antiparallel β-sheet and random coil. Complexes 4, 6 or CQDP did not induce any modification in this spectral region, confirming the idea that a labile coordination position must be available on the metal for interaction. Pt(II), Ru(III), reduced NAMI-A, Rh complexes and trans-RuCl2(DMSO)4 display interactions with HSA analogous to our complexes [2,4,35–38], albeit at lower molar ratios.
Table 1.
Composition distribution in % of each type of secondary structure for HSA and HSA incubated with 5 and 10 equivalents of complexes 1, 2, 3 and 5. Range analyzed: 190–260 nm.
| α-Helix | Antiparallel β-Sheet | Parallel β-Sheet | β-Turn | Random Coil | |
|---|---|---|---|---|---|
| HSA | 49.00 | 3.00 | 5.50 | 15.00 | 19.90 |
| HSA-1 1:5 | 42.70 | 5.10 | 6.30 | 16.10 | 22.70 |
| HSA-1 1:10 | 38.80 | 7.20 | 6.90 | 16.80 | 24.50 |
| HSA-2 1:5 | 40.40 | 6.40 | 6.70 | 16.60 | 23.50 |
| HSA-2 1:10 | 35.50 | 10.10 | 7.40 | 17.60 | 25.60 |
| HSA-3 1:5 | 42.40 | 5.20 | 6.30 | 16.10 | 22.70 |
| HSA-3 1:10 | 30.20 | 16.60 | 8.40 | 18.90 | 28.10 |
| HSA-5 1:5 | 47.90 | 3.20 | 5.60 | 15.10 | 20.50 |
| HSA-5 1:10 | 33.60 | 12.20 | 7.70 | 18.10 | 26.30 |
A final observation can be made regarding enantioselective interactions. CQ is a chiral molecule with the [+] and [−] enantiomers giving mirror image spectra in the CD spectrum [39]. Our Ru-CQ complexes are synthesized as racemic mixtures, which explains the lack of CD bands for the free complexes. Similar to what we reported on the interactions with DNA [12], the [−] enantiomers of 1, 2, 3 and 5 interact preferentially with HSA, which causes a change in the enantiomeric composition of the free drug, thereby generating optical activity with two positive bands at 330 and 343 nm (data not shown) due to the excess of free [+]-Ru-CQ.
3.2.2. Influence of Ru(II) on heme binding to HSA studied by spectrophotometry
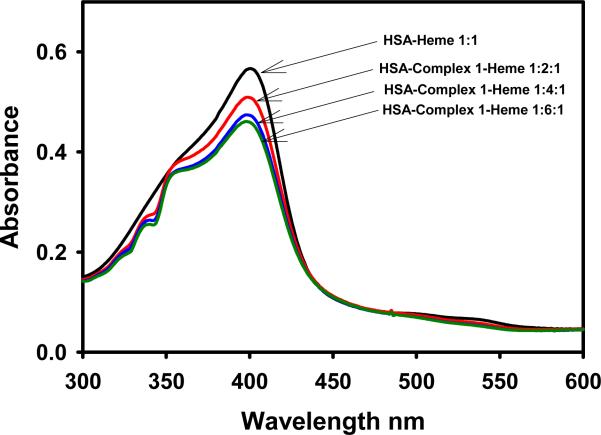
Further insights into the binding sites of the arene-Ru(II)-CQ complexes in HSA can be obtained by analyzing the influence of the metallodrugs on the interaction of heme with the protein. HSA possesses a single high-affinity binding site for heme [40,41] near the hydrophobic cavity of subdomain IIA [42,43]. The heme-HSA adduct has a characteristic Soret absorption at 405 nm with an intensity that depends on the amount of heme bound to the protein, which can be modified by drugs capable of competing for that site. The phenolic group of a tyrosine residue is the ligand to heme iron in the protein-heme adduct. The spectra in Fig. 3 show a 20% loss in heme binding in the presence of a 6-fold excess of complex 1 and a 11% loss for a 1:2 HSA:Ru drug ratio. This suggests that the affinity of the metal compound for that particular binding site might be higher than for the rest of the sites on HSA. Related arene-Ru(II) complexes are known to bind strongly to phenolic ligands [44].
Fig. 3.
The Soret band of heme-HSA in absence and presence of different amounts of complex 1.
Similar results were obtained for complexes 3 and 5, while CQDP, 4 and 6 did not modify heme binding to HSA, in agreement with the CD results. Interestingly, for Ru(III)-indazole complexes, approximately 40 % of bound heme was lost in the presence of 5-fold excess molar ratio [27], indicating that Ru(III) complexes have a greater preference for the heme binding site than the arene-Ru(II)-CQ complexes.
3.2.3. Reversibility of the binding studied by circular dichroism
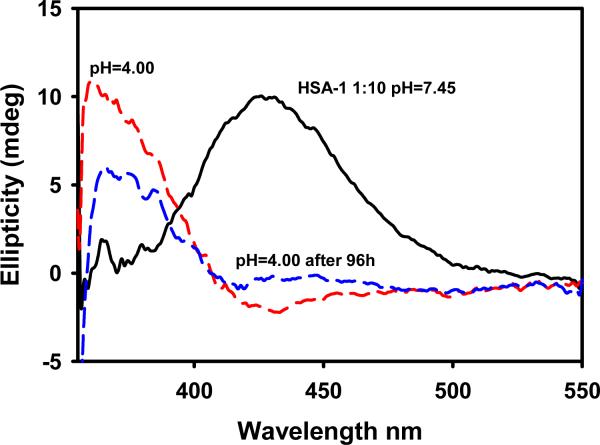
Binding to HSA is also of interest in relation to selective drug delivery. HSA can act as a carrier for metallodrugs delivering the drug selectively to the target cells, thus avoiding undesirable side effects; however, if the interaction is too strong, the drug might not be released to the target. Reversibility can be achieved by contact with a low pH environment, as in tumor tissues, or by chelators present in the cytosol that may displace the amino acid ligands bound to Ru in the complexes. Fig. 4 shows that lowering the pH from 7.4 to 4.0 through addition of HCl immediately affected the position of the visible band but not the intensity of the CD spectrum of HSA saturated with 1. This suggests that decreasing the pH induced immediate changes in the conformation of the protein-Ru drug conjugate, but did not affect the amount of drug bound in the short term.
Fig. 4.
Effect of decreasing the pH on the visible region of the spectrum of the HSA-complex 1 conjugate.
However, the intensity of the 363 nm band decreased by ca. 40% after 96 h at pH 4.0, suggesting that complex 1 was being released in a similar percentage. Analogous experiments performed for complexes 2, 3 and 5 produced comparable results: after 96 h the intensity of the 363 nm band decreased by 18%, 9% and 33%, respectively.
Metal ion chelators such as citric acid or EDTA produced a faster effect than lowering the pH. One hour after addition of 1 eq of citric acid, an 18% decrease in the intensity of the maximum ellipticity was observed in the CD spectrum of 1 (see supplementary material, Fig.S3), while about a 30% decrease took place for a 3-fold excess of the chelating agent. When EDTA was employed in analogous experiments with complex 1, the decreases observed were of 15% and 24% for 1eq and 3 eq, respectively. Increasing the time of exposure to either chelator did not significantly affect the amount of drug released. Table 2 summarizes the behavior of HSA conjugates with complexes 1, 2, 3 and 5 after 1 h exposure to the chelating agents. In all cases citric acid and EDTA were more effective “drug-removers” than low pH; citric acid is a slightly better chelator for Ru(II) complexes than EDTA. These results are in line with our suggestion that complexes 1–3 do not lose the p-cymene or CQ ligands upon binding to protein, since equimolar EDTA and citric acid behave similarly, yet EDTA contains more chelating positions. Therefore, dissociation from the protein presumably occurs by the chelators replacing an amino acid ligand.
Table 2.
Decrease in the intensity of the CD bands in the visible region of the Ru-HSA conjugates upon addition of citric acid or EDTA.
| Drug | % Decrease in intensity, 1 eq citric acid | % Decrease in intensity, 3 eq citric acid | % Decrease in intensity, 1 eq EDTA | %Decrease in intensity, 3 eq EDTA |
|---|---|---|---|---|
| 1 | 18 | 30 | 15 | 24 |
| 2 | 15 | 25 | 11 | 14 |
| 3 | 22 | 30 | 15 | 24 |
| 5 | 19 | 28 | 14 | 19 |
3.2.4. Binding affinities calculated by isothermal titration calorimetry
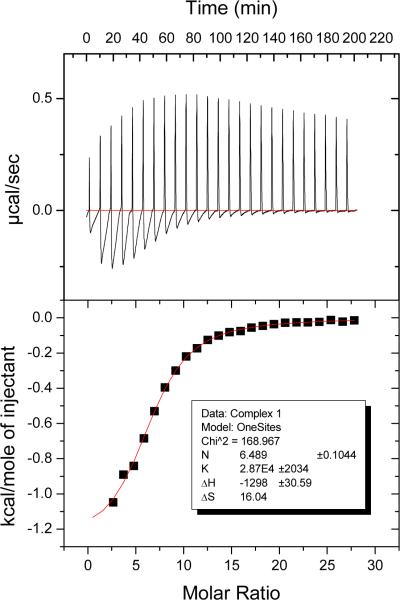
Data on binding affinities of Ru complexes to HSA are very scarce. Capillary electrophoresis measurements on the interaction of HSA with the Ru(III) complex KP1019 yielded a value of 9.9 × 10³ M−1 [45]. Isothermal titration calorimetry (ITC) is a very sensitive tool to measure even weak interactions; while this method has been applied to study the binding of Cu2+ and Ni2+ ions to HSA [46–48], to our knowledge, Ru drug-HSA binding has not been previously evaluated by ITC. Fig. 5 illustrates the calorimetric titration of HSA with complex 1 at pH 7.4.
Fig. 5.
ITC titration for complex 1. The data show an endothermic component at each step which was reproduced in blank titrations in which drug was titrated into buffer and was subtracted to give the curve in the bottom panel (see Experimental section for details).
Table 3 shows the binding affinities obtained from these experiments, corrected for heat of dilution. The results were fitted to a one-site model with excellent correlations; the calculated number of binding sites on the protein for each compound is also included in Table 3. The binding affinities of 1, 2, 3 and 5 are within the same order of magnitude, while complexes 4 and 6 show a weaker binding, which explains why changes were not detected in optical titrations. It is important to note that the complexes that contain labile ligands in solution (1, 2, 3, 5) are able to bind covalently, which results in a higher affinity for HSA. On the other hand, the weaker binding affinity for complexes 4 and 6 could be related to a non-covalent interaction, most likely hydrogen bonding through the en ligand. However, a correlation between labile positions on the metal, the number of drug molecules bound to the protein and the affinity calculated by ITC cannot be clearly established at this point. No binding between CQDP and HSA was detected by ITC, consistent with the CD, absorption and fluorescence results.
Table 3.
Binding affinities and number of binding sites on HSA calculated by ITC for Ru(II)-CQ complexes, and (CQDP) and [Ru(η6-p-cymene)(en)Cl][PF6] as controls.
| Compound | Binding affinity (M−1) | Binding sites |
|---|---|---|
| CQDP | No binding | No binding |
| 1 | 2.87×10⁴ | 6 |
| 2 | 1.33×10⁴ | 5 |
| 3 | 1.81×10⁴ | 8 |
| 4 | 6.66×10³ | 3 |
| 5 | 1.25×10⁴ | 9 |
| 6 | 3.07×10³ | 2 |
3.3. Interaction with apotransferrin and holotransferrin
3.3.1. Binding and conformational changes by CD spectroscopy
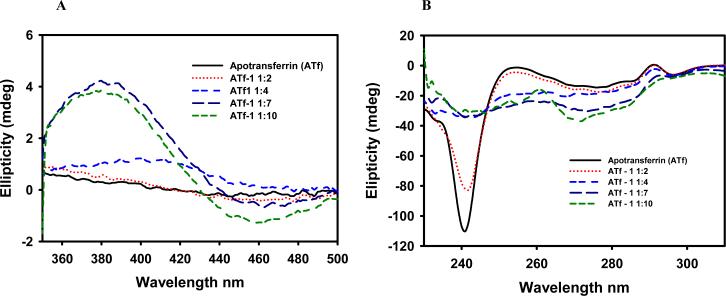
In order to monitor Ru complex binding, three regions are of interest in the CD spectra of apotransferrin: visible (320–600 nm), aromatic (230–320 nm) and intrinsic (180–260 nm), each of them providing different information about protein structure. The aromatic region is studied in the case of transferrin because a tyrosine residue is directly involved in the binding of iron [21,49]. Titration experiments showed that the interaction of Ru(II)-CQ complexes with apotransferrin was slow and therefore data were obtained after incubation for 20 h at 37°C. A control experiment with Fe3+ and the apoprotein showed the typical CD bands of Fe(III)-transferrin at 460 and 315 nm and revealed saturation with 2 eq of the metal ion. As in the case of HSA, apotransferrin gave no signals in the visible range, but a CD band with a maximum at 381 nm and a minimum at 460 nm appeared upon incubation with complex 1 (Fig. 6, A) as a consequence of an interaction taking place, most likely of a covalent nature [28].
Fig. 6.
Visible region of the CD spectrum of apotransferrin incubated with complex 1. Bands associated with d-d transitions are observed after 2, 4, 7 and 10 eq of the drug (A). Aromatic region of the CD spectrum of apotransferrin after incubation with 2, 4, 7 and 10 eq of complex 1 (B). After a 10-fold excess of metal complex was added, the transferrin did not seem to be saturated. Assuming that a high percentage of the drug added binds to the protein, this observation suggests that the Ru(II)-CQ compounds bind at more binding sites than the two specific ones for iron(III).
The bands in the CD spectrum of apotransferrin in the 230–320 nm (aromatic) range are attributed to the optical activity of tyrosine and tryptophan residues [50]. Changes in this region of the spectrum when the protein is incubated with the metal complexes indicate that the drugs are affecting the conformation. Given that two tyrosines are directly involved in the binding of iron and a tryptophan is in close proximity, it is reasonable to envisage that Ru(II)-CQ complexes are binding at the specific binding sites for Fe3+ (see Fig. 6, B). As in the case of HSA, the dichroism in the intrinsic region (180–260 nm) of apotransferrin is related to secondary structure. The protein displayed an intense band at 208–220 nm that was not affected by the presence of up to 9 eq of complex 1, in contrast with what is observed when Fe3+ binds to the protein. These results indicate that the Ru(II)-CQ drugs did not alter the helical structure of the protein, something that could be of critical importance since transferrin needs to be recognized by specific receptors in order to be internalized into the cells. It is reasonable to hypothesize that when the Ru-drug complexes bind at the iron binding sites, they do not recruit all the amino acids involved in the binding of iron so the protein conformation does not change in the same manner. In a similar way, no change in the intrinsic bands is observed when Zn2+ and Cu2+ bind apotransferrin [28,51].
Analogous behavior was observed for 2, 3 and 5 in all regions of the CD spectra, whereas complex 6 did not show any interaction. CQDP, on the other hand, induced slight changes only in the aromatic region of the CD spectra, suggesting a weak π-π interaction with the aromatic residues. Similarly, complex 4, which does not have coordination vacancies available was not able to modify the spectrum in the visible region, but changed the aromatic region, likely because of a π-π interaction of the aromatic residues with the CQ moiety. Interestingly, when complexes 1, 2, 3 and 5 interact with apotransferrin, two negative bands appear in the CD spectrum at 330 and 340 nm (data not shown), corresponding to the [−] enantiomer of the Ru-CQ drugs, suggesting that contrary to what was observed for HSA, the [+]-Ru-CQ enantiomer interacts preferentially with apotransferrin.
3.3.2. Specificity of the binding by circular dichroism
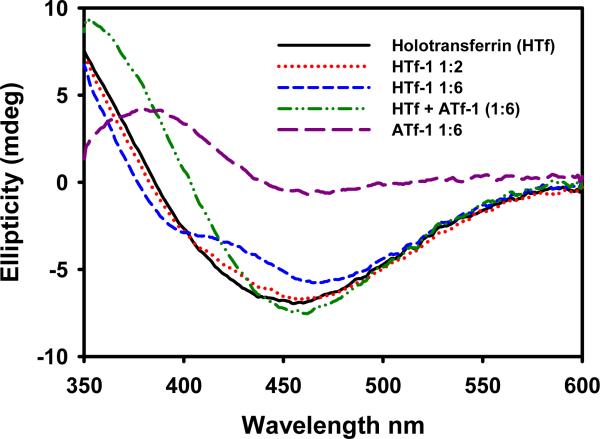
The transferrin cycle [52–54] makes this protein a particularly interesting target for antitumor compounds, since cancer cells have a large demand for iron and thus express transferrin receptors at a high level [55,56]. In terms of selective drug targeting, it is important to know whether our compounds bind to transferrin at sites different from the iron binding sites, and also if they can replace iron. The results in the visible region indicate that apotransferrin was not saturated after incubation with more than 10 eq of the Ru(II)-CQ complexes, suggesting that the binding was not limited to the Fe3+ sites. In spite of that, establishing whether the two binding sites for iron were relevant to the interaction of Ru(II)-CQ complexes with the protein still remains as an interesting issue. To do so, apotransferrin was converted into holotransferrin by incubation with 2 eq of Fe3+ for 20 h; subsequently, 2 and 6 eq of the Ru(II)-CQ complexes were added, the mixtures were incubated for a further 20 h and the changes in the CD spectra were monitored. Fig. 7 illustrates the visible region of holotransferrin before and after incubation with 2 and 6 eq of complex 1. Interestingly, the new spectrum does not correspond to the sum of the individual spectra of holotransferrin + (Ru(II) drug-apotransferrin). Therefore, this suggests that the Ru compound was, at least in part, replacing iron in holotransferrin. Complexes 2 and 5 had a very similar effect on holotransferrin, whereas 4 and 6 did not alter the visible region, consistent with the lack of interaction with apotransferrin. Complex 3 induced a less pronounced effect on holotransferrin, although an explanation for this observation cannot be offered with the data at hand. These results differ from what is known for Ru(III)-indazole complexes, which bind specifically to the iron binding sites [57].
Fig. 7.
CD spectra of holotransferrin before and after incubation with 2 and 6 eq of complex 1 for 20 hours at 37°C.
3.3.3. Reversibility of the binding studied by circular dichroism
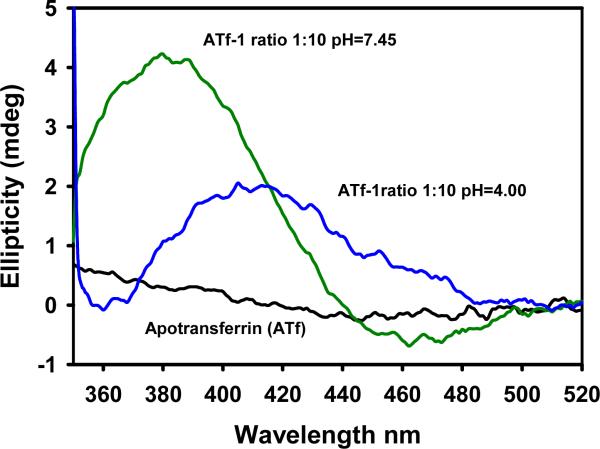
The effect of lowering the pH from 7.4 to 4.0 on the apotransferrin-1 conjugate is depicted in Fig. 8. The intensity of the CD band maximum decreased by a 52% and shifted to 416 nm within 15 min after the addition of HCl, suggesting that close to 50% of the drug could be released from the saturated apotransferrin. Similar results were observed for other Ru(II)-CQ complexes, with decreases in the maxima of 52%, 45% and 56% for 2, 3 and 5, respectively. Thus the binding is clearly reversible and thus this protein emerges as a potential selective carrier for the arene-Ru(II)-CQ complexes contributing to their antitumor action [55,56].
Fig. 8.
Effect of lowering the pH on the binding of complex 1 to apotransferrin.
3.3.4. Binding affinities calculated by isothermal titration calorimetry
About 30 different metal ions are known to bind to transferrin in place of iron(III) [58,59]. Fe3+ binding has been studied by means of spectroscopic techniques and by ITC, with reported affinities of log K = 22.5 and 21.4 [60–62]. As shown in Table 4, our Ru(II)-CQ complexes displayed a high affinity for apotransferrin, in the same range as for HSA, although significantly lower than that of iron. No correlation between the number of binding sites on the protein, the exchangeable positions on the metal and the binding affinities was observed, indicating that other factors are also contributing to the binding.
Table 4.
Values of binding affinities and number of binding sites on apotransferrin calculated by ITC for all five Ru(II) complexes and the controls: chloroquine diphosphate (CQDP) and [Ru(η6-p-cymene)(en)Cl][PF6].
| Compound | Binding affinity (M−1) | Binding sites |
|---|---|---|
| CQDP | No binding | No binding |
| Complex 1 | 2.27×10⁴ | 7 |
| Complex 2 | 1.18×10⁵ | 6 |
| Complex 3 | 2.35×10⁴ | 9 |
| Complex 4 | No binding | No binding |
| Complex 5 | 1.77×10³ | 11–12 |
| Complex 6 | No binding | No binding |
4. Conclusion
Data obtained by CD, absorption spectra and ITC demonstrate that arene-Ru(II)-chloroquine complexes interact with human serum albumin and with apotransferrin, most likely in a covalent manner. The interaction did not affect the α-helical content in apotransferrin but resulted in a loss of this type of structure in human serum albumin. Interestingly, the binding was reversed in both cases by a decrease in pH and by the addition of chelating agents in the case of the Ru-HSA adducts. The combined results suggest that arene-Ru(II)-chloroquine complexes, which we have previously shown to be active against resistant malaria and several lines of cancer cells, also display potentially beneficial transport properties making them good candidates for further drug development.
Supplementary Material
Fig. S1: Visible region of the CD spectra of HSA incubated with increasing amounts of complexes 1 (A) and 2 (B) at 37°C for 20 h.
Fig. S2: Intrinsic CD region of HSA after incubation at 37°C for 20 h with 10 eq of complex 1 (A) and composition distribution of the different types of secondary structure in HSA and HSA incubated with 5 and 10 equivalents of complex 1 (B) Fig. S2: Intrinsic CD region of HSA after incubation at 37°C for 20 h with 10 eq of complex 1 (A) and composition distribution of the different types of secondary structure in HSA and HSA incubated with 5 and 10 equivalents of complex 1 (B)
Fig. S3: Effect of citric acid (A) and EDTA (B) on the binding of complex 1 to HSA
Acknowledgements
Financial support from the NIH through grants 1S06GM 076168-04 to R.A. S-D., R01-AI060014 from the NIAID to R.S.M and GM 06298 and GM 008078 is gratefully acknowledged.
Abbreviations
- HSA
Human Serum Albumin
- CD
Circular Dichroism
- ITC
Isothermal Titration Calorimetry
- CQ
Chloroquine
- DP
Diphosphate
- en
ethylenediamine
- KTZ
Ketoconazole
- CTZ
Clotrimazole
- PTA
1,3,5-triaza-7-phosphaadamantane
- EDTA
Ethylenediaminetetraacetic acid
Footnotes
Publisher's Disclaimer: This is a PDF file of an unedited manuscript that has been accepted for publication. As a service to our customers we are providing this early version of the manuscript. The manuscript will undergo copyediting, typesetting, and review of the resulting proof before it is published in its final citable form. Please note that during the production process errors may be discovered which could affect the content, and all legal disclaimers that apply to the journal pertain.
References
- [1].Rademaker-Lakhai JM, Van Den Bongard D, Pluim D, Beijnen JH, Schellens JHM. Clin. Cancer Res. 2004;10:3717–3727. doi: 10.1158/1078-0432.CCR-03-0746. [DOI] [PubMed] [Google Scholar]
- [2].Trynda-Lemiesz L, Karaczyn A, Keppler BK, Kozlowski H. J. Inorg. Biochem. 2000;78:341–334. doi: 10.1016/s0162-0134(00)00062-3. [DOI] [PubMed] [Google Scholar]
- [3].Trynda-Lemiesz L, Kozlowski H, Keppler BK. J. Inorg. Biochem. 1999;77:141–146. doi: 10.1016/s0162-0134(99)00183-x. [DOI] [PubMed] [Google Scholar]
- [4].Trynda-Lemiesz L, Keppler BK, Kozlowski H. J. Inorg. Biochem. 1999;73:123–128. doi: 10.1016/s0162-0134(99)00004-5. [DOI] [PubMed] [Google Scholar]
- [5].Sánchez-Delgado RA, Lazardi K, Rincón L, Urbina JA, Hubert AJ, Noels AN. J. Med. Chem. 1993;36:2041–2043. doi: 10.1021/jm00066a014. [DOI] [PubMed] [Google Scholar]
- [6].Sánchez-Delgado RA, Navarro M, Lazardi K, Atencio R, Caparelli M, Vargas F, Urbina JA, Bouillez A, Noels AF, Masi D. Inorg. Chim. Acta. 1998;275–276:528–540. [Google Scholar]
- [7].Navarro M, Lehmann T, Cisneros EJ, Fuentes A, Sánchez-Delgado RA, Silva P, Urbina JA. Polyhedron. 2000;19:2319–2325. [Google Scholar]
- [8].Navarro M, Cisneros-Fajardo E, Lehmann T, Sánchez-Delgado RA, Atencio R, Silva R, Lira R, Urbina JA. Inorg. Chem. 2001;40:6879–6884. doi: 10.1021/ic0103087. [DOI] [PubMed] [Google Scholar]
- [9].Strasberg-Rieber M, Anzelloti A, Sánchez-Delgado RA, Rieber M. Int. J. Cancer. 2004;112:336–384. doi: 10.1002/ijc.20415. [DOI] [PubMed] [Google Scholar]
- [10].Martínez A, Rajapakse CSK, Jalloh D, Dautriche C, Sánchez-Delgado RA. J. Biol. Inorg. Chem. 2009;14:863–871. doi: 10.1007/s00775-009-0498-4. [DOI] [PMC free article] [PubMed] [Google Scholar]
- [11].Rajapakse CSK, Martínez A, Naoulou B, Jarzecki AA, Suárez L, Deregnaucourt C, Sinou V, Schrével J, Musi E, Ambrosini G, Schwartz GK, Sánchez-Delgado RA. Inorg. Chem. 2009;48:1122–1131. doi: 10.1021/ic802220w. [DOI] [PMC free article] [PubMed] [Google Scholar]
- [12].Martínez A, Rajapakse CSK, Sánchez-Delgado RA, Varela-Ramírez A, Lema C, Aguilera RJ. J. Inorg. Biochem. 2010;104:967–977. doi: 10.1016/j.jinorgbio.2010.05.002. [DOI] [PMC free article] [PubMed] [Google Scholar]
- [13].Chen H, Parkinson JA, Novakova O, Bella J, Wang F, Dawson A, Gould R, Parsons S, Brabec V, Sadler PJ. Proc. Natl. Acad. Sci. 2003;100:14623–14628. doi: 10.1073/pnas.2434016100. [DOI] [PMC free article] [PubMed] [Google Scholar]
- [14].Marini V, Christofis P, Novakova O, Kasparkova J, Farrell N, Brabec V. Nucleic Acids Res. 2005;33:5819–5828. doi: 10.1093/nar/gki884. [DOI] [PMC free article] [PubMed] [Google Scholar]
- [15].Scolaro C, Bergamo A, Brescacin L, Delfino R, Cocchietto M, Laurenczy G, Geldbach TJ, Sava G, Dyson PJ. J. Med. Chem. 2005;48:4161–4171. doi: 10.1021/jm050015d. [DOI] [PubMed] [Google Scholar]
- [16].Timerbaev AR, Hartinger CG, Aleksenko SS, Keppler BK. Chem. Rev. 2006;106:2224–2248. doi: 10.1021/cr040704h. [DOI] [PubMed] [Google Scholar]
- [17].Kratz F. In: Metal Complexes in Cancer Chemotherapy. Keppler BK, editor. VCH; Weinheim, Germany: 1993. p. 391. [Google Scholar]
- [18].McKeage MJ. Drug Safety. 1995;13:228–244. doi: 10.2165/00002018-199513040-00003. [DOI] [PubMed] [Google Scholar]
- [19].Carter DC, Ho JH. Advances in Protein Chemistry. 1994;45(45):153–203. doi: 10.1016/s0065-3233(08)60640-3. [DOI] [PubMed] [Google Scholar]
- [20].Espósito BP, Najjar R. Coord. Chem. Rev. 2002;232:137–149. [Google Scholar]
- [21].Sun H, Li H, Sadler PJ. Chem. Rev. 1999;99:2817–2842. doi: 10.1021/cr980430w. [DOI] [PubMed] [Google Scholar]
- [22].Messori L, Orioli P, Vullo D, Alessio E, Iengo E. Eur. J. Biochem. 2000;267:1206–1213. doi: 10.1046/j.1432-1327.2000.01121.x. E. [DOI] [PubMed] [Google Scholar]
- [23].Kratz F, Keppler BK, Messori L, Smith C, Baker EN. Met. Based Drugs. 1994;1:169–173. doi: 10.1155/MBD.1994.169. [DOI] [PMC free article] [PubMed] [Google Scholar]
- [24].Mura P, Camalli M, Casini A, Gabbiani C, Messori L. J. Inorg. Biochem. 2010;104:111–117. doi: 10.1016/j.jinorgbio.2009.10.002. [DOI] [PubMed] [Google Scholar]
- [25].Beaven GH, Chen SH, d'Albis A, Gratzer WB. Eur. J. Inorg. Biochem. 1974;41:539–546. doi: 10.1111/j.1432-1033.1974.tb03295.x. [DOI] [PubMed] [Google Scholar]
- [26].Martin DM, Chasteen ND, Grady JK. Biochim. Biophys. Acta. 1991;1076:252–258. doi: 10.1016/0167-4838(91)90275-5. [DOI] [PubMed] [Google Scholar]
- [27].Sánchez-Delgado RA, Navarro M, Pérez H, Urbina JA. J. Med. Chem. 1996;39:1095–1099. doi: 10.1021/jm950729w. [DOI] [PubMed] [Google Scholar]
- [28].Nagy B, Lehrer SS. Arch. Biochem. Biophys. 1972;148:27–36. doi: 10.1016/0003-9861(72)90111-7. [DOI] [PubMed] [Google Scholar]
- [29].Kratz F, Mulinacci N, Messori L, Bertini I, Keppler BK. In: Metal Ions in Biology and Medicine. Anastassopolou J, Collery Ph., Etienne JC, Theophanides Th., editors. vol.2. J. Libbey Eurotext; Paris: 1992. pp. 69–74. B.K. [Google Scholar]
- [30].Parker FS, Logan JL. J. Biol. Chem. 1952;199:889–895. [PubMed] [Google Scholar]
- [31].Huang Y, Pan W, Guo M, Yao S. J. Chrom. A. 2007;1154:373–378. doi: 10.1016/j.chroma.2007.02.029. [DOI] [PubMed] [Google Scholar]
- [32].Navarro M, Pérez H, Sánchez-Delgado RA. J. Med. Chem. 1997;40:1937–1939. doi: 10.1021/jm9607358. [DOI] [PubMed] [Google Scholar]
- [33].Navarro M, Vásquez F, Sánchez-Delgado RA, Pérez H, Sinou V, Schrevel J. J. Med. Chem. 2004;47:5204–5209. doi: 10.1021/jm049792o. [DOI] [PubMed] [Google Scholar]
- [34].He XM, Carter D. Nature. 1992;358:209–215. doi: 10.1038/358209a0. [DOI] [PubMed] [Google Scholar]
- [35].Ohta N, Chen D, Ito S, Futo T, Yotsuyangi T, Ikeda K. Int. J. Pharmaceut. 1995;118:85–93. [Google Scholar]
- [36].Trynda-Lemiesz L, Pruchnik F. J. Inorg. Biochem. 1997;66:187–192. doi: 10.1016/s0162-0134(96)00202-4. [DOI] [PubMed] [Google Scholar]
- [37].Brindell M, Stawoska I, Supel J, Skoczowski A, Stochel G, Eldik R. J. Biol. Inorg. Chem. 2008;13:909–918. doi: 10.1007/s00775-008-0378-3. [DOI] [PubMed] [Google Scholar]
- [38].Trynda-Lemiesz L, Kozlowski H, Katsaros N. Met. Based Drugs. 2000;7:293–299. doi: 10.1155/MBD.2000.293. [DOI] [PMC free article] [PubMed] [Google Scholar]
- [39].Scaria PV, Craig JC, Shafer RH. Biopolymers. 1993;33:887–895. doi: 10.1002/bip.360330604. [DOI] [PubMed] [Google Scholar]
- [40].Peters T., Jr. Clin. Chem. 1977;23(1):5–12. [PubMed] [Google Scholar]
- [41].Hrkal Z, Kociczek M, Vodrazka Z, Meloun B, Moravek L. Int. J. Biochem. 1978;9:349–355. doi: 10.1016/0020-711x(78)90110-6. [DOI] [PubMed] [Google Scholar]
- [42].Blauer G, Harmatz D, Naparstek A. FEBS Lett. 1970;9:53–55. doi: 10.1016/0014-5793(70)80309-x. [DOI] [PubMed] [Google Scholar]
- [43].Trynda-Lemiesz L, Prywarska-Boniecka H, Kosciukiewicz T. Inorg. Chim. Acta. 1987;135:55–60. [Google Scholar]
- [44].Mishra H, Mukherjee R. J. Organom. Chem. 2007;692:3248–3260. [Google Scholar]
- [45].Timerbaev AR, Rudnev AV, Semenova O, Hartinger CG, Keppler BK. Anal. Biochem. 2005;341:326–333. doi: 10.1016/j.ab.2005.03.020. [DOI] [PubMed] [Google Scholar]
- [46].Zhang Y, Wilcox DE. J. Biol. Inorg. Chem. 2002;7:327–337. doi: 10.1007/s00775-001-0302-6. [DOI] [PubMed] [Google Scholar]
- [47].Zhang Y, Akilesh S, Wolcow DE. Inorg. Chem. 2000;39:3057–3064. doi: 10.1021/ic000036s. [DOI] [PubMed] [Google Scholar]
- [49].Young SP, Bomford A, Williams R. Biochem. J. 1984;219:505–510. doi: 10.1042/bj2190505. [DOI] [PMC free article] [PubMed] [Google Scholar]
- [48].Saboury AA. J. Chem. Thermodynamics. 2003;35:1975–1981. [Google Scholar]
- [50].Tang S, MacColl R, Parsons PJ. J. Inorg. Biochem. 1995;60:175–185. doi: 10.1016/0162-0134(95)00018-j. [DOI] [PubMed] [Google Scholar]
- [51].Tomimatsu Y, Vickery LE. Biochim. Biophys. Acta. 1972;285:72–83. doi: 10.1016/0005-2795(72)90181-x. [DOI] [PubMed] [Google Scholar]
- [52].Crichton RR, Ward RJ. Biochemistry. 1992;31:11255–11264. doi: 10.1021/bi00161a001. [DOI] [PubMed] [Google Scholar]
- [53].Baker EN, Lindley PF. J. Inorg. Biochem. 1992;47:147–160. doi: 10.1016/0162-0134(92)84061-q. [DOI] [PubMed] [Google Scholar]
- [54].Trowbridge IS, Collawn J, Jing S, White S, Esekogwu V, Stangel M. In: Biotechnology of Plasma Proteins: Haemostasis, Thrombosis and Iron Proteins. Hemker HC, editor. vol. 58. S. Karger; AG Basel, Switzerland: 1991. pp. 139–147. [Google Scholar]
- [55].Faulk WP, Harats H, Berczi A. In: Oxidoreduction at the Plasma Membrane. Crane FL, Morre JD, Low H, editors. Vol. 1. CRC Press Inc.; Boca Raton, FL: 1990. pp. 205–224. [Google Scholar]
- [56].Cazzola M, Bergamaschi G, Dezza L, Arosio P. Blood. 1990;75:1903–1919. [PubMed] [Google Scholar]
- [57].Kratz F, Hartmann M, Keppler BK, Messori L. J. Biol. Chem. 1994;269:2581–2588. [PubMed] [Google Scholar]
- [58].Hongyan LI, Sadler PJ, Sun H. Eur. J. Biochem. 1996;242:387–393. doi: 10.1111/j.1432-1033.1996.0387r.x. [DOI] [PubMed] [Google Scholar]
- [59].Tinoco AD, Valentine AM. J. Am. Chem. Soc. 2005;127:11218–11219. doi: 10.1021/ja052768v. [DOI] [PubMed] [Google Scholar]
- [60].Martin RB, Savory J, Brown S, Bertholf RL, Wills MR. Clin. Chem. 1987;33(3):405–407. [PubMed] [Google Scholar]
- [61].Lin LN, Mason AB, Woodworth RC, Brandts JF. Biochemistry. 1993;32:9398–9406. doi: 10.1021/bi00087a019. [DOI] [PubMed] [Google Scholar]
- [62].Lin LN, Mason AB, Woodworth RC, Brandts JF. Biochemistry. 1991;30:11660–11669. doi: 10.1021/bi00114a008. [DOI] [PubMed] [Google Scholar]
Associated Data
This section collects any data citations, data availability statements, or supplementary materials included in this article.
Supplementary Materials
Fig. S1: Visible region of the CD spectra of HSA incubated with increasing amounts of complexes 1 (A) and 2 (B) at 37°C for 20 h.
Fig. S2: Intrinsic CD region of HSA after incubation at 37°C for 20 h with 10 eq of complex 1 (A) and composition distribution of the different types of secondary structure in HSA and HSA incubated with 5 and 10 equivalents of complex 1 (B) Fig. S2: Intrinsic CD region of HSA after incubation at 37°C for 20 h with 10 eq of complex 1 (A) and composition distribution of the different types of secondary structure in HSA and HSA incubated with 5 and 10 equivalents of complex 1 (B)
Fig. S3: Effect of citric acid (A) and EDTA (B) on the binding of complex 1 to HSA


