

Abstract
Animal studies reveal that fasting and caloric restriction produce increased activity of specific metabolic pathways involved in resistance to weight loss in liver. Evidence suggests that this phenomenon may in part occur through the action of the constitutive androstane receptor (CAR, NR1I3). Currently, the precise molecular mechanisms that activate CAR during fasting are unknown. We show that fasting coordinately induces expression of genes encoding peroxisome proliferator-activated receptor γ coactivator-1α (PGC-1α), CAR, cytochrome P-450 2b10 (Cyp2b10), UDP-glucuronosyltransferase 1a1 (Ugt1a1), sulfotransferase 2a1 (Sult2a1), and organic anion-transporting polypeptide 2 (Oatp2) in liver in mice. Treatments that elevate intracellular cAMP levels also produce increased expression of these genes in cultured hepatocytes. Our data show that PGC-1α interaction with hepatocyte nuclear factor 4α (HNF4α, NR2A1) directly regulates CAR gene expression through a novel and evolutionarily conserved HNF4-response element (HNF4-RE) located in its proximal promoter. Expression of PGC-1α in cells increases CAR expression and ligand-independent CAR activity. Genetic studies reveal that hepatic expression of HNF4α is required to produce fasting-inducible CAR expression and activity. Taken together, our data show that fasting produces increased expression of genes encoding key metabolic enzymes and an uptake transporter protein through a network of interactions involving cAMP, PGC-1α, HNF4α, CAR, and CAR target genes in liver. Given the recent finding that mice lacking CAR exhibit a profound decrease in resistance to weight loss during extended periods of caloric restriction, our findings have important implications in the development of drugs for the treatment of obesity and related diseases.
Energy homeostasis must be tightly regulated. In humans, long term energy imbalance can lead to various diseases (1-3). For example, obesity develops when energy intake exceeds energy expenditure over time. On the other hand, cachexia results when energy expenditure exceeds energy intake over a period of time. During caloric restriction or fasting, mammals exhibit a significant decrease in basal metabolic rate in an effort to maintain energy homeostasis and prolong life. It has been shown that starvation can decrease the basal metabolic rate as much as 40% (4). Although the decrease in basal metabolic rate represents a defense mechanism for mammals to survive during times of food shortage, it also creates a barrier to weight loss in obese individuals during caloric restriction.
Serum thyroid hormones (THs)2 and other hormones, including cortisol and leptin, are important molecular signals that modulate weight loss and energy homeostasis in mammals. THs are synthesized by the thyroid gland and are metabolized in peripheral tissues. The major forms of THs are thyroxine (T4) and triidothyronine (T3), with T3 being the biologically active form. T3 performs its function primarily through its agonist activity against the thyroid hormone receptor (5), a member of the nuclear receptor superfamily of ligand-activated transcription factors. T3 is derived from T4 through outer ring deiodination catalyzed by type I deiodinase (6). This enzyme also catalyzes inner ring deiodination, thereby producing the inactive reverse T3. When T4 is sulfated by the hepatic sulfotransferases (SULTs), the outer ring deiodination becomes undetectable, while the rate of the inner ring deiodination increases over 100-fold (7). Therefore, hepatic SULTs are extremely important in the regulation of levels and activity of THs. In addition to sulfation, conjugation by UDP-glucuronosyltransferases (UGTs), specifically the UGT1 family members, also regulates circulating TH levels (8). Conjugation of a glucuronide moiety by UGTs in liver increases the water solubility of THs, leading to increased TH excretion in bile.
Plasma TH levels decrease dramatically during fasting (9-11). Recent data show that the decrease in TH levels during fasting is largely dependent on the nuclear constitutive androstane receptor (CAR) (9). CAR is mainly expressed in liver in mice, where it regulates many Phase I and Phase II biotransforming enzymes, including Cyp2b10, Sult2a1, SultN, and Ugt1a1. CAR also regulates expression of membrane transporter proteins such as organic anion transporting peptide 2 (Oatp2) and multidrug resistance-associated proteins (12-22). In addition to drug transport and metabolism, these proteins are also involved in the metabolism, transport, and excretion of THs and other endobiotic compounds, including many steroids and bile acids. Using CAR-knock-out mice, it has been clearly demonstrated that both TH-metabolizing genes are increased and serum TH levels are decreased in a CAR-dependent manner during fasting in mice (9). However, the molecular mechanisms underlying CAR activation and induction of CAR target genes during fasting remain totally unknown.
The intracellular concentration of cAMP rises during fasting. Therefore, we hypothesized that the activation of CAR during fasting is a cAMP-dependent phenomenon. In this report, we show that both CAR target genes, including Cyp2b10, Oatp2, Sult2a1, and Ugt1a1, as well as the CAR gene itself, are induced in mouse liver during fasting. Treatment of primary mouse hepatocytes with the β-adrenergic agonist epinephrine also induces both CAR and CAR target genes. This effect is mimicked by the cAMP analogue 8-Br-cAMP. Reporter gene studies demonstrate that the CAR promoter is regulated by the hepatocyte nuclear factor 4α (HNF4α). Furthermore, the fasting-and cAMP-inducible coactivator PPARγ coactivator 1α (PGC-1α) coactivates HNF4α on the CAR promoter. Gel mobility shift assays and chromatin immunoprecipitation assays show that HNF4α directly regulates the CAR promoter through an evolutionarily conserved consensus HNF4α response element (HNF4-RE) identified in the mouse and human CAR promoters. In addition we show that PGC-1α coactivates CAR on the native Cyp2b10 promoter. Additional fasting experiments performed using liver-specific HNF4α-knock-out (HNF4α-KO) mice demonstrate that HNF4α is required in vivo for both basal and fasting-inducible CAR gene expression. Moreover, these experiments reveal that HNF4α is required to produce induction of known CAR target genes, including Cyp2b10, Oatp2, Sult2a1, and Ugt1a1. Our results suggest that fasting mediates CAR activation by increasing CAR gene expression and ligand-independent CAR activity. Our results further suggest that increased intracellular cAMP concentration play a key role in regulating a network of interactions involving PGC-1α, HNF4α, CAR, and CAR target genes in liver.
MATERIALS AND METHODS
Animal Care
Pregnane x receptor (PXR) wild-type and knock-out mice (23) and liver-specific HNF4α-knock-out and the wild-type flox mice (24) were described previously. Animals were maintained on standard laboratory chow and were allowed food and water ad libitum. The studies reported here have been carried out in accordance with the Declaration of Helsinki and/or with the Guide for the Care and Use of Laboratory Animals as adopted and promulgated by the National Institutes of Health.
Compounds and Plasmids
Unless otherwise stated, all chemical compounds were purchased from Sigma. The pSG5-mCAR plasmid was previously described (25). The pcDNA-mPGC-1α was a kind gift of Dr. Bryan Goodwin (GlaxoSmithKline, Research Triangle Park, NC). Cyp2b10-LUC was described previously (26). The pSV-β-Gal plasmids are commercially available (Invitrogen). The HNF4α, GR, ER, RXRα, and PPARγ mammalian expression vectors were previously described (27-30). The 4.6-kb mCAR promoter region was first amplified from a mouse BAC clone using PCR with the following oligonucleotides: left, 5′-CTAGAG-CAGGCTTAATCTGTC-3′; right, 5′-GGTCTCCTGAAT-GTGGGAGG-3′. The resulting 4.6-kb CAR promoter fragment was then directly cloned into pGEM-T-EZ vector (Promega, Madison, WI) and sequenced to ensure integrity of the DNA sequence. To generate the MluI restriction sites for sub-cloning, the following oligonucleotides were used: 5′-GACGGCACGCGTCTAGAGCAGGCTTAATCTGTC-3′; right, 5′-GACGGCACGCGTGGTCTCCTGAATGTGGG-AGG-3′. The resulting PCR product was then inserted into the MluI site of pGL3 basic (Promega) to generate the 4.6-CAR-Luc. To clone the 0.85-kb fragment, the following oligonucleotides were used to amplify a 4.6-kb fragment from the BAC clone: left, 5′-CTAGAGCAGGCTTAATCTGTC-3′; right, 5′-GACGGC-GAGCTCGGTCTCCTGAATGTGGGAGG-3′. The resulting PCR product was then digested with SacI to obtain a 0.85-kb fragment, which was then subcloned into the SacI site of pGL3 basic to generate 0.85-CAR-Luc. To generate 0.45-CAR-Luc and 0.35-CAR-Luc, the following oligonucleotides were used to amplify fragments from 0.85-CAR-Luc: 0.45 kb, left, 5′-GACGGCGAGCTCAACACTTCTCGGGCATGCTAG-3′; right, 5′-GACGGCGAGCTCGGTCTCCTGAATGTGGGAGG-3′; 0.35 kb, left, 5′-GACGGCGAGCTCGAGGATACCTAGAGGCCCCATG-3′; right, 5′-GACGGCGAGCTCGGTCTCCTGAATGTGGGAGG-3′. The amplified fragments were then subcloned into the SacI site of pGL3 basic. Site-directed mutagenesis of the HNF4-response element (HNF4-RE) was performed using the following oligonucleotides: left, 5′-CCACCCCACACCCACACCCATTTCTTTTTCCTGGGTCCAGAGTCTGGGTCCTAC-3′; right, 5′-GTAGGACCCAGACTCTGGACCCAGGAAAAAGAAATGGGTGTGGGTGTGGGGTGG-3′. Site-directed mutagenesis was performed using the QuikChange site-directed mutagenesis kit (Stratagene). All cloned constructs were verified with DNA sequencing.
Hepatocyte Cultures, RNA Isolation, and Real-time Quantitative PCR
Mouse and rat hepatocytes were isolated using a two-step perfusion as described previously (31). About 48 h post-plating, hepatocytes were treated with drugs or previously described adenoviral expression vectors in maintenance medium for a period of time as indicated in the Figs. before RNA isolation. Total RNA was isolated using TRIzol reagent (Invitrogen) according to the manufacturer’s instructions. RNA (10 μg/lane) was resolved on 3.7% formaldehyde 1% agarose gel to verify the integrity of the RNA. One microgram of DNaseI-treated RNA was reverse-transcribed using random primers following the manufacturer’s instruction (Promega). Equal amounts of cDNA were used in real-time quantitative PCR reactions. Reactions included 200 nm fluorogenic probe and 300 nm primers specific for each gene. The fluorogenic probe and primer sets were designed using the Primer3 program (frodo.wi.mit.edu/cgi-bin/primer3/primer3_www.cgi). BioSearch Technologies (Novato, CA) synthesized the fluorogenic probes. The sequences (5′ to 3′) for the primers and probes are as follows: PGC-1α, forward primer (CATTTGATGCACTGACAGATGGA), fluorogenic probe (FAM-CCGTGACCACTGACAACGAGGCC-BHQ1), reverse primer (CCGTCAGGCATGGAGGAA); CAR, forward primer (TCAACACGTTTATGGTGCAA), fluorogenic probe (FAM-CAGATCTCCCTTCTCAAGGGAGCG-BHQ1), reverse primer (CTGCGTCCTCCATCTTGTAG); PXR, forward primer (GCCGATGTGTCAACCTACAT), fluorogenic probe (FAM-TGAGGACCAGATCTCCCTGCTGAA-BHQ1), reverse primer (CTCAGGATGCACATCTCAAA); GR, forward primer (GTGTCACTGCTGGAGGTGAT), fluorogenic probe (FAM-ATGTTAGGTGGGCGCCAAGTGATT-BHQ1), reverse primer (GCAAATGCCATGAGAAACAT); Cyp2b10, forward primer (GACTTTGGGATGGGAAAGAG), fluorogenic probe (FAM-TAGTGGAGGAACTGCGGAAATCCC-BHQ1), reverse primer (CCAAACACAATGGAGCAGAT); Oatp2, forward primer (TTGCTGACTGCAACACAAAG), fluorogenic probe (FAM-CTGCTTAACGAACACATGGGACCC-BHQ1), reverse primer (TGGTTCCAGTTCCAACAGAC); Sult2a1, forward primer (GTCCATGAGAGAATGGGACA), fluorogenic probe (FAM-CCAGATGAGCTGGATCTCGTCCTC-BHQ1), reverse primer (CAGCTTGGGCTACTGTGAAG); and Ugt1a1, forward primer (AGATCTCTGGCAGCATCAGA), fluorogenic probe (FAM-TGTTGTGTGTGTTCGGTCCCTCTG-BHQ1), reverse primer (TCCAAGCATACTCAGCCAGT). For 18 S, 1× SYBR Green (BioWhittaker Molecular Applications, Rockland, ME) was included in the reaction instead of the fluorogenic probe. The sequences (5′ to 3′) for the 18 S primers are as follows: forward primer (AGTCCCTGCCCT TTGTACACA), reverse primer (CGATCCGAGGGCCTCACTA). Cycling conditions were described previously (31). The -fold induction was calculated as described (32).
Cell Culture and Transient Transfection of CV-1 Cells
CV-1 cells were plated on 96-well plates as described previously (27, 33). The Cyp2b10-LUC reporter gene assays were performed as described (31). Briefly, each well was transfected with 20 ng of the reporter gene Cyp2b10-LUC, 5 ng of pSG5-mCAR, 0–10 ng of pcDNA-mPGC-1α, and 40 ng of SV-β-gal and added with pBluescript to 110 ng of total DNA per well. CAR promoter analysis was performed on the following website: polly.wustl.edu/promolign/showSVG.asp?ortholog_id=ortho_537. To screen for transcription factors that transactivate mouse CAR promoter with PGC-1α, each well was transfected with 20 ng of the 4.6-CAR-LUC reporter gene, 5 ng of expression vector for the transcription factor, 10 ng of pcDNA or pcDNA-mPGC-1α, and 40 ng of pSV-β-GAL (Invitrogen) and added with pBluescript to 110 ng of total DNA per well. 24 h post-transfection, cells were drug-treated for 24 h. The luciferase activities were determined using the luciferase assay system per the manufacturer’s instructions (Promega) and normalized to β-galactosidase activities. β-Galactosidase activities were measured using an o-nitrophenyl β-d-galactopyranoside (ONPG) assay (Sigma). For the ONPG assay, 110 mg of ONPG was dissolved in 100 ml of 0.1 m NaHPO4 buffer, which was made by mixing 6.84 ml of 1 m Na2HPO4, 3.16 ml of 1 m NaH2PO4, and 90 ml of H2O. 20 μl of cell lysate and 200 μl of ONPG buffer was mixed, and the mixture was incubated at 37 °C for 30–60 min and read at 420 nm.
Gel Mobility Shift Assay
Human HNF4α protein was synthesized in vitro using the TnT rabbit reticulocyte system (Promega) according to the manufacturer’s instructions. Each gel mobility shift assay contained 10 mm Tris (pH 8.0), 60 mm KCl, 0.1% Nonidet P-40, 6% glycerol, 1 mm dithiothreitol, 0.2 μg of poly(dI-dC), and 3 μl of in vitro translated HNF4α protein or unprogrammed cell lysate as a control. Competitor oligonucleotides were included at 25-, 50-, or 100-fold excess as indicated in the Figs. After 10-min incubation on ice, 10 ng of 32P-labled oligonucleotide was added. After an additional 10-min incubation on ice, DNA-protein complexes were resolved on a 4% polyacrylamide gel in 0.5× TBE (1× TBE contains 90 mm Tris, 90 mm boric acid, and 2 mm EDTA). Gels were dried at 70 °C for 2 h and subjected to autoradiography at −70 °C overnight. The following double-stranded oligonucleotides were used either as radiolabeled probes or as non-radioactive competitors: CAR-HNF4-RE, 5′-GATCACACCCAGGTCTTTGCCCTGGGTCC-3′; mutant CAR-HNF4-RE, 5′-GATCACACCCATTTCTTTTTCCTGGGTCC-3′; and CYP7A-HNF4-RE (34), 5′-GATCCTATGGACTTAGTTCAAGGCCG-3′. The bolded sequences are the predicted consensus HNF4α-binding sites.
Chromatin Immunoprecipitation
50 mg of adult mouse liver was passed through a 19-gauge needle, then a 21-gauge needle, in 1 ml of hepatocyte plating medium to make the tissue suspension. DNA-protein cross-linking was performed by incubating liver tissue suspension with formaldehyde at a final concentration of 1% for 10–15 min at 37 °C with gentle shaking. Adding glycine to 0.125 m terminated the cross-linking reaction. Chromatin immunoprecipitation (ChIP) assays were performed using the ChIP assay kit (Upstate, Lake Placid, NY) according to the manufacturer’s instructions. 10 μg of anti-human HNF4α mouse monoclonal antibody (Clone K9218, Perseus Proteomics Inc.) or control antibody anti-FLAG M2 (Stratagene, La Jolla, CA) were used for immunoprecipitation. Precipitated DNA was purified by phenol/chloroform/isoamyl alcohol extraction and ethanol precipitation. Purified DNA was dissolved in 20 μl of water. 2 μl of DNA was PCR-amplified using Ex-taq (Takara Bio Inc., Otsu, Shiga, Japan) for 45 cycles (95 °C for 30 s, 60 °C for 30 s, and then 68 °C for 30 s). Non-precipitated genomic DNA was included as input control. The following primers were used: CAR −159/+140, forward primer (CTCACCCACAGGGAAATCCTCC), reverse primer (CTGACCCTGCTTTCCTTGAGATC); CAR −1351/−1031, forward primer (CTGCTAATCTGTGAACTGTACTGC), reverse primer (CAACCCTGATACCTGGTGCCAG); mouse proline oxidase (PO) −250/+24 primers were described previously (35). PCR products were resolved on 2% agarose gels containing ethidium bromide.
RESULTS
Co-regulation of PGC-1α, CAR, and CAR Target Genes by Fasting, Epinephrine, and cAMP
The induction of Cyp2b10, Sult2a1, and Ugt1a1 has been well characterized in mouse liver following fasting (9). Because PGC-1α is a fasting-inducible protein cofactor that interacts with multiple nuclear receptors, and because it was recently demonstrated that PGC-1α coactivates a chimerical GAL4-CAR fusion protein on the artificial luciferase reporter gene UAS-LUC (36), we hypothesized that the induction of CAR target genes by fasting was mediated through interaction between CAR and PGC-1α in liver.
To investigate the plausibility of our hypothesis, we measured the mRNA levels of PGC-1α, Cyp2b10, Sult2a1, and Ugt1a1 in mouse livers following 24-h fasting by real-time quantitative PCR. As expected, the expression of PGC-1α, Cyp2b10, Sult2a1, and Ugt1a1 were all increased following a period of 24-h fasting (Fig. 1). In addition, we found that fasting produced an increase in the expression of the Oatp2 gene. Because Cyp2b10, Sult2a1, Ugt1a1, and Oatp2 are co-regulated by PXR and CAR, we measured the levels of PXR and CAR mRNA following fasting. Interestingly, the level of CAR expression was dramatically increased in mouse liver following fasting, whereas the level of PXR mRNA remained unchanged.
FIGURE 1. Induction of PGC-1α, CAR, and CAR target genes in mouse liver by fasting.
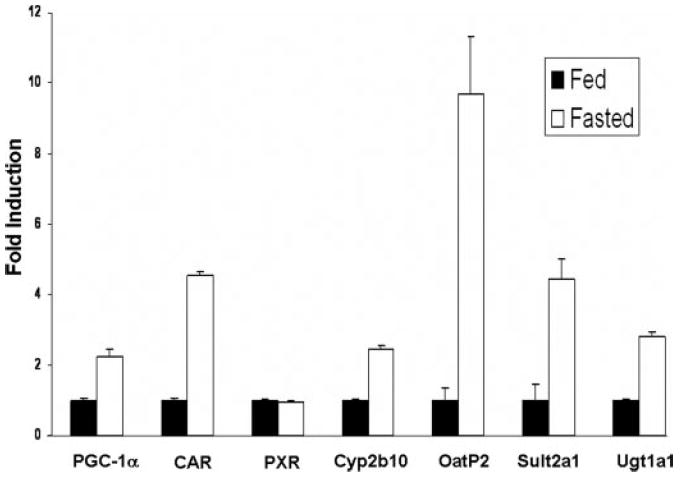
Total RNA was isolated from the livers of mice with or without 24-h fasting. RNA was pooled from thee mouse livers. Real-time quantitative PCR analyses were performed for the expression of PGC-1α, PXR, CAR, Cyp2b10, Sult2a1, Oatp2, and Ugt1a1. Data represent average ± S.E. (n = 3). All data are normalized to 18 S rRNA levels.
Fasting produces increased intracellular concentrations of cAMP in liver through the action of the G-protein-coupled receptor ligands epinephrine and glucagon. We therefore hypothesized that the induction of CAR and CAR target genes in hepatocytes is a cAMP-dependent phenomenon. To test this hypothesis, we first treated primary mouse hepatocytes with epinephrine. Epinephrine treatment produced increases in PGC-1α, CAR, and all CAR target genes tested, including Cyp2b10, Sult2a1, Ugt1a1, and Oatp2 (Fig. 2). Epinephrine treatment had no effect upon the expression of the pxr gene (data not shown).
FIGURE 2. Induction of PGC-1α, CAR, and CAR target genes in primary mouse hepatocytes by epinephrine.
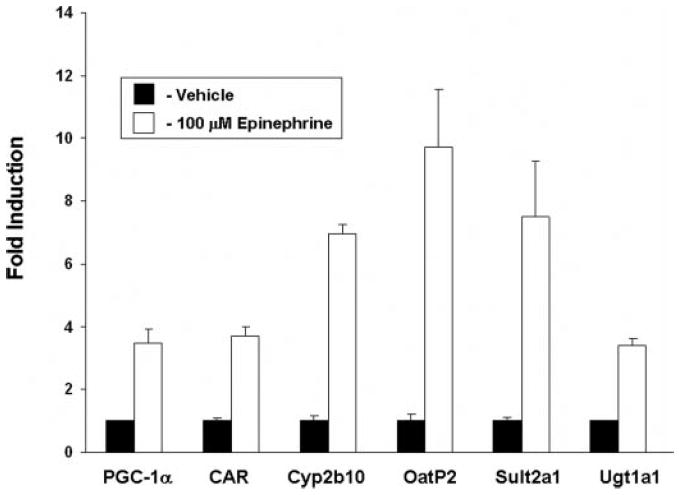
Primary cultures of mouse hepatocytes were treated with vehicle or epinephrine (100 μm) for 24 h before RNA isolation. Real-time quantitative PCR analyses were performed for the expression of PGC-1α, CAR, Cyp2b10, Sult2a1, Oatp2, and Ugt1a1. Data represent average ± S.E. (n = 3). All data are normalized to 18 S rRNA levels.
We next sought to determine both the time course and the extent to which induction of PGC-1α, CAR, and CAR target gene expression in hepatocytes is dependent upon increased cAMP concentrations. We therefore treated primary cultures of mouse hepatocytes with 8-Br-cAMP, the cell-permeable/PKA-activating cAMP analogue. Kinetic analysis revealed that 8-Br-cAMP treatment produced increased PGC-1α gene expression very early. The level of PGC-1α expression was near its maximum by the 4-h time point, and it remained elevated through the 48-h time point (Fig. 3A). Induction of CAR gene expression was not observed until the 24-h time point and continued increasing through the 48-h time point. The induction of Cyp2b10, the prototypical CAR target gene, was maximized after the 48-h time point, but was still observable at 24-h time point. A similar kinetic pattern of induction was observed with all other CAR target genes investigated (Table 1). This kinetic pattern of gene expression in which PGC-1α levels increase early, followed by CAR, followed by all CAR target genes examined led to the hypothesis that increased PGC-1α produces increased CAR expression and activity.
FIGURE 3. Induction of PGC-1α, CAR, PXR, GR, and Cyp2b10 in wild-type and PXR-KO primary hepatocytes by 8-Br-cAMP.
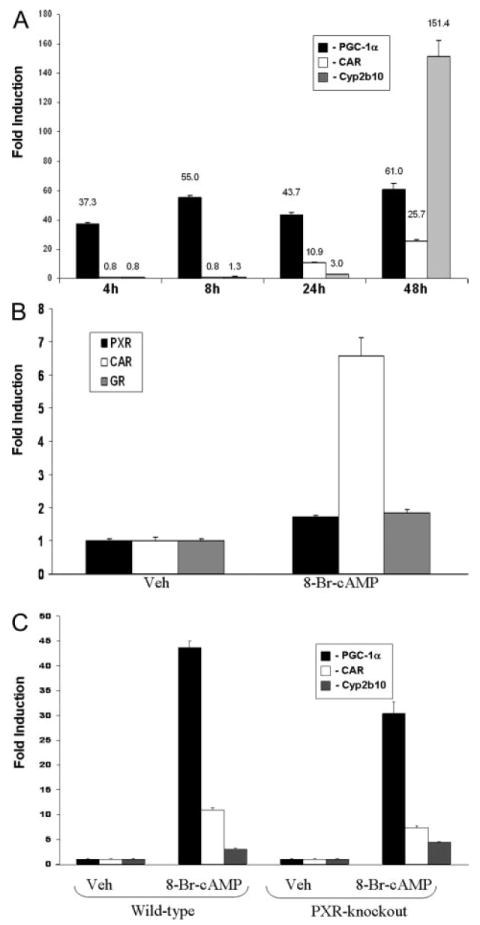
A, primary cultures of mouse hepatocytes were treated with vehicle or 8-Br-cAMP (1 mm) for 4, 8, 24, and 48 h before RNA isolation. Real-time quantitative PCR analyses were performed for the expression of PGC-1α, CAR, and Cyp2b10. B, primary cultures of mouse hepatocytes were treated with vehicle or 8-Br-cAMP (1 mm) for 24 h before RNA isolation. Real-time quantitative PCR analyses were performed for the expression of PXR, CAR, and GR. C, primary cultures of mouse hepatocytes isolated from wild-type and PXR knock-out mice were treated with vehicle or 8-Br-cAMP (1 mm) for 24 h before RNA isolation. Real-time quantitative PCR analyses were performed for the expression of PGC-1α, CAR, and Cyp2b10. Data represent average ± S.E. (n = 3). All data are normalized to 18 S rRNA levels.
Table 1. Time-dependent induction of PGC-1α, CAR, and CAR target genes by 8-Br-cAMP.
Primary mouse hepatocytes were treated with vehicle or 8-Br-cAMP (1mm) for 4, 8, 24, and 48 h before RNA isolation. Real-time quantitative PCR analyses were performed for the expression of PGC-1α, CAR, and CAR target genes. The data represent average ± S.E. (n=3) and are expressed as -fold induction over vehicle control. All data are normalized to 18 S rRNA levels.
| Time |
||||
|---|---|---|---|---|
| 4 h | 8 h | 24 h | 48 h | |
| -fold induction (±S.E.) | ||||
| PGC-1α | 37.3 (1.3) | 55 (1.6) | 43.7 (1.3) | 61 (3.9) |
| CAR | 0.8 (0.2) | 0.8 (0.2) | 10.9 (0.5) | 25.7 (1.0) |
| Cyp2b10 | 0.8 (0.1) | 1.3 (0.1) | 3 (0.1) | 151.4 (11.0) |
| OatP2 | 2.5 (0.3) | 12.3 (0.4) | 16 (1.1) | 169.4 (4.2) |
| Sult2a1 | 1.6 (0.5) | 37.9 (3.0) | 29.9 (2.0) | 98.1 (7.6) |
| Ugt1a1 | 0.8 (0.0) | 1.8 (0.0) | 1.7 (0.0) | 18.5 (0.6) |
To determine the extent to which the intracellular cAMP signal transduction pathway is specifically linked to increased expression of CAR in liver, we also measured the mRNA levels of PXR and GR following 24 h of treatment of cultured hepatocytes with 8-Br-cAMP. As shown in Fig. 3B, the expression of CAR was induced by treatment with 8-Br-cAMP, whereas PXR and GR mRNA levels were unaffected. To determine whether PXR is directly involved in the response to cAMP, we treated primary cultures of hepatocytes isolated from wild-type and PXR-knock-out mice with 8-Br-cAMP for 24 h and investigated the induction of Cyp2b10 gene expression. The induction of Cyp2b10 and CAR gene expression produced by 8-Br-cAMP remained intact in PXR-KO hepatocytes (Fig. 3C). These data suggest that the transcriptional response to increased intracellular cAMP is CAR-specific and that increased Cyp2b10 expression following activation of the PKA signaling pathway is a PXR-independent phenomenon.
Regulation of CAR Promoter Activity by HNF4α and PGC-1α
It is well characterized that fasting induces PGC-1α gene expression through the PKA signal transduction pathway (37). Increased PGC-1α levels produce increased PEPCK promoter activity through direct interaction with HNF4α, glucocorticoid receptor (GR) and the forkhead box transcription factor FOXO1 (38-40). A GR-response element has been reported in the human CAR promoter (41). We therefore sought to determine whether these transcription factors might also directly regulate the expression of the car gene through its promoter. Using a computer-based search algorithm, we identified a previously uncharacterized and evolutionarily conserved HNF4α-RE located in the proximal promoter region of the mouse and human CAR promoter (Fig. 4A). We next isolated the 4.6-kb fragment of the proximal mouse CAR promoter and placed it upstream of the luciferase reporter gene as described under “Materials and Methods.” This reporter gene was termed 4.6-CAR-LUC. CV-1 cells were transfected with the 4.6-CAR-LUC reporter gene together with various transcription factors in the absence as well as in the presence of PGC-1α. Cotransfection of HNF4α produced marked increases in luciferase activity (Fig. 4B). No other transcription factor tested in this analysis activated the 4.6-CAR-LUC reporter gene. Addition of PGC-1α produced further increases in reporter activity specifically in the presence of HNF4α. Interestingly, GR seems to have little or no effect on the CAR promoter sequence examined here. As shown in Fig. 4C, HNF4α induced reporter gene activity in a dose-dependent manner. Addition of a constant amount of PGC-1α (10 ng) to transfection mixtures further induced reporter gene activity, suggesting that PGC-1α interacts with and coactivates HNF4α directly on the CAR promoter.
FIGURE 4. PGC-1α coactivates HNF4α on the CAR promoter.
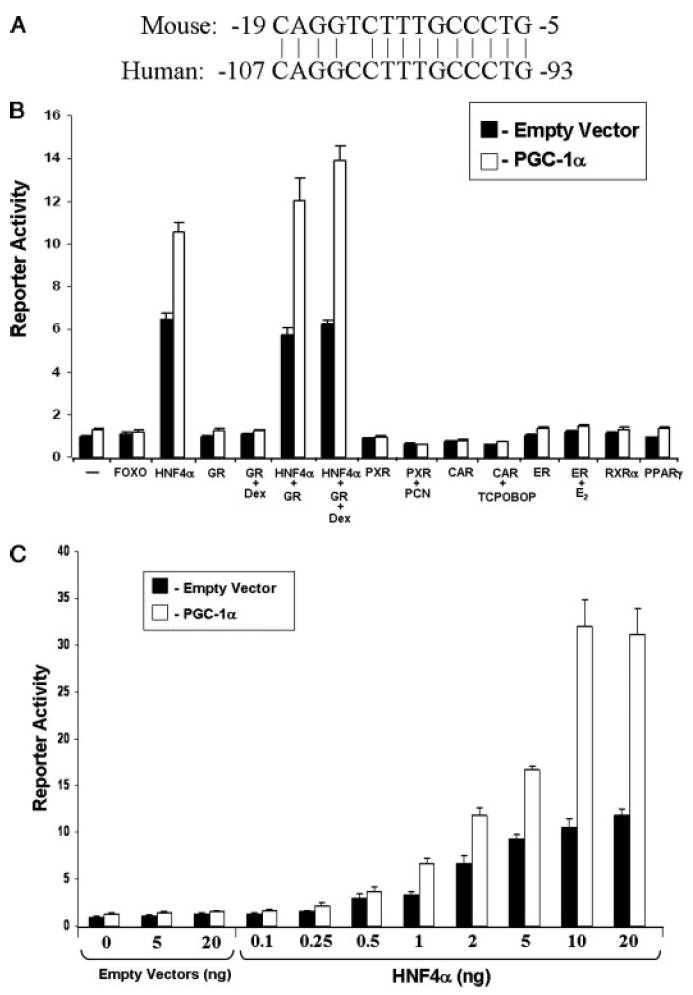
A, the HNF4α response element is conserved between the mouse and the human CAR promoters. The position of CAR transcription start site is designated as “+1” across the text. B, CV-1 cells were transfected with the 4.6-CAR-LUC reporter gene (20 ng) and the expression vectors (5 ng) encoding various transcription factors in the presence of the empty vector pcDNA or pcDNA-PGC-1α (10 ng) and treated with indicated drugs or vehicle for 24 h. Dex, dexamethasone (1 μm); PCN, pregnenolone 16α-carbonitrile (10 μm); TCPOBOP, 1,4 bis[2-(3,5-dichloropyridyloxy)]benzene (10 μm); E2, 17β-estradiol (100 nm). C, CV-1 cells were transfected with the 4.6-CAR-LUC reporter gene (20 ng) and indicated amounts of the expression vector (0–20 ng) encoding HNF4α in the presence of the empty vector pcDNA or pcDNA-PGC-1α (10 ng). The data represent average ± S.E. (n = 4) and are normalized against β-galactosidase activity.
To determine whether the potential HNF4-RE is required for regulation of the CAR promoter by HNF4α and PGC-1α, we performed deletion and site-directed mutagenesis studies. As shown in Fig. 5A, the first two deletion constructs contained the potential HNF4-RE, whereas the third deletion construct did not. The fourth construct contained the full 4.6-kb CAR promoter with the potential HNF4-RE mutated as described under “Materials ands Methods.” As expected, deletion one and deletion two retained HNF4α/PGC-1α responsiveness, but deletion three did not (Fig. 5B). Importantly, site-directed mutation of the potential HNF4-RE totally abolished the response to both HNF4α and PGC-1α. These data demonstrate that the identified HNF4-RE is required for transactivation of reporter gene expression through the action of HNF4α together with PGC-1α. Interestingly, deletion from −4202 to −478 increased the basal activity of the reporter gene, whereas deletion from −478 to −69 decreased basal activity, suggesting the existence of a transcriptional repressor and activator function through the region from −4202 to −478 and the region from −478 to −69 in the mouse CAR promoter, respectively.
FIGURE 5. The HNF4-RE is required for the regulation of the CAR promoter by PGC-1α and HNF4α.
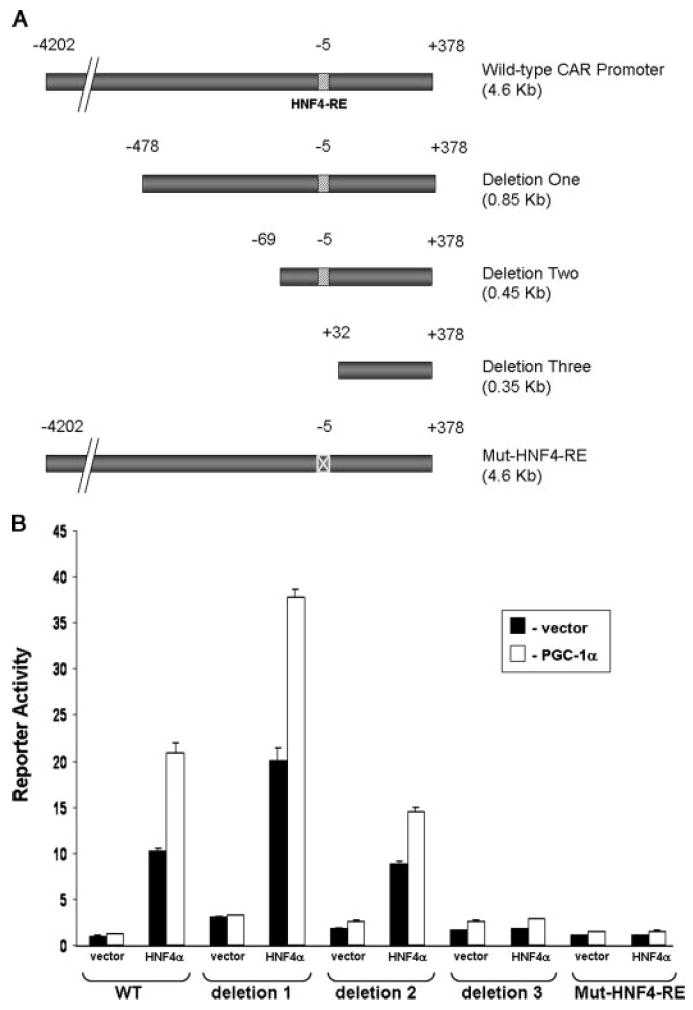
A, diagram showing the fragments in the luciferase reporter genes. B, CV-1 cells were transfected with the various reporter gene constructs (20 ng) and the expression vector (5 ng) encoding HNF4α in the presence of the empty vector (pcDNA) or pcDNA-PGC-1α (10 ng). The data represent average ± S.E. (n = 4) and are normalized against β-galactosidase activity.
To determine whether HNF4α can directly bind to the identified HNF4-RE in the CAR promoter, we performed electrophoretic mobility shift assays. HNF4α protein binds efficiently to double-stranded radiolabeled oligonucleotides encompassing the identified HNF4-RE (Fig. 6A). Additional reaction mixtures utilizing increasing non-radiolabeled competitor oligonucleotide probes, encompassing either the identified HNF4-RE or the prototypical HNF4-RE contained in the rat CYP7A promoter, produced a marked reduction in HNF4α binding, whereas a mutated CAR promoter HNF4-RE did not. Consistent with these data, experiments in the opposite configuration revealed that the identified HNF4-RE effectively competes HNF4α binding to the CYP7A radiolabeled probe, whereas the mutated HNF4-RE did not (Fig. 6B). These data indicate that HNF4α binds specifically to the identified HNF4-RE.
FIGURE 6. HNF4α directly binds to the HNF4-RE on the CAR promoter.
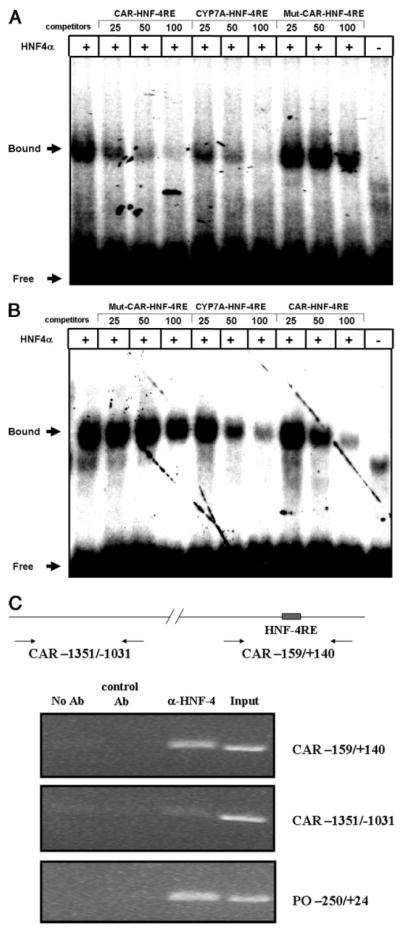
A, experiments were performed using a radiolabeled oligonucleotide probe corresponding to the potential HNF4-RE (CAR-HNF4-RE) from the mouse CAR promoter and in vitro translated human HNF4α protein. Competition was performed with cold CAR-HNF4-RE, mutant CAR-HNF4-RE (mut CAR-HNF4-RE) or oligonucleotides corresponding to the HNF4-RE (CYP7A-HNF4-RE) from the rat CYP7A promoter.B, experiments were performed using the radiolabeled CYP7A-HNF4-RE and in vitro translated human HNF4α protein. Competition was performed as in A. C, ChIP assays were performed as described under “Materials and Methods” with anti-HNF4α antibody (α-HNF4) or without antibody as a negative control (−Ab).A control antibody was included as a control for immunoprecipitation purposes. DNA samples were amplified using a pair of oligonucleotide primers covering the HNF4α binding site in the CAR promoter (CAR −159/+140). A pair of oligonucleotide primers covering the distal region of the CAR gene (CAR − 1351/−1031) was used as a negative control. A region in the mouse proline oxidase (PO −250/+ 24) was amplified and used as a positive control. Non-precipitated genomic DNA (input) was also amplified.
To determine the extent to which HNF4α binds to the identified HNF4-RE in the CAR promoter in vivo, ChIP assays were performed using extracts isolated from mouse liver. The identified HNF4-RE was efficiently amplified using specific oligonucleotides primers when the anti-HNF4α monoclonal antibody was used in the immunoprecipitation, whereas results produced using a nonspecific monoclonal antibody in identical reaction mixtures were negative (Fig. 6C). As an additional experimental control, a pair of oligonucleotide primers spanning a region outside the identified HNF4-RE did not produce positive results, further verifying the specificity of the ChIP assays presented here. A control reaction that utilized the previously identified HNF4-RE in the proline oxidase gene further confirms the specificity of our ChIP analysis. Taken together, these data indicate that HNF4α directly binds to the identified HNF4-RE in the promoter of the car gene in vivo and likely plays a pivotal role in regulating CAR gene expression.
Regulation of CAR and CAR Target Genes by PGC-1α
Although PGC-1α has been shown to coactivate an artificial fusion protein composed of the GAL4 DNA-binding domain fused to the CAR ligand-binding domain, it is not known whether PGC-1α can regulate ligand-independent CAR activity in the context of a native promoter. To investigate this question, we transfected CV-1 cells with the Cyp2b10-LUC reporter gene containing the CAR-responsive phenobarbital-responsive element derived from the mouse Cyp2b10 promoter (26) together with expression vectors encoding mouse CAR in the presence and absence of PGC-1α. As shown in Fig. 7A, coexpression of PGC-1α markedly increased Cyp2b10-LUC reporter gene activity in a CAR-dependent manner. These data indicate that increases in PGC-1α expression produce increased ligand-independent CAR activity on the native Cyp2b10 promoter in transfected cells in culture. To investigate whether expression of PGC-1α is sufficient to induce the expression of CAR and CAR target genes in liver cells, we infected primary cultures of rat hepatocytes with increasing amounts of an adenoviral expression vector encoding PGC-1α. As shown in Fig. 7B, infection with a blank virus encoding green fluorescent protein (multiplicity of infection = 10) did not induce the expression of CAR or any CAR target genes examined. Conversely, expression of increasing amounts of PGC-1α in hepatocytes produced increased expression of CAR and all CAR target genes examined, including Cyp2B1, Sult2A1, and Ugt1A1. A known PGC-1α target gene, PEPCK, was used as a positive control. Taken together, these data indicate that increased PGC-1α is sufficient to induce expression of the car gene as well as the expression of the selected CAR target genes.
FIGURE 7. PGC-1α coactivates CAR on the Cyp2b10 promoter.
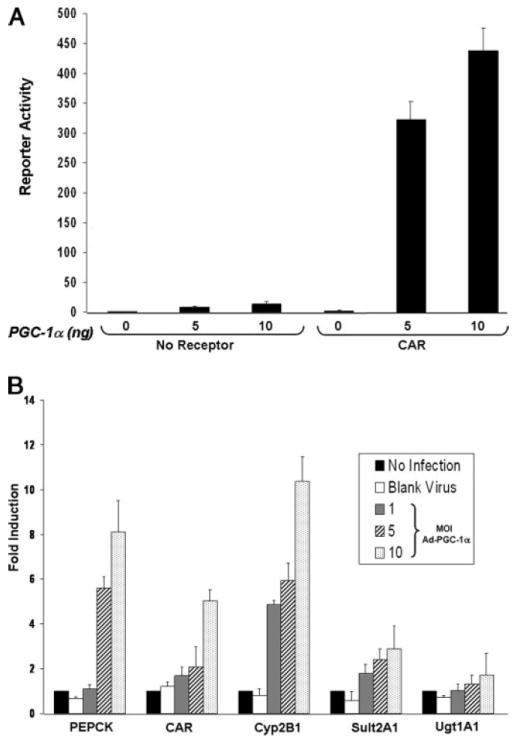
A, CV-1 cells were transfected with the Cyp2b10-LUC reporter gene and the indicated amounts of the expression vector for PGC-1α (0, 5, and 10 ng) with or without cotransfection of mouse CAR. The data represent average ± S.E. (n = 4) and are normalized against β-galactosidase activity. B, primary cultures of rat hepatocytes were transduced with the indicated adenoviral expression vectors. Total RNA was isolated after 72 h, and real-time quantitative PCR analyses were performed for the indicated genes. Data represent average ± S.E. (n = 3). All data are normalized to 18 S rRNA levels.
Regulation of CAR and CAR Target Genes by Fasting in Liver-specific HNF4α-KO Mice
Because our biochemical studies strongly suggest a central role for HNF4α in the regulation of CAR gene expression, we sought to determine the extent to which HNF4α is required to produce increased CAR and CAR target gene expression in response to fasting by utilizing liver-specific HNF4α-KO mice. As shown in Fig. 8A, the basal expression level of CAR was severely diminished in HNF4α-KO mice. Additionally, fasting of HNF4α-KO mice did not restore the CAR expression level to those observed in fasted or fed wild-type mouse liver. Although fasting failed to bring CAR expression to a normal level, it still caused a slight induction of CAR expression in HNF4α-KO mice. These data indicate that fasting may also regulate CAR gene expression through certain HNF4α-independent mechanisms. The modest induction of hepatic CAR gene expression observed in HNF4α-KO mice is not sufficient to cause a biological effect, because none of the CAR target genes investigated, including Cyp2b10, Sult2a1, Ugt1a1, and Oatp2, were induced by fasting in the HNF4α-KO mouse liver (Fig. 8, B–E). Consistent with a previous report (39), the induction of PEPCK by fasting was also totally abolished in the KO mouse liver (Fig. 8G). Interestingly, the basal levels of all CAR target genes investigated were increased in the HNF4α-KO mouse liver. This may in part be due to activation of other nuclear receptors such as PXR or farnesoid X receptor by bile acids, because the serum concentrations of bile acids are much higher in liver-specific HNF4α-KO mice (42) and certain bile acids are known to activate PXR (23, 43, 45, 46) and farnesoid X receptor (47-49).
FIGURE 8. Induction of CAR and CAR target genes in liver-specific HNF4α-KO mouse liver by fasting.
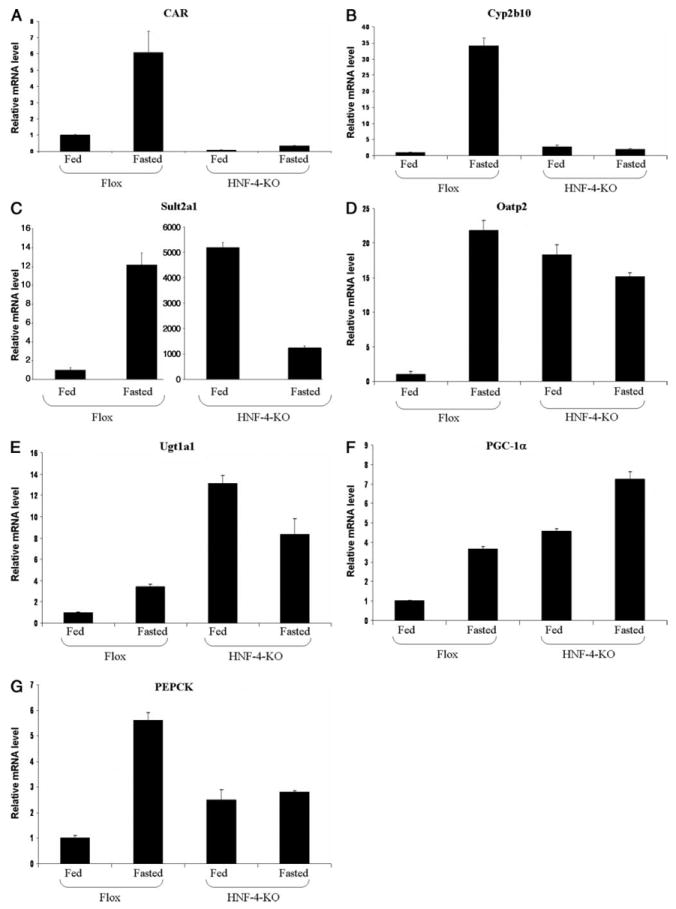
Total RNA was isolated from the livers of wild-type (Flox) mice or liver-specific HNF4α-KO (HNF4-KO) mice with or without 24-h fast. RNA was pooled from four to five mouse livers. Real-time quantitative PCR analyses were performed for the expression of CAR (A), Cyp2b10 (B), Sult2a1 (C), Oatp2 (D), Ugt1a1 (E), PGC-1α (F), and PEPCK (G). Please note the scale difference in the y-axes in C. Data represent average ± S.E. (n = 3). All data are normalized to 18 S rRNA levels.
DISCUSSION
CAR was originally characterized as a “xenobiotic sensor” that, together with its closest relative PXR, provides a functionally redundant “metabolic safety net” that is activated in response to xenobiotic stress. Recent biochemical and structural data suggest that, as opposed to merely sensing xenobiotic stress, CAR is activated in response to metabolic or nutritional stress in a ligand-independent manner. Our data reveal a novel molecular mechanism of ligand-independent CAR activation that involves a tightly controlled network of interactions between cAMP, PGC-1α, HNF4α, and CAR. This mode of activation positions CAR as the key regulator of both drug and hormone disposition in liver during β-adrenergic/glucagon-mediated stimulation of liver such as occurs during fasting and caloric restriction. The data presented in this study further distinguish CAR from PXR and suggest that CAR functions as a sensor of energy stores and is activated by increased intracellular cAMP and increases expression of genes involved in transport and metabolism of thyroid and steroid hormones.
A model illustrating this mechanism is shown in Fig. 9. In response to fasting or caloric restriction, the level of cAMP rises due to increased action of epinephrine and glucagon in liver. Increased intracellular concentrations of cAMP then activate the cAMP-dependent protein kinase (PKA), which then phosphorylates and activates the cAMP-response element binding protein (CREB). Activated CREB then turns on the expression of PGC-1α, which induces the expression of CAR through coactivation of HNF4α. Subsequently, the interaction between CAR and PGC-1α increases the expression of selected CAR target genes involved in transport and metabolism in liver.
FIGURE 9. Model for the induction of CAR and CAR target genes by cAMP in mouse liver during caloric restriction or fasting.
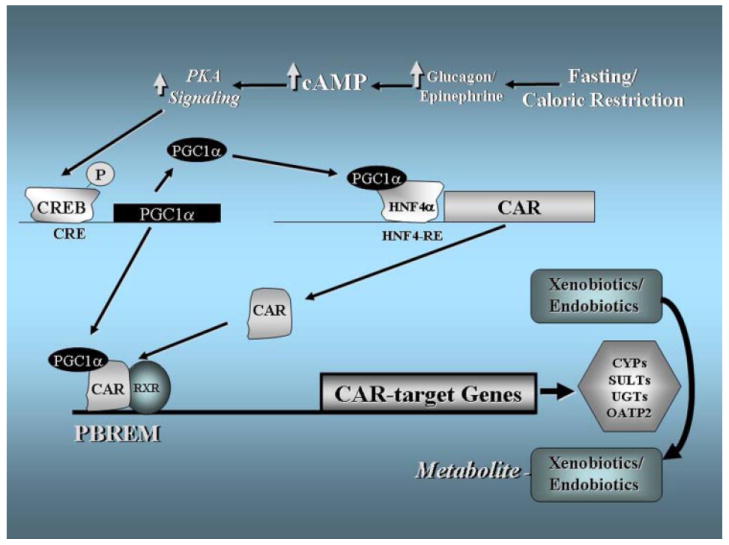
cAMP rises during caloric restriction or fasting, which activates PKA. Activated PKA induces the gene expression of PGC-1α through CREB. PGC-1α induces the gene expression of CAR through coactivation of HNF4α. Induced CAR and PGC-1α come together and turn on the expression of CAR target genes, including Sult2a1 and Ugt1a1, involved in xenobiotic and endobiotic metabolism such as TH metabolism. It cannot be ruled out that certain CAR- and PGC-1α-independent mechanisms may also contribute to the induction of those genes by cAMP. Please see text for details.
It is worth noting here that one hallmark of PGC-1α-mediated activation of nuclear receptors is that it does so in a ligand-independent manner. It is also worth noting that, with the exception of TCPOBOP (1,4-bis[2-(3,5-dichloropyridyloxy)]) benzene and CITCO (6-(4-chlorophenyl)imidazo[2,1-b](1, 3)-thiazole-5-carbaldehyde O-(3,4-dichlorobenzyl)oxime), the vast majority of CAR activators identified to date activate CAR in an indirect- and phosphorylation-dependent manner. Although the extent to which the mode of CAR activation described here has an impact upon the metabolic disposition of thyroid hormones and other steroidal endobiotic compounds involved in regulating weight, it is clear that ablation of CAR function in vivo in mice produces a profound decrease in the resistance to weight loss observed during extended periods of caloric restriction (9). Future experiments utilizing in vivo gain-of-function and knockdown approaches that target this newly identified novel signaling pathway in rodent models will directly address this question.
The data we present here cannot rule out the possibility that other PGC-1α-independent mechanisms are also involved in the activation of CAR during fasting. For example, a recent study shows that the coactivator PPAR-binding protein is critical for the induction of CAR target genes by xenobiotics (51), and our data do not rule out a role for PPAR-binding protein in the activation of CAR during fasting. It is possible that the xenobiotic response of CAR is differentiated from its metabolic response and is produced through interaction with distinct cofactors, such as PGC-1α, during fasting. The respective CAR-cofactor complexes might then function to regulate the expression of different groups of genes in response to metabolic versus xenobiotic stress. In addition, previous work indicates that protein kinase signaling pathways regulate the activity of PXR, a close relative of CAR, by modulating the interactions between PXR and cofactor proteins (52). Moreover, a study shows that phosphorylation/dephosphorylation of serine 202 regulates the subcellular location of CAR (53). Therefore, fasting may modulate CAR-cofactor interactions through alterations in the phosphorylation status of cofactor proteins, CAR, or both. Fasting may also induce the expression of HNF4α in liver (38, 54), and this might further contribute to induction of CAR expression and activity in response to metabolic stress. It is noteworthy that our kinetic analysis shows that treatment with 8-Br-cAMP produced relatively early increases in the expression of the Oatp2 and Sult2a1 genes when compared with CAR, Cyp2b10, and Ugt1a1. This indicates that cAMP signaling may play a role in regulating the expression of these genes that is independent of CAR, and this represents an interesting topic for future investigations. Finally, further dissection of the mouse 4.6-kb CAR promoter fragment identified here should yield additional information regarding the molecular mechanisms that regulate the expression of the car gene in mice.
It should be pointed out that our current studies have been focused on mRNA levels. Although work from other groups has revealed that the mRNA levels of UGTs and SULTs are correlated well with TH metabolism (9, 50), it still remains to be determined in the future whether the changes in gene expression observed in our studies are associated with corresponding changes in protein levels and enzymatic activities for UGTs and SULTs.
Although activation of TH receptor by T3 increases metabolic rate, the lack of tissue-selectivity of THs and the associated cardiac side-effects has prevented the use of these hormones as anti-obesity agents (55, 56). A number of recent studies indicate that selective activation of TH receptor in liver can raise the metabolic rate with only minimal cardiac side-effects (57-60). Therefore, drugs that selectively decrease hepatic TH metabolism could in principle have important anti-obesity properties that have diminished cardiac-related side-effects. Our findings suggest that the potential exists to target a number of hepatic factors to decrease the metabolism of THs in liver, thereby generating a gradient of TH concentrations with the local TH concentrations in liver being relatively higher. First, selective antagonism of hepatic β-adrenergic receptors would be expected to prevent the rise of cAMP in liver during fasting or caloric restriction. Second, liver-specific PKA or CREB inhibitors should prevent the induction of PGC-1α and CAR in liver during fasting or caloric restriction. Third, an HNF4α inverse agonist might prevent the induction of CAR gene expression during fasting or caloric restriction. Finally, small molecules that disrupt the interaction between PGC-1α and CAR could in principle repress the induction of CAR target genes involved in the uptake, metabolism, and excretion of THs or other important endobiotics during fasting and caloric restriction. It should be pointed out that targeting any of these factors for therapeutic purposes requires achieving tissue specificity to reduce any potential side-effects, and this remains challenging work for the future.
Since its identification in 1998, PGC-1α has gained attention as a promising drug target for diabetes and obesity due to its key role in both glucose and energy homeostasis (61-64). However, our findings suggest that selective targeting PGC-1α function in liver may have profound effects on the activity of CAR, including alterations in the drug and endobiotic-metabolizing pathways regulated by this nuclear receptor. Although drugs that selectively target the activity of hepatic PGC-1α may favorably modulate glucose and energy homeostasis, they may also disturb xenobiotic and endobiotic homeostasis and hence cause unwanted and potentially lethal side-effects. A recent report indicates that xenobiotic-inducible Cyp2b10 expression is intact in mice lacking PGC-1α in liver (65). It will therefore be important to determine the extent to which the CAR-mediated metabolic response we describe is altered in this animal model. We also note that the basal expression level of Cyp2b10 in the liver of CAR-KO mice is drastically reduced when compared with their wild-type littermates, indicating that CAR plays a key role in maintaining the target gene basal expression levels (9). However, it should be pointed out that the increase in CAR expression and activity during fasting and 8-Br-cAMP treatment represent acute effects, whereas the gene-knock-out studies reflect a chronic effect.
Our experiments with liver-specific HNF4α-KO mice clearly show fasting-inducible CAR activity is abolished and therefore support a central role for HNF4α in the fasting response. Future in vivo genetic animal studies will determine the extent to which acute stimulation of this pathway in liver, such as occurs during fasting, produces alteration in the circulating levels of serum THs and other steroids, including cortisol. Our future studies will also be designed to investigate the extent to which chronic overexpression of PGC-1α in liver such as occurs during caloric restriction produces increased sensitivity to diet-induced obesity or increased resistance to weight loss.
THs and steroid hormones are transported into hepatocytes, which can be mediated by the sinusoidal transporter Oatp2 (66). Subsequent biotransformation reactions are catalyzed by UGTs and SULTs. Conjugated and unconjugated molecules are then excreted into bile via transporters localized on the canalicular membranes such as multidrug resistance-associated proteins (44, 67). It will therefore be of interest to determine the extent to which canalicular transport of THs and other hormones is regulated by fasting and cAMP. Finally, although Cyp2b10 is often used as a marker for CAR activity, the physiological significance of the induction of this cytochrome P-450 enzyme during fasting remains totally unknown.
Acknowledgments
We thank Dan Brobst for his technical assistance throughout this project and thank the Staudinger laboratory members for helpful discussions. We thank Dr. Bryan Goodwin for the pcDNA-PGC-1α plasmid and helpful discussion. We thank Dr. Byron Kemper and Dr. Daniel P. Kelly for the Cyp2b10-LUC reporter gene and the Ad-PGC-1α expression vector, respectively.
Footnotes
This work was supported by National Institutes of Health Grants RR17708 and R01DK068443.
The abbreviations used are: TH, thyroid hormone; T3, triidothyronine; T4, thyroxine; SULT, sulfotransferase; UGT, UDP-glucuronosyltransferase; CAR, constitutive androstane receptor; HNF4α, hepatocyte nuclear factor 4α; PPARγ, peroxisome proliferator-activated receptor γ; PGC-1α, PPARγ coactivator-1α; PEPCK, phosphoenolpyruvate carboxykinase; HNF4-RE,HNF4-response element; HNF4α-KO, HNF4α-knock-out; PXR, pregnane x receptor; ONPG, o-nitrophenyl β-d-galactopyranoside; ChIP, chromatin immunoprecipitation; 8-Br-cAMP, 8-bromo-cAMP; PKA, protein kinase A; GR, glucocorticoid receptor; CREB, cAMP-response element-binding protein.
References
- 1.Lowell BB, Spiegelman BM. Nature. 2000;404:652–660. doi: 10.1038/35007527. [DOI] [PubMed] [Google Scholar]
- 2.Spiegelman BM, Flier JS. Cell. 2001;104:531–543. doi: 10.1016/s0092-8674(01)00240-9. [DOI] [PubMed] [Google Scholar]
- 3.Flier JS. Cell. 2004;116:337–350. doi: 10.1016/s0092-8674(03)01081-x. [DOI] [PubMed] [Google Scholar]
- 4.Blaxter K. Energy Metabolism in Animals and Man. Cambridge University Press; Cambridge: 1989. [Google Scholar]
- 5.Harvey CB, Williams GR. Thyroid. 2002;12:441–446. doi: 10.1089/105072502760143791. [DOI] [PubMed] [Google Scholar]
- 6.Bianco AC, Salvatore D, Gereben B, Berry MJ, Larsen PR. Endocr Rev. 2002;23:38–89. doi: 10.1210/edrv.23.1.0455. [DOI] [PubMed] [Google Scholar]
- 7.Mol JA, Visser TJ. Endocrinology. 1985;117:8–12. doi: 10.1210/endo-117-1-8. [DOI] [PubMed] [Google Scholar]
- 8.Burchell B, Coughtrie MW. Pharmacol Ther. 1989;43:261–289. doi: 10.1016/0163-7258(89)90122-8. [DOI] [PubMed] [Google Scholar]
- 9.Maglich JM, Watson J, McMillen PJ, Goodwin B, Willson TM, Moore JT. J Biol Chem. 2004;279:19832–19838. doi: 10.1074/jbc.M313601200. [DOI] [PubMed] [Google Scholar]
- 10.Rabast U, Hahn A, Reiners C, Ehl M. Int J Obes. 1981;5:305–311. [PubMed] [Google Scholar]
- 11.Rosenbaum M, Hirsch J, Murphy E, Leibel RL. Am J Clin Nutr. 2000;71:1421–1432. doi: 10.1093/ajcn/71.6.1421. [DOI] [PubMed] [Google Scholar]
- 12.Xie W, Barwick JL, Simon CM, Pierce AM, Safe S, Blumberg B, Guzelian PS, Evans RM. Genes Dev. 2000;14:3014–3023. doi: 10.1101/gad.846800. [DOI] [PMC free article] [PubMed] [Google Scholar]
- 13.Honkakoski P, Sueyoshi T, Negishi M. Ann Med. 2003;35:172–182. doi: 10.1080/07853890310008224. [DOI] [PubMed] [Google Scholar]
- 14.Staudinger JL, Madan A, Carol KM, Parkinson A. Drug Metab Dispos. 2003;31:523–527. doi: 10.1124/dmd.31.5.523. [DOI] [PubMed] [Google Scholar]
- 15.Wei P, Zhang J, Egan-Hafley M, Liang S, Moore DD. Nature. 2000;407:920–923. doi: 10.1038/35038112. [DOI] [PubMed] [Google Scholar]
- 16.Wei P, Zhang J, Dowhan DH, Han Y, Moore DD. Pharmacogenomics J. 2002;2:117–126. doi: 10.1038/sj.tpj.6500087. [DOI] [PubMed] [Google Scholar]
- 17.Sugatani J, Nishitani S, Yamakawa K, Yoshinari K, Sueyoshi T, Negishi M, Miwa M. Mol Pharmacol. 2005;67:845–855. doi: 10.1124/mol.104.007161. [DOI] [PubMed] [Google Scholar]
- 18.Maglich JM, Stoltz CM, Goodwin B, Hawkins-Brown D, Moore JT, Kliewer SA. Mol Pharmacol. 2002;62:638–646. doi: 10.1124/mol.62.3.638. [DOI] [PubMed] [Google Scholar]
- 19.Xiong H, Yoshinari K, Brouwer KL, Negishi M. Drug Metab Dispos. 2002;30:918–923. doi: 10.1124/dmd.30.8.918. [DOI] [PubMed] [Google Scholar]
- 20.Huang W, Zhang J, Chua SS, Qatanani M, Han Y, Granata R, Moore DD. Proc Natl Acad Sci U S A. 2003;100:4156–4161. doi: 10.1073/pnas.0630614100. [DOI] [PMC free article] [PubMed] [Google Scholar]
- 21.Saini SP, Sonoda J, Xu L, Toma D, Uppal H, Mu Y, Ren S, Moore DD, Evans RM, Xie W. Mol Pharmacol. 2004;65:292–300. doi: 10.1124/mol.65.2.292. [DOI] [PubMed] [Google Scholar]
- 22.Assem M, Schuetz EG, Leggas M, Sun D, Yasuda K, Reid G, Zelcer N, Adachi M, Strom S, Evans RM, Moore DD, Borst P, Schuetz JD. J Biol Chem. 2004;279:22250–22257. doi: 10.1074/jbc.M314111200. [DOI] [PubMed] [Google Scholar]
- 23.Staudinger JL, Goodwin B, Jones SA, Hawkins-Brown D, MacKenzie KI, LaTour A, Liu Y, Klaassen CD, Brown KK, Reinhard J, Willson TM, Koller BH, Kliewer SA. Proc Natl Acad Sci U S A. 2001;98:3369–3374. doi: 10.1073/pnas.051551698. [DOI] [PMC free article] [PubMed] [Google Scholar]
- 24.Hayhurst GP, Lee YH, Lambert G, Ward JM, Gonzalez FJ. Mol Cell Biol. 2001;21:1393–1403. doi: 10.1128/MCB.21.4.1393-1403.2001. [DOI] [PMC free article] [PubMed] [Google Scholar]
- 25.Moore LB, Parks DJ, Jones SA, Bledsoe RK, Consler TG, Stimmel JB, Goodwin B, Liddle C, Blanchard SG, Willson TM, Collins JL, Kliewer SA. J Biol Chem. 2000;275:15122–15127. doi: 10.1074/jbc.M001215200. [DOI] [PubMed] [Google Scholar]
- 26.Rivera-Rivera I, Kim J, Kemper B. Biochim Biophys Acta. 2003;1619:254–262. doi: 10.1016/s0304-4165(02)00484-1. [DOI] [PubMed] [Google Scholar]
- 27.Brobst DE, Ding X, Creech KL, Goodwin B, Kelley B, Staudinger JL. J Pharmacol Exp Ther. 2004;310:528–535. doi: 10.1124/jpet.103.064329. [DOI] [PubMed] [Google Scholar]
- 28.Wisely GB, Miller AB, Davis RG, Thornquest AD, Jr, Johnson R, Spitzer T, Sefler A, Shearer B, Moore JT, Willson TM, Williams SP. Structure. 2002;10:1225–1234. doi: 10.1016/s0969-2126(02)00829-8. [DOI] [PubMed] [Google Scholar]
- 29.Greene ME, Blumberg B, McBride OW, Yi HF, Kronquist K, Kwan K, Hsieh L, Greene G, Nimer SD. Gene Expr. 1995;4:281–299. [PMC free article] [PubMed] [Google Scholar]
- 30.Lehmann JM, Kliewer SA, Moore LB, Smith-Oliver TA, Oliver BB, Su JL, Sundseth SS, Winegar DA, Blanchard DE, Spencer TA, Willson TM. J Biol Chem. 1997;272:3137–3140. doi: 10.1074/jbc.272.6.3137. [DOI] [PubMed] [Google Scholar]
- 31.Ding X, Staudinger JL. J Pharmacol Exp Ther. 2005;314:120–127. doi: 10.1124/jpet.105.085225. [DOI] [PubMed] [Google Scholar]
- 32.Schmittgen TD, Zakrajsek BA, Mills AG, Gorn V, Singer MJ, Reed MW. Anal Biochem. 2000;285:194–204. doi: 10.1006/abio.2000.4753. [DOI] [PubMed] [Google Scholar]
- 33.Ding X, Staudinger JL. J Pharmacol Exp Ther. 2005;312:849–856. doi: 10.1124/jpet.104.076331. [DOI] [PubMed] [Google Scholar]
- 34.Stroup D, Chiang JY. J Lipid Res. 2000;41:1–11. [PubMed] [Google Scholar]
- 35.Kamiya A, Inoue Y, Kodama T, Gonzalez FJ. FEBS Lett. 2004;578:63–68. doi: 10.1016/j.febslet.2004.10.070. [DOI] [PubMed] [Google Scholar]
- 36.Shiraki T, Sakai N, Kanaya E, Jingami H. J Biol Chem. 2003;278:11344–11350. doi: 10.1074/jbc.M212859200. [DOI] [PubMed] [Google Scholar]
- 37.Herzig S, Long F, Jhala US, Hedrick S, Quinn R, Bauer A, Rudolph D, Schutz G, Yoon C, Puigserver P, Spiegelman B, Montminy M. Nature. 2001;413:179–183. doi: 10.1038/35093131. [DOI] [PubMed] [Google Scholar]
- 38.Yoon JC, Puigserver P, Chen G, Donovan J, Wu Z, Rhee J, Adelmant G, Stafford J, Kahn CR, Granner DK, Newgard CB, Spiegelman BM. Nature. 2001;413:131–138. doi: 10.1038/35093050. [DOI] [PubMed] [Google Scholar]
- 39.Rhee J, Inoue Y, Yoon JC, Puigserver P, Fan M, Gonzalez FJ, Spiegelman BM. Proc Natl Acad Sci U S A. 2003;100:4012–4017. doi: 10.1073/pnas.0730870100. [DOI] [PMC free article] [PubMed] [Google Scholar]
- 40.Puigserver P, Rhee J, Donovan J, Walkey CJ, Yoon JC, Oriente F, Kitamura Y, Altomonte J, Dong H, Accili D, Spiegelman BM. Nature. 2003;423:550–555. doi: 10.1038/nature01667. [DOI] [PubMed] [Google Scholar]
- 41.Pascussi JM, Busson-Le Coniat M, Maurel P, Vilarem MJ. Mol Endocrinol. 2003;17:42–55. doi: 10.1210/me.2002-0244. [DOI] [PubMed] [Google Scholar]
- 42.Inoue Y, Yu AM, Yim SH, Ma X, Krausz KW, Inoue J, Xiang CC, Brownstein MJ, Eggertsen G, Bjorkhem I, Gonzalez FJ. J Lipid Res. 2006;47:215–227. doi: 10.1194/jlr.M500430-JLR200. [DOI] [PMC free article] [PubMed] [Google Scholar]
- 43.Staudinger J, Liu Y, Madan A, Habeebu S, Klaassen CD. Drug Metab Dispos. 2001;29:1467–1472. [PubMed] [Google Scholar]
- 44.Wong H, Lehman-McKeeman LD, Grubb MF, Grossman SJ, Bhaskaran VM, Solon EG, Shen HS, Gerson RJ, Car BD, Zhao B, Gemzik B. Toxicol Sci. 2005;84:232–242. doi: 10.1093/toxsci/kfi094. [DOI] [PubMed] [Google Scholar]
- 45.Xie W, Radominska-Pandya A, Shi Y, Simon CM, Nelson MC, Ong ES, Waxman DJ, Evans RM. Proc Natl Acad Sci U S A. 2001;98:3375–3380. doi: 10.1073/pnas.051014398. [DOI] [PMC free article] [PubMed] [Google Scholar]
- 46.Goodwin B, Gauthier KC, Umetani M, Watson MA, Lochansky MI, Collins JL, Leitersdorf E, Mangelsdorf DJ, Kliewer SA, Repa JJ. Proc Natl Acad Sci U S A. 2003;100:223–228. doi: 10.1073/pnas.0237082100. [DOI] [PMC free article] [PubMed] [Google Scholar]
- 47.Makishima M, Okamoto AY, Repa JJ, Tu H, Learned RM, Luk A, Hull MV, Lustig KD, Mangelsdorf DJ, Shan B. Science. 1999;284:1362–1365. doi: 10.1126/science.284.5418.1362. [DOI] [PubMed] [Google Scholar]
- 48.Parks DJ, Blanchard SG, Bledsoe RK, Chandra G, Consler TG, Kliewer SA, Stimmel JB, Willson TM, Zavacki AM, Moore DD, Lehmann JM. Science. 1999;284:1365–1368. doi: 10.1126/science.284.5418.1365. [DOI] [PubMed] [Google Scholar]
- 49.Wang H, Chen J, Hollister K, Sowers LC, Forman BM. Mol Cell. 1999;3:543–553. doi: 10.1016/s1097-2765(00)80348-2. [DOI] [PubMed] [Google Scholar]
- 50.Qatanani M, Zhang J, Moore DD. Endocrinology. 2005;146:995–1002. doi: 10.1210/en.2004-1350. [DOI] [PubMed] [Google Scholar]
- 51.Jia Y, Guo GL, Surapureddi S, Sarkar J, Qi C, Guo D, Xia J, Kashireddi P, Yu S, Cho YW, Rao MS, Kemper B, Ge K, Gonzalez FJ, Reddy JK. Proc Natl Acad Sci U S A. 2005;102:12531–12536. doi: 10.1073/pnas.0506000102. [DOI] [PMC free article] [PubMed] [Google Scholar]
- 52.Ding X, Staudinger JL. Biochem Pharmacol. 2005;69:867–873. doi: 10.1016/j.bcp.2004.11.025. [DOI] [PubMed] [Google Scholar]
- 53.Hosseinpour F, Moore R, Negishi M, Sueyoshi T. Mol Pharmacol. 2006;69:1095–1102. doi: 10.1124/mol.105.019505. [DOI] [PubMed] [Google Scholar]
- 54.Lin J, Wu PH, Tarr PT, Lindenberg KS, St-Pierre J, Zhang CY, Mootha VK, Jager S, Vianna CR, Reznick RM, Cui L, Manieri M, Donovan MX, Wu Z, Cooper MP, Fan MC, Rohas LM, Zavacki AM, Cinti S, Shulman GI, Lowell BB, Krainc D, Spiegelman BM. Cell. 2004;119:121–135. doi: 10.1016/j.cell.2004.09.013. [DOI] [PubMed] [Google Scholar]
- 55.Kahaly GJ, Dillmann WH. Endocr Rev. 2005;26:704–728. doi: 10.1210/er.2003-0033. [DOI] [PubMed] [Google Scholar]
- 56.Krotkiewski M. Int J Obes Relat Metab Disord. 2000;24(Suppl. 2):S116–S119. doi: 10.1038/sj.ijo.0801294. [DOI] [PubMed] [Google Scholar]
- 57.Baxter JD, Webb P, Grover G, Scanlan TS. Trends Endocrinol Metab. 2004;15:154–157. doi: 10.1016/j.tem.2004.03.008. [DOI] [PubMed] [Google Scholar]
- 58.Grover GJ, Egan DM, Sleph PG, Beehler BC, Chiellini G, Nguyen NH, Baxter JD, Scanlan TS. Endocrinology. 2004;145:1656–1661. doi: 10.1210/en.2003-0973. [DOI] [PubMed] [Google Scholar]
- 59.Grover GJ, Mellstrom K, Ye L, Malm J, Li YL, Bladh LG, Sleph PG, Smith MA, George R, Vennstrom B, Mookhtiar K, Horvath R, Speelman J, Egan D, Baxter JD. Proc Natl Acad Sci U S A. 2003;100:10067–10072. doi: 10.1073/pnas.1633737100. [DOI] [PMC free article] [PubMed] [Google Scholar]
- 60.Trost SU, Swanson E, Gloss B, Wang-Iverson DB, Zhang H, Volodarsky T, Grover GJ, Baxter JD, Chiellini G, Scanlan TS, Dillmann WH. Endocrinology. 2000;141:3057–3064. doi: 10.1210/endo.141.9.7681. [DOI] [PubMed] [Google Scholar]
- 61.Puigserver P. Int J Obes (Lond) 2005;29:S5–S9. doi: 10.1038/sj.ijo.0802905. [DOI] [PubMed] [Google Scholar]
- 62.Puigserver P, Wu Z, Park CW, Graves R, Wright M, Spiegelman BM. Cell. 1998;92:829–839. doi: 10.1016/s0092-8674(00)81410-5. [DOI] [PubMed] [Google Scholar]
- 63.Puigserver P, Spiegelman BM. Endocr Rev. 2003;24:78–90. doi: 10.1210/er.2002-0012. [DOI] [PubMed] [Google Scholar]
- 64.Lin J, Handschin C, Spiegelman BM. Cell Metab. 2005;1:361–370. doi: 10.1016/j.cmet.2005.05.004. [DOI] [PubMed] [Google Scholar]
- 65.Handschin C, Lin J, Rhee J, Peyer AK, Chin S, Wu PH, Meyer UA, Spiegelman BM. Cell. 2005;122:505–515. doi: 10.1016/j.cell.2005.06.040. [DOI] [PubMed] [Google Scholar]
- 66.Abe T, Kakyo M, Sakagami H, Tokui T, Nishio T, Tanemoto M, Nomura H, Hebert SC, Matsuno S, Kondo H, Yawo H. J Biol Chem. 1998;273:22395–22401. doi: 10.1074/jbc.273.35.22395. [DOI] [PubMed] [Google Scholar]
- 67.Mitchell AM, Tom M, Mortimer RH. J Endocrinol. 2005;185:93–98. doi: 10.1677/joe.1.06096. [DOI] [PubMed] [Google Scholar]