Abstract
Side-population (SP) analysis has been used to identify progenitor cells from normal and malignant tissues as well as revealing tumor cells with increased resistance to radiation and chemotherapy. Despite enhanced chemoresistance, tumor SP cells may still express tumor associated antigens (TAA) which may render them susceptible to elimination by the immune system. In this study, we show that both Hodgkin’s lymphoma (HL) cell lines and primary HL tumor samples contain a distinct SP phenotype. Importantly, while these cells showed increased resistance to gemcitabine, a commonly used drug for the treatment of refractory HL, HL SP cells also expressed higher levels of the TAAs MAGEA4, SSX2, Survivin and NY-ESO-1 which allowed them to be specifically recognized and killed by TAA-specific cytotoxic T lymphocytes. This study suggests that chemoresistant HL SP cells can be targeted by the immune system, providing a rationale for combined chemotherapy and immunotherapy for the treatment of HL.
Keywords: Hodgkin’s lymphoma, side-population, drug resistance, cytotoxic T lymphocyte, tumor associated antigen
INTRODUCTION
Hodgkin’s lymphoma (HL) is a common hematological malignancy, for which standard chemotherapy regimens produce long-term, disease-free survival in more than 85% of patients [1]. The remainder of these patients, however, will die of relapse [2], likely caused by a small number of cells resistant to chemotherapy or radiation treatment that are not eliminated by the endogenous immune system. SP analysis has been used to identify cells with stem/progenitor cell-like characteristics from normal [3, 4] and malignant tissues [5–13]. However, SP cells also express multi-drug transporter proteins, including MDR1 and ABCG2 [14, 15], which not only efflux Hoechst dye but also rapidly reduce the intracellular concentrations and thus the cytotoxicity of many commonly used therapeutic drugs [16–18].
We previously identified tumor cells with primary drug resistance using side-population (SP) analysis [6]. Despite their resistance to chemotherapeutics, SP cells may still be susceptible to immune responses since Englemann and colleagues demonstrated that SP cells from the MCF7 breast cancer cell line, which are both resistant to chemotherapeutic drugs and radiation [19], express the tumor-associated antigen (TAA) MUC1, which is a target of antigen-specific CTL [20, 21]. Hence, the identification of antigens expressed by SP tumor cells may allow the development of immune-based therapies that target tumor cells resistant to conventional treatment modalities. Our own studies have suggested the clinical relevance of immune targeting of chemoresistant cells, since treatment of relapsed/chemoresistant Epstein-Barr virus (EBV) positive HL with cytotoxic T lymphocytes (CTL) specific for EBV lytic antigens [22] or latent antigens (e.g. LMP-1 and 2) can induce complete disease responses [23]. Additionally, Till et al showed that infusion of CTL genetically engineered to express an anti-CD20 chimeric antigen receptor could also promote partial and complete responses in patients with relapsed and refractory B cell lymphomas [24]. In other words, adoptive T cell therapy may eradicate chemoresistant tumors provided that the antigenic targets are expressed by the residual cells.
Our current data show the existence of an SP subset in HL which have primary drug resistance, but which remain (like classical Hodgkin’s Reed-Sternberg (HRS) cells) CD30 positive, and express high levels of TAAs following demethylation with decitabine. The ability to target this SP subset by immunotherapy may further improve the response rates in subjects with relapsed and refractory HL.
MATERIALS AND METHODS
Cell Lines and Primary Tumor Samples
We obtained four EBV negative HL cell lines L428, HDLM2, L1236 and L540 from DSMZ (Braunschweig, Germany). All were maintained in RPMI 1640 supplemented with 10% fetal bovine serum (FBS) (FBS; Gibco, Carlsbad, CA) and 2 mM L-glutamine (GlutaMAX; Gibco). Primary tumor samples were obtained through a Baylor College of Medicine Institutional Review Board approved protocol. Fresh tissue specimens were prepared on the day of resection by passing the cultured cells multiple times through a 100 micron filter to make a single cell suspension. Cells were then prepared and analyzed as described below.
SP Analysis and Phenotyping
For SP analysis, HL cell lines and primary HL tumor cells were resuspended at 1×10⁶ cells/ml in pre-warmed RPMI with 2% FBS and 10 mM HEPES (Sigma-Aldrich, St. Louis, MO). Hoechst 33342 dye (Sigma) was added to a final concentration of 5 μg/ml as previously described [3]. Cells were then incubated at 37 C for 105 minutes, washed in ice cold Hank’s buffered salt solution supplemented with 2% FBS and 10 mM HEPES (HBSS+) and then immediately placed on ice. Where indicated, cells were co-incubated with 50 μM Verapamil (Sigma) to block Hoechst efflux. For analysis of SP frequency, a live gate was defined by using the Hoechst red and blue axes to exclude dead cells (PI positive) and debris. For further phenotypic analyses, Hoechst labeled cells were subsequently stained with fluorescent-conjugated antibodies: CD3, CD15, CD19, CD20 and CD30 (all from BD Biosciences, San Jose, CA) for 15 minutes on ice. Cells were then washed again and resuspended in ice cold HBSS+ buffer containing 2 μg/ml propidium iodide (PI; Sigma-Aldrich) for dead cell exclusion. Gates for SP and NSP (bulk tumor cells) were subsequently used to determine expression of surface antibodies using a BD LSRII analyzer (BD Bioscience, San Jose, CA). For SP and NSP isolation, we sorted cells using a high-speed cell sorter (MoFlo, Dako Cytomation, Fort Collins, CO) as previously described [6].
Gemcitabine Drug Resistances Assays
We sorted HL cells from the SP and NSP subsets and grew equal numbers in culture media as described above, either with or without treatment with 10 nM gemcitabine (Eli Lily, Indianapolis, IN). For cell viability assays, 5000 sorted SP or NSP cells were cultured with 2×10⁵ gemcitabine-sensitive L1236 feeder cells (for 2% chemoresistant cell frequency). SP and NSP cells were then either cultured without drug or treated with 10 nM gemcitabine (added daily) for 72 hours. Following drug exposure, we washed the cells and plated them in fresh media without gemcitabine for 48 hours, and counted viable cells by trypan blue dye exclusion. To measure cell proliferation, 2000 SP or NSP cells were plated into 96-well plates in triplicate and cultured with or without gemcitabine for 7 days. On day 7, cells were incubated with 5 μCi [3H]-thymidine for 16 hours and then harvested and counted for [3H]-thymidine incorporation using a TriCarb 2500 TR β-counter (Perkin Elmer, Waltham, MA). Results are shown as counts per minute (CPM). To determine whether SP or NSP cells undergo cell death and apoptosis following gemcitabine exposure, we used the fluorochrome inhibitor of caspases (FLICA) (Abd Serotec, Raleigh, NC), which measures apoptosis by detecting active caspases (poly-caspase; caspase-1, -3, -4, -5, -6, -7, -8 and -9) in living cells [25]. Here, tumor cell lines were first cultured with or without 10 nM for 48 hours, then harvested and stained with Hoechst dye, followed by incubation with carboxyfluorescein labeled FLICA for 5 minutes at 37° and 5% CO2, followed washing and resuspension in PBS containing PI. Cells were placed on ice and analyzed for SP and apoptosis by flow cytometry using the LSRII analyzer (BD).
Immunohistochemistry
Cell lines and primary HL samples were cultured in the presence of 1 μM 5-aza-2′-deoxycitabine (Decitabine; Sigma-Aldrich) for 48 hours whereas control cells were cultured in media only. After incubation, cells were washed and cultured without decitabine for an additional 5 days to allow for TAA protein expression. Cells were harvested and resuspended in phosphate buffered saline (PBS; Sigma-Aldrich), mounted onto glass slides (Shandon Cytospin 4 Cytocentrifuge; Thermo Scientific, Waltham, MA) and then fixed with 4% paraformaldehyde (Cytofix; BD). Cells were subsequently permeabilized using 0.3% Triton-X-100 (Gibco) for 5 minutes followed by incubation with Digest ALL1 (Zymed, San Francisco, CA) for 10 minutes at 37°C. To block endogenous peroxidase activity, cells were treated with 3% hydrogen peroxide (Sigma). We used Powervision+ kits (ImmunoVision Technologies, Daly City, CA) according the manufacturer’s recommendation for immunohistochemical analysis. Briefly, slides were first incubated in pre-block/diluent for 30 minutes followed by incubation with mouse anti-human MAGEA4 antibody (AbCam, Cambridge, MA) diluted 1:50 in dilutant for 1 hour at room temperature. We used anti-mouse/anti-rabbit horseradish peroxidase (HRP) to detect MAGEA4 positive cells, followed by enzymatic conversion using the chromogenic substrate 3,3 diaminobenzidine (DAB).
Gene Expression Analysis
To compare expression of ABC transporter genes, RNA was isolated from equal numbers of sorted SP and NSP cells using Qiagen RNeasy Micro Kits (Qiagen, Valencia, CA) and used as template for OneStep RT-PCR (Qiagen) with gene-specific primers to ABCG2, MDR1, MAGEA4, SSX2, NY-ESO-1 and Survivin (purchased from SABiosciences, Frederick, MA) and normalized to expression of the housekeeping gene, GAPDH (SABiosciences). To measure TAA gene expression and the effects of decitabine demethylation on gene expression, cells were cultured with and without decitabine as described above. 48 hours after decitabine exposure, cells were harvested and analyzed for TAA transcripts using One-Step RT-PCR with the above gene-specific primers using conditions specified by the manufacturer. PCR bands were visualized on 1% agarose gels with ethidium bromide (Sigma).
Generation of MAGEA4-Specific CTL
To isolate and expand MAGEA4-specific CTL (MAGE-CTL), we generated monocyte-derived dendritic cells (DC) by isolating CD14+ monocytes from peripheral blood mononuclear cells (PBMC) using magnetic CD14+ bead separation (MACS, Miltenyi, Auburn, CA). Purified monocytes (>80%) were subsequently cultured in DC media (CellGenix, Antioch, IL) supplemented with 1000 U/ml IL-4 and 800 U/ml GM-CSF (both from R&D Systems, Minneapolis, MN). After 5 days, DC were matured in a cocktail containing PGE2 (1 μg/ml), IL-1β (10 ng/ml), IL-6 (100 ng/ml) and TFN-α (10 ng/ml) (all from R&D). On day 7, DC were harvested and pulsed with 2 μg/ml of a MAGEA4 overlapping peptide library (PepMix library, 15mers overlapping by 11 amino acids; JPT Technologies, Berlin, Germany), irradiated (30 Gy) and used to stimulate autologous PBMC at a ratio of 1:10 DC to PBMC on days 0 and 9 of the CTL culture. During the initial stimulation, culture media was supplemented with IL-7 (10 ng/ml), IL-12 (1 ng/ml) and IL-15 (2 ng/ml) (all from R&D). During the second and subsequent stimulations, CTL cultures were stimulated with peptide-pulsed DC in the presence of IL-7 alone. On day 12, culture media was supplemented with 50 U/ml IL-2 (Proleukin; Chiron, Emeryville, CA) to promote cell expansion.
ELIspot Assays
IFN-γ ELIspot assays have been previously described [26]. T cells were plated in triplicate and MAGEA4 or an irrelevant peptide library added. Plates were then developed and IFN-γ spot number determined by an independent, blinded observer (ZellNet Consulting, Inc., NY, NY).
CTL and Tumor Cell Co-Cultures Assays
To determine whether CTL could recognize and eliminate CTA expressing SP cells, we added decitabine to 1 μM concentration daily for two days to 5×10⁵ HDLM2 tumor cells in triplicate. After drug treatment, the tumor cells were washed and grown in fresh media without drug, and co-cultured with 1×10⁶ MAGE-A4-specific, HLA-A*02 matched or non-matched CTL. After 5 days, the co-cultures were analyzed for SP frequency and cell viability, using trypan blue exclusion. We reported the results as the percentage viable cells in the drug treated versus untreated tumor SP cells. Cell death following co-culture assays was also measured by PI positivity by flow cytometry.
Statistics
All in vitro data are presented as means plus or minus standard deviation. Where applicable, 2 tailed student t tests were used to determine the statistical significance differences between samples. A p value of ≤.05 was considered significant.
RESULTS
Detection of SP in HL Cell Lines
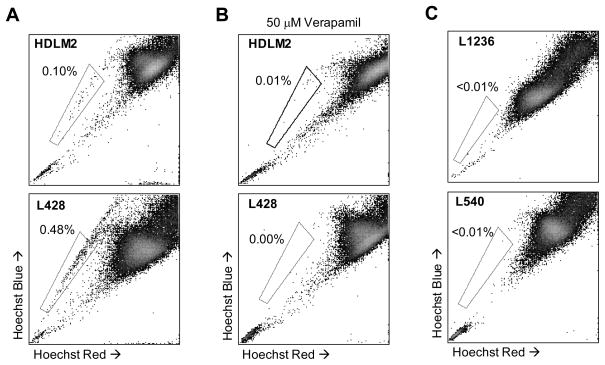
To determine whether HL contains a chemoresistant SP subset, we stained four HL cell lines (HDLM2, L428, L1236 and L540) with Hoechst 33342 dye and analyzed them by flow cytometry. In two of the cell lines, HDLM2 and L428, we detected a distinct SP phenotype forming 0.1% and 0.48% of the total cells, respectively (Figure 1a). To confirm that the SP phenotype was due to transporter dependent mechanisms, we co-incubated the cells with Verapamil, which abolished Hoechst efflux and SP formation (Figure 1b) indicating that this phenotype was not attributable to non-specific staining (Figure 1b). Two of the four HL cell lines, L1236 and L540, lacked SP cells (Figure 1c).
Figure 1. Detection of a distinct SP in HL cell lines.
A) HDLM2 and L428 were incubated with Hoechst dye and analyzed by flow cytometry for SP. B) To validate the SP phenotype, HL cell lines were co-incubated with Hoechst dye and 50 μM Verapamil which efficiently blocked SP formation. C) Two cell lines, L1236 and L540, did not possess an SP fraction following Hoechst labeling.
Detection of CD30+ SP Cells in Primary Tumor Biopsies
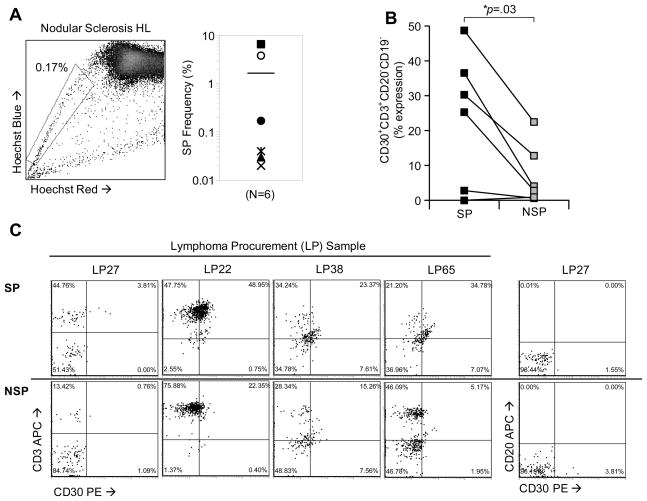
We next sought to determine whether primary HL samples contained SP cells, and whether these cells expressed phenotypic markers characteristic of HRS cells (CD30+CD15+CD20−) [27]. We analyzed 6 primary lymph node biopsies from HL patients and found that all (100%) samples contained a distinct SP phenotype (range = 0.02%–6.5%; mean = 1.7%) (Figure 2a). Fromm and colleagues demonstrated that HRS cells can be detected by flow cytometry using a panel of surface markers (CD30+, CD15dim CD20− and CD45−), and that HRS cells were often found in HRS-T cell rosettes [28, 29]. To determine if SP cells possessed a similar HRS phenotype, we stained with CD30, CD3, CD15, CD19 and CD20 antibodies following Hoechst labeling and compared expression of these antigens on gated SP and NSP (bulk) viable cells. We found a higher proportion of CD30+CD3+CD19−CD20− cells in the SP (mean 24.2%±18%; range 0.0% to 49.0%) fraction compared to NSP cells (mean 8.5%±8.5%; range 1.2% to 22.4%) (p=0.03) (Figures 2b and 2c). In this sample set, we were unable to detect a significant cell population that co-expressed both CD30 and CD15 (not shown). These data indicate that cells isolated from lymph node biopsies from patients diagnosed with HL contain SP cells with an HRS phenotype.
Figure 2. Detection of CD30+ SP cells in primary HL biopsies.
A) SP cells were detected in freshly isolated lymphoma samples from HL patients (6/6). A representative SP phenotype is shown for a nodular sclerosis HL patient. The mean SP frequency in these primary samples (right panel) was 1.8% (range, 0.02%–6.54%). B) The phenotype of primary HL SP and NSP tumor cells was determined using antibodies (CD30, CD3, CD19, CD20) in combination with Hoeschst staining. SP and NSP cells were gated and then measured for expression, showing a significant increase in CD30+CD3+CD19-CD20-cells in the SP fraction. C) Expression of CD30 and CD3 for four primary lymphoma samples are shown. CD20 expression with CD30 is shown for one primary sample (LP27).
HL SP Cells Express High Levels of ABCG2 and MDR1 and are Gemcitabine Resistant
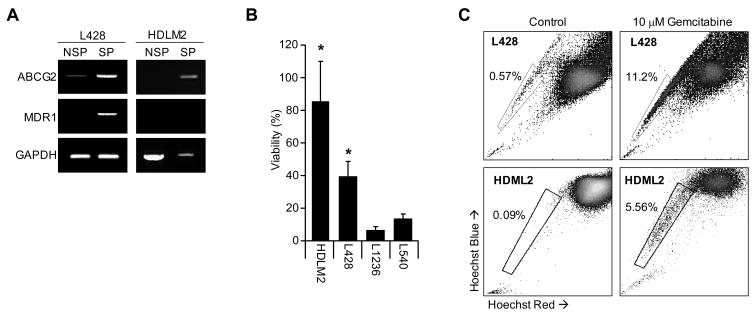
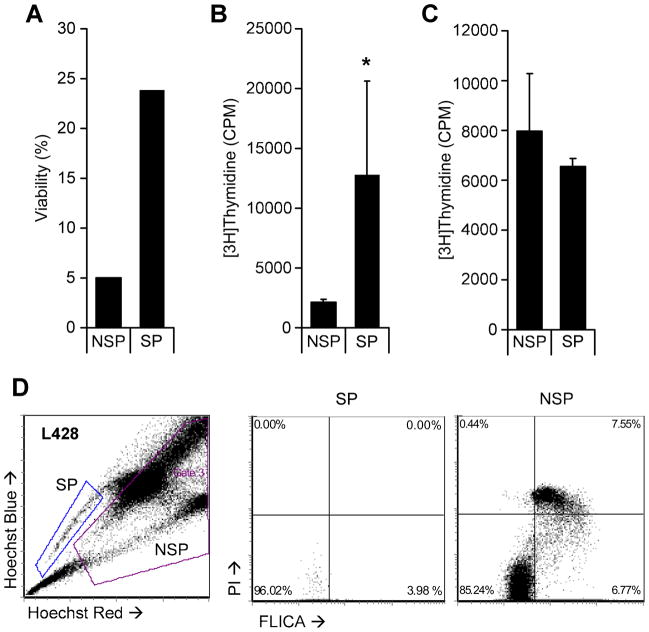
Because of the association of the SP phenotype with the presence of multi-drug resistance proteins, we examined whether the SP cells of HL cell lines expressed MDR1 and ABCG2. The cell lines L428 and HDLM2 were sorted into SP and NSP fractions and RT-PCR used to measure expression of these two transporters. As anticipated, we observed increased levels of ABCG2 and MDR1 in SP cells compared to NSP cells (Figure 3a). Since the SP cells from other hematologic malignancies are more resistant to commonly used chemotherapeutic agents than the NSP subset [30, 31], we assessed the gemcitabine resistance of HL SP cells, since this agent is widely used to treat relapsed HL. We first cultured SP positive cell lines (HDLM2 and L428) and SP negative cell lines (L1236 and L540) with and without gemcitabine and evaluated cell viability after 7 days. The viability of the SP lines HDLM2 and L428 were 81%±22% and 39%±6% respectively. These results were compared to the observed viability of gemcitabine treated HL cell lines which lack SP cells; the viability of each was substantially lower (L1236 7%±2% and L540 14%±2%), indicating that cell lines containing SP cells are more resistant to f gemcitabine than cell lines without (Figure 3b). We compared the SP cell frequency in HDLM2 and L428 before and after exposure to gemcitabine and found a 20 and 60-fold enrichment, respectively (Figure 3c). We then sorted SP and NSP cells from L428 and found only 5% of NSP tumor cells survived gemcitabine treatment compared to 20% of SP cells (Figure 4a), while analysis of DNA synthesis showed higher thymidine incorporation in SP cells than NSP cells after drug exposure (Figure 4b). These effects were not due to Hoechst dye toxicity, as both SP and NSP HL cells had equivalent survival and thymidine incorporation after exposure to Hoechst dye in the absence of gemcitabine (Figure 4c). Enrichment of SP cells and reduction in survival of NSP cells is likely due to greater apoptosis in the NSP (bulk) tumor fraction, since the fluorochrome-labeled inhibitors of caspases (FLICA) assay [25] showed greater FLICA staining in the NSP fraction (6.7%) compared to the SP fraction (3.9%) 48 hrs after gemcitabine exposure (Figure 4d). Together, these data indicate that SP cells have increased tolerance to gemcitabine compared to bulk tumor (NSP) cells and support the potential of HL SP cells to contribute to disease resurgence following chemotherapy.
Figure 3. SP containing HL cell lines express drug resistance transporter proteins and are resistant to gemcitabine.
A) RT-PCR for the multi-resistance genes ABCG2 and MDR1 was performed for SP and NSP (NSP) fractions from the cell lines L428 and HDLM2 showing increased expression of resistance genes compared to GAPDH. B) SP positive cell lines, HDLM2 and L428, were compared with the SP negative cell lines, L1236 and L540, for viability after exposure to 10 nM gemcitabine demonstrating increased resistance in HDLM2 and L428. C) The HL cell lines (L428 and HDLM2) were cultured in the presence of 10 nM gemcitabine for 72 hours and then assessed for SP frequency. In both cell lines, SP frequency was enriched indicating increased resistance to the cytotoxic drug.
Figure 4. Sorted SP cells show enhanced tolerance to gemcitabine.
Equal numbers of SP and NSP (NSP) tumor cells from L428 were sorted and cultured in the presence of 10 nM gemcitabine and measured for viability (A) and proliferation by thymidine incorporation (B) and compared to SP and NSP from cells treated with PI only (C). Asterisk indicates p<.05. D) L428 was exposed to 10 nM gemcitabine and analyzed for cell death and apoptosis in combination with Hoechst dye. SP and NSP cells were subsequently gated and compared for FLICA and PI.
HL SP Cells Have Increased Expression of CTA Following Demethylation Compared to NSP
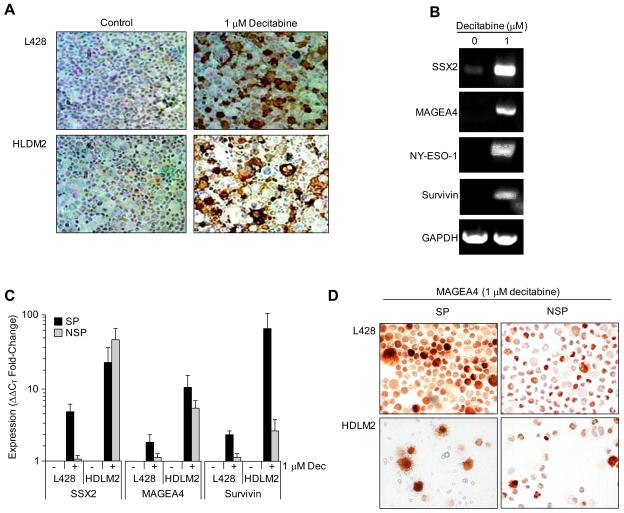
We compared expression of HL-associated tumor antigens on SP and NSP cells, examining MAGEA4, SSX2, survivin and NY-ESO-1 [32, 33]. Although none of these antigens were highly expressed in SP or NSP from any cell lines by RT-PCR (not shown) treatment with the demethylating agent decitabine (5-aza-2′-deoxycitidine) induced MAGEA4 protein expression in both HDLM2 and L428 (Figure 5a) and increased RNA expression of SSX2, MAGE-A4, NY-ESO-1 and survivin (Figure 5b). L428 and HLDM2 were sorted into SP and NSP fractions following decitabine exposure and analyzed by quantitative PCR (Q-PCR), where SSX2, MAGEA4, and survivin expression were increased more prominently in the SP fraction compared to bulk tumor cells (Figure 5c). MAGEA4 protein expression in SP and NSP tumor cells was subsequently confirmed by immunohistochemistry demonstrating that demethylation by decitabine treatment can induce TAA expression in chemoresistant SP cells (Figure 5d).
Figure 5. HL SP cells express cancer testis target antigens.
A) L428 and HDLM2 were cultured with 1 μM decitabine and then analyzed for MAGEA4 expression by IHC. MAGEA4 antigen was expressed only following decitabine exposure (right panels). B) To examine the effects of decitabine on primary HL, cells isolated from a nodular sclerosis HL were isolated and cultured with or without 1 μM decitabine and then analyzed by RT-PCR for expression of SSX2, MAGEA4, NY-ESO-1 and survivin antigens, and compared to GAPDH. C) To examine preferential expression of TAA in SP and NSP subpopulations, SP and bulk tumor cells (NSP) were isolated from L428 and HLDM2 after exposure to 1 μM decitabine (indicated by “+”), and real-time quantitative PCR was subsequently performed to measure SSX2, MAGEA4 and survivin. D) Sorting of SP and NSP tumor cells from HDLM2 and L428 and subsequent IHC for MAGEA4 antigen expression confirmed PCR data demonstrating that MAGEA4 is elevated in expression in tumor SP cells.
MAGEA4-Specific CTL can Recognize and Eliminate Lymphoma SP Tumor Cells
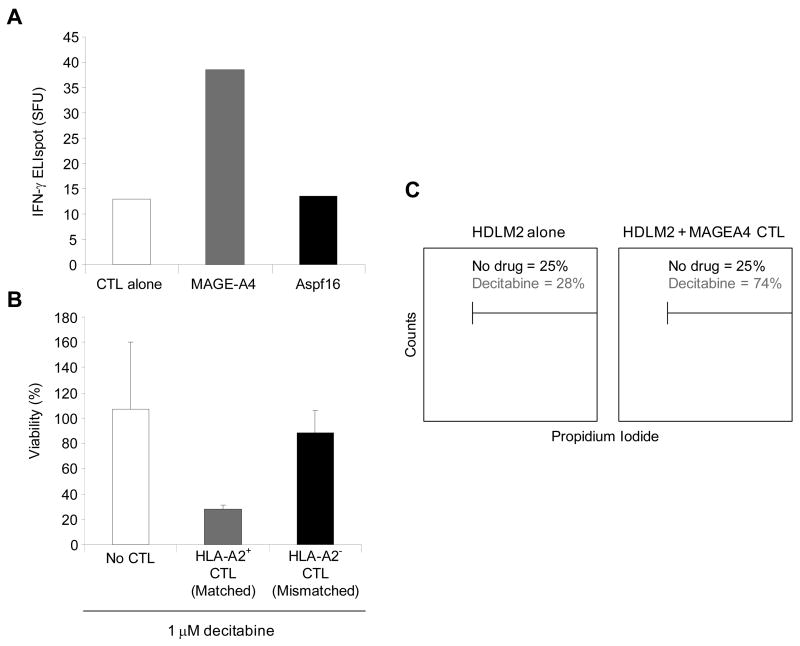
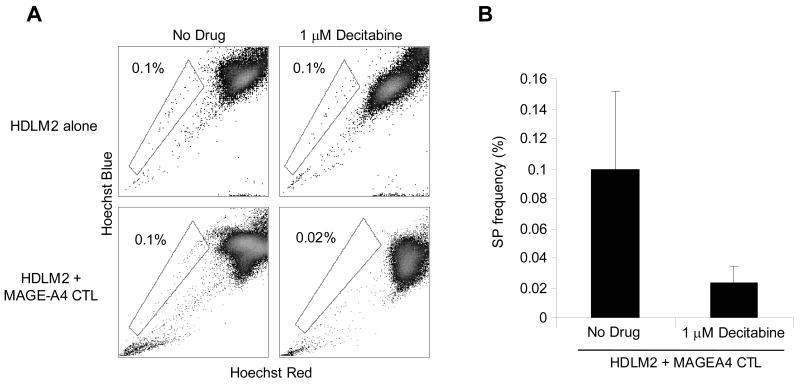
To discover whether chemoresistant SP cells could be targeted by T cells directed to the TAA expressed by the SP cells, we generated MAGEA4-specific CTLs, that responded in an ELIspot assay to MAGEA4 peptides (PepMix), but not to a control peptide library (Aspf16) (Figure 6a). MAGEA4-specific CTLs from HLA-A2+ normal donors could kill decitabine treated HLA-A2+ HDLM2 tumor cells, while CTLs from HLA-A2− donors could not, (mean tumor cell viability: 24% versus 74%, p=0.01) (Figure 6b). In addition, co-culture experiments using MAGEA4-specific CTL with the HDLM2 cell line showed increased killing via PI staining when used in combination with decitabine, and negligible killing without demethylation treatment (Figure 6c). Because SP cells express elevated levels of MAGEA4 following decitabine treatment compared to NSP, we then compared the susceptibility of SP cells and NSP cells to elimination by MAGEA4-specific CTLs. There was no change in SP frequency when HDLM2 were exposed to decitabine or CTLs alone (Figure 7). However, the combination of decitabine treated (HLA-A2+) HDLM2 tumor cells and HLA-A2 matched MAGE-specific CTL dramatically reduced SP cell frequency (p<0.05) (Figures 7a and 7b), showing that MAGEA4-specific CTLs can kill chemoresistant SP HL tumor cells.
Figure 6. Generation of MAGEA4-specific CTL for targeting of HL.
A) MAGEA4-specific CTL were stimulated and expanded in vitro by peptide-pulsed DC. To confirm specificity of the CTL lines, IFN-γ ELIspot analyses were performed against a MAGEA4 PepMix and compared to an irrelevant PepMix (Aspf16) and CTL alone, demonstrating MAGEA4 peptide specificity. B) MAGEA4-specific CTL were HLA-A2-restricted as demonstrated by co-culture with the HLA-A2+ cell line, HDLM2, where cell lysis was observed when the tumor cells were cultured with CTL and 1 μM decitabine, but not without CTL or with an MHC-mismatched MAGEA4 CTL line. C) Histogram which compares HDLM2 viability (PI) indicating lysis of HDLM2 when cultured with MAGEA4-specific CTL (gray lines) or without CTL (black lines) in the presence of decitabine.
Figure 7. MAGEA4-specific CTL eliminates HL SP tumor cells.
To demonstrate specific elimination of SP tumor cells by MAGEA4-specific CTL, the HLA-A2+ cell line HDLM2 was cultured alone or with MAGEA4-specific CTL (effector to target ratio of 2:1), either in the presence of 1 μM decitabine or without. Following culture for 48 hours, cultures were reanalyzed for SP frequency demonstrating that SP are eliminated in conditions containing both CTL and decitabine. B) SP percentage of HDLM2 tumor cells cultured with and without decitabine (p=0.05).
DISCUSSION
In this study, we have found that both HL cell lines and primary HL tumor cells contain a minor side-population of tumor cells that have increased resistance to gemcitabine, but that also express tumor associated antigens which render them susceptible to killing by tumor-specific CTLs following demethylation with decitabine. While this primary drug resistant SP subset may therefore contribute to resurgent disease, a combination of chemotherapy and targeted immunotherapy may be able to reduce tumor burden and decrease the risk of relapse.
An SP subset of cells has been identified in a variety of hematologic malignancies and solid tumors [9, 30, 34–37], but had not yet been reported in HL. We detected SP cells in two HL cell lines, HLDM2 and L428, which conferred primary drug resistance to the cell lines compared to those lacking SP cells. Importantly, we also detected SP cells in primary HL biopsy samples that possessed an HRS phenotype, including increased expression of CD30, CD3 (T cell rosettes [28, 29]) and lack of CD20 (Figure 2). Because not all SP cells were CD30+, it is likely that SP cells found in these biopsies include normal B and T lymphocytes in addition to malignant cells, and that definitive identification of HRS cells with SP properties will need to be confirmed by clonal analyses, However, these results are suggestive that a malignant chemoresistant cell type exists that could contribute to relapse following disease treatment and may be targetable by antigen-specific CTL.
In other malignancies, SP cell resistance to lipophilic anti-neoplastic drugs, such as doxorubicin and mitoxantrone, can be attributed to the expression of the multi-drug transporter proteins including ABCG2 and MDR1 [5, 6]. More recent studies, however, have indicated that malignant SP cells may be more generally resistant to cytotoxic drugs, such as gemcitabine, independent of their excretion by transporter proteins [8,33] and may also resist radiotherapy [38], This may help explain the resistance of refractory HL to these commonly used treatment modalities [39, 40]. Because HL SP cells have lower apoptosis rates following exposure to gemcitabine compared to NSP cells, and can proliferate even in the presence of the drug, such chemotherapy exposure can simply enrich for drug resistant SP cells (Figures 3 and 4). Although we do not know the mechanisms for this transporter-protein independent resistance in HL-SP cells study of SP cells in pancreatic [41] and gastrointestinal derived cell lines [8], show the cells express CEACAM6 (carcinoembryonic antigen-related cell adhesion molecule 6), which modulates Akt-associated anti-apoptotic activity, which would provide gemcitabine resistance [42]. Additionally, Bleau and colleagues found that PI3K/Akt regulates ABCG2 expression in SP cells in malignant gliomas, suggesting that malignant SP cells reside in a distinct biological state that renders them insensitive to radiotherapy and a variety of chemotherapy agents [43].
The potential benefits of CTL for chemoresistant hematological malignancy is supported by the long-term cures obtained following adoptive transfer of donor leukocyte infusions (DLI) to relapsed patients after allogeneic stem cell transplant [44, 45]. Predictably safe and effective immunotherapy, however, requires identification of specific target antigens that reside within the chemoresistant population. We have now shown that HL SP cells from cell lines have enhanced expression of TAAs, including MAGEA4, SSX2, NY-ESO-1 and survivin compared to NSP cells, although such expression was only seen at consistently high levels following decitabine demethylation (Figure 5). Due to technical difficulties in culturing and isolating sufficient numbers of viable SP cells from primary samples following demethylation, we were unable to determine whether this effect is also relevant to HRS cells in vivo. However, other studies have shown that HL cells have increased CpG methylation [46], and global hypomethylation is commonly seen in leukemias [47], so that demethylating treatments may be a generally applicable tool for enhancing TAA expression in lymphoma and leukemia if the malignant cells are to be made susceptible to immunotherapies [48–54]. Since multiple TAA are upregulated within chemoresistant SP cells, it should be possible to target several antigens simultaneously, thereby reducing the risk of tumor immune escape [55].
In summary, we have identified a distinct SP subset in HL cell lines and primary tumor biopsies that are resistant to chemotherapy, but can be eradicated with TAA-specific CTL following decitabine demethylation. Combination therapeutic strategies that use conventional chemotherapy to debulk tumor burden, followed by novel drugs such as histone deacetylation (HDAC) inhibitors and T cell immunotherapy may eliminate residual chemoresistant tumor cells and help prevent disease relapse.
Acknowledgments
We would like to acknowledge Christopher Threeton and Tatiana Gotsolva for flow cytometry and cell sorting technical assistance. This work was supported by NIH SPORE Grant P50CA126752.
References
- 1.Evens AM, Hutchings M, Diehl V. Treatment of Hodgkin lymphoma: the past, present, and future. Nat Clin Pract Oncol. 2008;5:543–556. doi: 10.1038/ncponc1186. [DOI] [PubMed] [Google Scholar]
- 2.Reis LAG, Melbert D, Krapcho M, Stinchcomb DG, Howlader N, Horner MJ, et al. SEER Cancer Statistics Review, 1975–2005. National Cancer Institute; 2008. [Google Scholar]
- 3.Goodell MA, Brose K, Paradis G, Conner AS, Mulligan RC. Isolation and functional properties of murine hematopoietic stem cells that are replicating in vivo. J Exp Med. 1996;183:1797–1806. doi: 10.1084/jem.183.4.1797. [DOI] [PMC free article] [PubMed] [Google Scholar]
- 4.Goodell MA, Rosenzweig M, Kim H, Marks DF, DeMaria M, Paradis G, et al. Dye efflux studies suggest that hematopoietic stem cells expressing low or undetectable levels of CD34 antigen exist in multiple species. Nat Med. 1997;3:1337–1345. doi: 10.1038/nm1297-1337. [DOI] [PubMed] [Google Scholar]
- 5.Wulf GG, Wang RY, Kuehnle I, Weidner D, Marini F, Brenner MK, et al. A leukemic stem cell with intrinsic drug efflux capacity in acute myeloid leukemia. Blood. 2001;98:1166–1173. doi: 10.1182/blood.v98.4.1166. [DOI] [PubMed] [Google Scholar]
- 6.Hirschmann-Jax C, Foster AE, Wulf GG, Nuchtern JG, Jax TW, Gobel U, et al. A distinct “side population” of cells with high drug efflux capacity in human tumor cells. Proc Natl Acad Sci U S A. 2004;101:14228–14233. doi: 10.1073/pnas.0400067101. [DOI] [PMC free article] [PubMed] [Google Scholar]
- 7.Patrawala L, Calhoun T, Schneider-Broussard R, Zhou J, Claypool K, Tang DG. Side population is enriched in tumorigenic, stem-like cancer cells, whereas ABCG2+ and A. Cancer Res. 2005;65:6207–6219. doi: 10.1158/0008-5472.CAN-05-0592. [DOI] [PubMed] [Google Scholar]
- 8.Haraguchi N, Utsunomiya T, Inoue H, Tanaka F, Mimori K, Barnard GF, et al. Characterization of a side population of cancer cells from human gastrointestinal system. Stem Cells. 2006;24:506–513. doi: 10.1634/stemcells.2005-0282. [DOI] [PubMed] [Google Scholar]
- 9.Szotek PP, Chang HL, Brennand K, Fujino A, Pieretti-Vanmarcke R, Lo CC, et al. Normal ovarian surface epithelial label-retaining cells exhibit stem/progenitor cell characteristics. Proc Natl Acad Sci U S A. 2008;105:12469–12473. doi: 10.1073/pnas.0805012105. [DOI] [PMC free article] [PubMed] [Google Scholar]
- 10.Ho MM, Ng AV, Lam S, Hung JY. Side population in human lung cancer cell lines and tumors is enriched with stem-like cancer cells. Cancer Res. 2007;67:4827–4833. doi: 10.1158/0008-5472.CAN-06-3557. [DOI] [PubMed] [Google Scholar]
- 11.Kayo H, Yamazaki H, Nishida H, Dang NH, Morimoto C. Stem cell properties and the side population cells as a target for interferon-alpha in adult T-cell leukemia/lymphoma. Biochem Biophys Res Commun. 2007;364:808–814. doi: 10.1016/j.bbrc.2007.10.070. [DOI] [PubMed] [Google Scholar]
- 12.Matsui W, Wang Q, Barber JP, Brennan S, Smith BD, Borrello I, et al. Clonogenic multiple myeloma progenitors, stem cell properties, and drug resistance. Cancer Res. 2008;68:190–197. doi: 10.1158/0008-5472.CAN-07-3096. [DOI] [PMC free article] [PubMed] [Google Scholar]
- 13.Moshaver B, van RA, Kelder A, van der Pol M, Terwijn M, Bachas C, et al. Identification of a small subpopulation of candidate leukemia-initiating cells in the side population of patients with acute myeloid leukemia. Stem Cells. 2008;26:3059–3067. doi: 10.1634/stemcells.2007-0861. [DOI] [PubMed] [Google Scholar]
- 14.Bunting KD. ABC transporters as phenotypic markers and functional regulators of stem cells. Stem Cells. 2002;20:11–20. doi: 10.1002/stem.200011. [DOI] [PubMed] [Google Scholar]
- 15.Zhou S, Schuetz JD, Bunting KD, Colapietro AM, Sampath J, Morris JJ, et al. The ABC transporter Bcrp1/ABCG2 is expressed in a wide variety of stem cells and is a molecular determinant of the side-population phenotype. Nat Med. 2001;7:1028–1034. doi: 10.1038/nm0901-1028. [DOI] [PubMed] [Google Scholar]
- 16.Doyle LA, Yang W, Abruzzo LV, Krogmann T, Gao Y, Rishi AK, et al. A multidrug resistance transporter from human MCF-7 breast cancer cells. Proc Natl Acad Sci U S A. 1998;95:15665–15670. doi: 10.1073/pnas.95.26.15665. [DOI] [PMC free article] [PubMed] [Google Scholar]
- 17.Bunting KD. ABC transporters as phenotypic markers and functional regulators of stem cells. Stem Cells. 2002;20:11–20. doi: 10.1002/stem.200011. [DOI] [PubMed] [Google Scholar]
- 18.Plasschaert SL, de Bont ES, Boezen M, vander Kolk DM, Daenen SM, Faber KN, et al. Expression of multidrug resistance-associated proteins predicts prognosis in childhood and adult acute lymphoblastic leukemia. Clin Cancer Res. 2005;11:8661–8668. doi: 10.1158/1078-0432.CCR-05-1096. [DOI] [PubMed] [Google Scholar]
- 19.Woodward WA, Chen MS, Behbod F, Alfaro MP, Buchholz TA, Rosen JM. WNT/beta-catenin mediates radiation resistance of mouse mammary progenitor cells. Proc Natl Acad Sci U S A. 2007;104:618–623. doi: 10.1073/pnas.0606599104. [DOI] [PMC free article] [PubMed] [Google Scholar]
- 20.Brossart P, Heinrich KS, Stuhler G, Behnke L, Reichardt VL, Stevanovic S, et al. Identification of HLA-A2-restricted T-cell epitopes derived from the MUC1 tumor antigen for broadly applicable vaccine therapies. Blood. 1999;93:4309–4317. [PubMed] [Google Scholar]
- 21.Gong J, Apostolopoulos V, Chen D, Chen H, Koido S, Gendler SJ, et al. Selection and characterization of MUC1-specific CD8+ T cells from MUC1 transgenic mice immunized with dendritic-carcinoma fusion cells. Immunology. 2000;101:316–324. doi: 10.1046/j.1365-2567.2000.00101.x. [DOI] [PMC free article] [PubMed] [Google Scholar]
- 22.Bollard CM, Aguilar L, Straathof KC, Gahn B, Huls MH, Rousseau A, et al. Cytotoxic T lymphocyte therapy for Epstein-Barr virus+ Hodgkin’s disease. J Exp Med. 2004;200:1623–1633. doi: 10.1084/jem.20040890. [DOI] [PMC free article] [PubMed] [Google Scholar]
- 23.Bollard CM, Gottschalk S, Leen AM, Weiss H, Straathof KC, Carrum G, et al. Complete responses of relapsed lymphoma following genetic modification of tumor-antigen presenting cells and T-lymphocyte transfer. Blood. 2007;110:2838–2845. doi: 10.1182/blood-2007-05-091280. [DOI] [PMC free article] [PubMed] [Google Scholar]
- 24.Till BG, Jensen MC, Wang J, Chen EY, Wood BL, Greisman HA, et al. Adoptive immunotherapy for indolent non-Hodgkin lymphoma and mantle cell lymphoma using genetically modified autologous CD20-specific T cells. Blood. 2008;112:2261–2271. doi: 10.1182/blood-2007-12-128843. [DOI] [PMC free article] [PubMed] [Google Scholar]
- 25.Bedner E, Smolewski P, Amstad P, Darzynkiewicz Z. Activation of caspases measured in situ by binding of fluorochrome-labeled inhibitors of caspases (FLICA): correlation with DNA fragmentation. Exp Cell Res. 2000;259:308–313. doi: 10.1006/excr.2000.4955. [DOI] [PubMed] [Google Scholar]
- 26.Gottschalk S, Edwards OL, Sili U, Huls MH, Goltsova T, Davis AR, et al. Generating CTLs against the subdominant Epstein-Barr virus LMP1 antigen for the adoptive immunotherapy of EBV-associated malignancies. Blood. 2003;101:1905–1912. doi: 10.1182/blood-2002-05-1514. [DOI] [PubMed] [Google Scholar]
- 27.Chan WC. The Reed-Sternberg cell in classical Hodgkin’s disease. Hematol Oncol. 2001;19:1–17. doi: 10.1002/hon.659. [DOI] [PubMed] [Google Scholar]
- 28.Fromm JR, Kussick SJ, Wood BL. Identification and purification of classical Hodgkin cells from lymph nodes by flow cytometry and flow cytometric cell sorting. Am J Clin Pathol. 2006;126:764–780. doi: 10.1309/7371-XK6F-6P74-74XX. [DOI] [PubMed] [Google Scholar]
- 29.Fromm JR, Thomas A, Wood BL. Flow cytometry can diagnose classical hodgkin lymphoma in lymph nodes with high sensitivity and specificity. Am J Clin Pathol. 2009;131:322–332. doi: 10.1309/AJCPW3UN9DYLDSPB. [DOI] [PubMed] [Google Scholar]
- 30.Haraguchi N, Utsunomiya T, Inoue H, Tanaka F, Mimori K, Barnard GF, et al. Characterization of a side population of cancer cells from human gastrointestinal system. Stem Cells. 2006;24:506–513. doi: 10.1634/stemcells.2005-0282. [DOI] [PubMed] [Google Scholar]
- 31.Oguri T, Achiwa H, Sato S, Bessho Y, Takano Y, Miyazaki M, et al. The determinants of sensitivity and acquired resistance to gemcitabine differ in non-small cell lung cancer: a role of ABCC5 in gemcitabine sensitivity. Mol Cancer Ther. 2006;5:1800–1806. doi: 10.1158/1535-7163.MCT-06-0025. [DOI] [PubMed] [Google Scholar]
- 32.Chambost H, Van BN, Brasseur F, Godelaine D, Xerri L, Landi SJ, et al. Expression of gene MAGE-A4 in Reed-Sternberg cells. Blood. 2000;95:3530–3533. [PubMed] [Google Scholar]
- 33.Colleoni GW, Capodieci P, Tickoo S, Cossman J, Filippa DA, Ladanyi M. Expression of SSX genes in the neoplastic cells of Hodgkin’s lymphoma. Hum Pathol. 2002;33:496–502. doi: 10.1053/hupa.2002.124909. [DOI] [PubMed] [Google Scholar]
- 34.Harris MA, Yang H, Low BE, Mukherje J, Guha A, Bronson RT, et al. Cancer stem cells are enriched in the side population cells in a mouse model of glioma. Cancer Res. 2008;68:10051–10059. doi: 10.1158/0008-5472.CAN-08-0786. [DOI] [PMC free article] [PubMed] [Google Scholar]
- 35.Schatton T, Murphy GF, Frank NY, Yamaura K, Waaga-Gasser AM, Gasser M, et al. Identification of cells initiating human melanomas. Nature. 2008;451:345–349. doi: 10.1038/nature06489. [DOI] [PMC free article] [PubMed] [Google Scholar]
- 36.Wang J, Guo LP, Chen LZ, Zeng YX, Lu SH. Identification of cancer stem cell-like side population cells in human nasopharyngeal carcinoma cell line. Cancer Res. 2007;67:3716–3724. doi: 10.1158/0008-5472.CAN-06-4343. [DOI] [PubMed] [Google Scholar]
- 37.Wu C, Wei Q, Utomo V, Nadesan P, Whetstone H, Kandel R, et al. Side population cells isolated from mesenchymal neoplasms have tumor initiating potential. Cancer Res. 2007;67:8216–8222. doi: 10.1158/0008-5472.CAN-07-0999. [DOI] [PubMed] [Google Scholar]
- 38.Woodward WA, Chen MS, Behbod F, Alfaro MP, Buchholz TA, Rosen JM. WNT/beta-catenin mediates radiation resistance of mouse mammary progenitor cells. Proc Natl Acad Sci U S A. 2007;104:618–623. doi: 10.1073/pnas.0606599104. [DOI] [PMC free article] [PubMed] [Google Scholar]
- 39.Santoro A, Bredenfeld H, Devizzi L, Tesch H, Bonfante V, Viviani S, et al. Gemcitabine in the treatment of refractory Hodgkin’s disease: results of a multicenter phase II study. J Clin Oncol. 2000;18:2615–2619. doi: 10.1200/JCO.2000.18.13.2615. [DOI] [PubMed] [Google Scholar]
- 40.Zinzani PL, Bendandi M, Stefoni V, Albertini P, Gherlinzoni F, Tani M, et al. Value of gemcitabine treatment in heavily pretreated Hodgkin’s disease patients. Haematologica. 2000;85:926–929. [PubMed] [Google Scholar]
- 41.Zhou J, Wang CY, Liu T, Wu B, Zhou F, Xiong JX, et al. Persistence of side population cells with high drug efflux capacity in pancreatic cancer. World J Gastroenterol. 2008;14:925–930. doi: 10.3748/wjg.14.925. [DOI] [PMC free article] [PubMed] [Google Scholar]
- 42.Duxbury MS, Ito H, Benoit E, Waseem T, Ashley SW, Whang EE. A novel role for carcinoembryonic antigen-related cell adhesion molecule 6 as a determinant of gemcitabine chemoresistance in pancreatic adenocarcinoma cells. Cancer Res. 2004;64:3987–3993. doi: 10.1158/0008-5472.CAN-04-0424. [DOI] [PubMed] [Google Scholar]
- 43.Bleau AM, Hambardzumyan D, Ozawa T, Fomchenko EI, Huse JT, Brennan CW, et al. PTEN/PI3K/Akt pathway regulates the side population phenotype and ABCG2 activity in glioma tumor stem-like cells. Cell Stem Cell. 2009;4:226–235. doi: 10.1016/j.stem.2009.01.007. [DOI] [PMC free article] [PubMed] [Google Scholar]
- 44.Heslop HE, Stevenson FK, Molldrem JJ. Immunotherapy of hematologic malignancy. Hematology Am Soc Hematol Educ Program. 2003:331–349. doi: 10.1182/asheducation-2003.1.331. [DOI] [PubMed] [Google Scholar]
- 45.Kolb HJ. Graft-versus-leukemia effects of transplantation and donor lymphocytes. Blood. 2008;112:4371–4383. doi: 10.1182/blood-2008-03-077974. [DOI] [PubMed] [Google Scholar]
- 46.Doerr JR, Malone CS, Fike FM, Gordon MS, Soghomonian SV, Thomas RK, et al. Patterned CpG methylation of silenced B cell gene promoters in classical Hodgkin lymphoma-derived and primary effusion lymphoma cell lines. J Mol Biol. 2005;350:631–640. doi: 10.1016/j.jmb.2005.05.032. [DOI] [PubMed] [Google Scholar]
- 47.Melki JR, Clark SJ. DNA methylation changes in leukaemia. Semin Cancer Biol. 2002;12:347–357. doi: 10.1016/s1044-579x(02)00055-x. [DOI] [PubMed] [Google Scholar]
- 48.Serrano A, Tanzarella S, Lionello I, Mendez R, Traversari C, Ruiz-Cabello F, et al. Rexpression of HLA class I antigens and restoration of antigen-specific CTL response in melanoma cells following 5-aza-2′-deoxycytidine treatment. Int J Cancer. 2001;94:243–251. doi: 10.1002/ijc.1452. [DOI] [PubMed] [Google Scholar]
- 49.Maio M, Coral S, Fratta E, Altomonte M, Sigalotti L. Epigenetic targets for immune intervention in human malignancies. Oncogene. 2003;22:6484–6488. doi: 10.1038/sj.onc.1206956. [DOI] [PubMed] [Google Scholar]
- 50.Sigalotti L, Fratta E, Coral S, Tanzarella S, Danielli R, Colizzi F, et al. Intratumor heterogeneity of cancer/testis antigens expression in human cutaneous melanoma is methylation-regulated and functionally reverted by 5-aza-2′-deoxycytidine. Cancer Res. 2004;64:9167–9171. doi: 10.1158/0008-5472.CAN-04-1442. [DOI] [PubMed] [Google Scholar]
- 51.Guo ZS, Hong JA, Irvine KR, Chen GA, Spiess PJ, Liu Y, et al. De novo induction of a cancer/testis antigen by 5-aza-2′-deoxycytidine augments adoptive immunotherapy in a murine tumor model. Cancer Res. 2006;66:1105–1113. doi: 10.1158/0008-5472.CAN-05-3020. [DOI] [PMC free article] [PubMed] [Google Scholar]
- 52.Fonsatti E, Sigalotti L, Coral S, Colizzi F, Altomonte M, Maio M. Methylation-regulated expression of HLA class I antigens in melanoma. Int J Cancer. 2003;105:430–431. doi: 10.1002/ijc.11077. [DOI] [PubMed] [Google Scholar]
- 53.Woloszynska-Read A, Mhawech-Fauceglia P, Yu J, Odunsi K, Karpf AR. Intertumor and intratumor NY-ESO-1 expression heterogeneity is associated with promoter-specific and global DNA methylation status in ovarian cancer. Clin Cancer Res. 2008;14:3283–3290. doi: 10.1158/1078-0432.CCR-07-5279. [DOI] [PMC free article] [PubMed] [Google Scholar]
- 54.Hambach L, Ling KW, Pool J, Aghai Z, Blokland E, Tanke HJ, et al. Hypomethylating drugs convert HA-1-negative solid tumors into targets for stem cell-based immunotherapy. Blood. 2009;113:2715–2722. doi: 10.1182/blood-2008-05-158956. [DOI] [PubMed] [Google Scholar]
- 55.Gottschalk S, Ng CY, Perez M, Smith CA, Sample C, Brenner MK, et al. An Epstein-Barr virus deletion mutant associated with fatal lymphoproliferative disease unresponsive to therapy with virus-specific CTLs. Blood. 2001;97:835–843. doi: 10.1182/blood.v97.4.835. [DOI] [PubMed] [Google Scholar]


