

Abstract
Neuropathology frozen section diagnoses are difficult in part because of the small tissue samples and the paucity of adjunctive rapid intraoperative stains. This study aims to explore the use of time-resolved laser-induced fluorescence spectroscopy as a rapid adjunctive tool for the diagnosis of glioma specimens and for distinction of glioma from normal tissues intraoperatively. Ten low grade gliomas, 15 high grade gliomas without necrosis, 6 high grade gliomas with necrosis and/or radiation effect, and 14 histologically uninvolved “normal” brain specimens are spectroscopicaly analyzed and contrasted. Tissue autofluorescence was induced with a pulsed Nitrogen laser (337 nm, 1.2 ns) and the transient intensity decay profiles were recorded in the 370-500 nm spectral range with a fast digitized (0.2 ns time resolution). Spectral intensities and time-dependent parameters derived from the time-resolved spectra of each site were used for tissue characterization. A linear discriminant analysis diagnostic algorithm was used for tissue classification. Both low and high grade gliomas can be distinguished from histologically uninvolved cerebral cortex and white matter with high accuracy (above 90%). In addition, the presence or absence of treatment effect and/or necrosis can be identified in high grade gliomas. Taking advantage of tissue autofluorescence, this technique facilitates a direct and rapid investigation of surgically obtained tissue.
Keywords: Glioblastoma, Glioma, Fluorescence spectroscopy, Optical diagnostic, Brain, Tumors, Diagnosis
2. INTRODUCTION
Neurosurgeons routinely obtain biopsy specimens of brain tumors and request intraoperative frozen sections to determine tumor type or the adequacy of a biopsy or a resection. Common questions asked of the pathologist include: 1. Is there glioma present? 2. Is the glioma lowgrade or high grade? To answer these questions, the standard intraoperative neuropathologic approach has included frozen sections and smears. Immunostains and molecular studies that might clarify a diagnosis are generally unavailable in the operative suite because of technical and time constraints. Ideally, an adjunctive technology would provide supportive diagnostic information rapidly but without requiring time-consuming tissue processing. A secondary use of such a technology is identifying the appropriate tissue to freeze and analyze. Specimens may be composed of fragments of non-neoplastic brain tissue and of tumor that may be difficult to distinguish with the naked eye. Analysis of admixed normal tissue rather than the neoplastic tissue would result in a false-negative frozen section.
Laser-induced fluorescence spectroscopy (LIFS) represents a promising new adjunctive technique in the diagnosis of tissue (1). Fluorescence spectroscopy involves the use of lasers to excite endogenous autofluorescence within tissues. Either steady-state (1-4) or time-resolved (5-8) fluorescence spectroscopy technique can be used to measure or monitor these changes. The time-resolved measurement resolves fluorescence intensity decay in terms of lifetimes and thus provides additional information about the underlying fluorescence dynamics and improves its specificity. Earlier work has demonstrated that steady-state LIFS of endogenous fluorophores (autofluorescence) can be used as a tool for diagnosis of neoplasms in brain (9-12). Several types of brain tumors have been investigated, both in-vivo and ex-vivo, using this technique. These include studies of glioblastoma (9-12), astrocytoma (12), oligodendroglioma (12), and metastatic carcinoma (12). Our group has previously reported results on the utility of time-resolved LIFS (TR-LIFS) for distinguishing glioblastoma from uninvolved cerebral cortex and white matter and on its increased specificity relative to steady-state fluorescence spectroscopy (13).
Using a prototype instrument allowing for simultaneous recording of both time-integrated (spectra) and time-resolved fluorescence, we evaluate the efficacy of the TR-LIFS technology in distinguishing brain tissue, low grade glioma, high grade glioma without necrosis or treatment effect, and high grade glioma with necrosis/treatment effect.
3. MATERIALS AND METHODS
3.1. Samples
The study was conducted on tissue specimens from 12 patients undergoing brain tumor surgery and diagnosed with either high or low grade gliomas. Samples of histologically uninvolved (“normal”) cerebral cortex and white matter were identified in tissues obtained from 9 patients undergoing surgery for resection of glioma. The study was carried out with approval of the Cedars-Sinai Institutional Review Board. After excision, the specimens were kept in a sealed container and transported from the operating room to the spectroscopy laboratory. The spectroscopic investigations were performed within 30 to 120 min after excision. During the experimental procedure the samples were kept in a glass Petri dish and soaked using 1-2 drops of saline to avoid drying of the tissue. Multiple distinct sites (areas) on the tissue were visually selected for spectroscopic investigation. Based upon the excitation-collection geometry (described below), each investigated area was of about 1.5 mm in diameter. After the completion of the spectroscopic procedure, the selected sites were marked using ink and fixed in 10% buffered formalin, and then sent for histopathological studies. From each sample, appropriately oriented sections (4 mm thick) were then cut from the marked areas. The tissues were embedded in paraffin and stained with hematoxylin-eosin (H&E). The histological sections were evaluated by light microscopy.
3.2. Instrumentation
The tissue brain specimens were investigated with a prototype time-domain time-resolved laser-induced fluorescence spectroscopy apparatus (figure 1) similar with that used in previous studies (13,14). A pulsed nitrogen laser (EG&G, PAR Model 2100; 337 nm, 1.2 ns, 10 Hz) was used as excitation light source. The output of the light source was delivered to the tissue using a custom-made bifurcated probe, which consists of a central excitation fiber (600 μm, numerical aperture 0.11) surrounded by a collection ring of 14 fibers (200 μm, numerical aperture 0.22). The collection fibers are beveled at a 10° angle in order to improve light excitation-collection overlap for small tissue to probe distances (15). The pulse width measured at the tip of the fiber was 2.0 ns full width at half maximum. The collected fluorescence emission was focused into a scanning monochromator (ORIEL, Model 77200) using an F# matcher (ORIEL, Model 77529), and detected by a gated multi-channel plate photomultiplier tube (Hamamatsu Model R2024U, rise time: 0.3 ns) placed at the monochromator exit slit. The photomultiplier tube was gated using a high voltage gate (EG&G, ORTEC; 1 GHz). The photomultiplier output and the entire fluorescent pulse from a single excitation laser pulse was directed to a digital oscilloscope (Tektronics Model TDS 680C, sampling frequency: 5 GSamples/s, bandwidth: 1 GHz) through a fast 1 GHz preamplifier (EG&G, ORTEC Model 9306). The gating of the photomultiplier tube was achieved using an optical switch triggered by laser pulse. A 360 nm long pass filter was placed at the entrance slit of the monochromator and a 345 nm long pass filter was placed in front of the photomultiplier tube to eliminate the scattering of the reflected excitation laser by the sample. A personal computer was used to control data acquisition, data transfer from the oscilloscope, and monochromator wavelength scanning.
Figure 1.
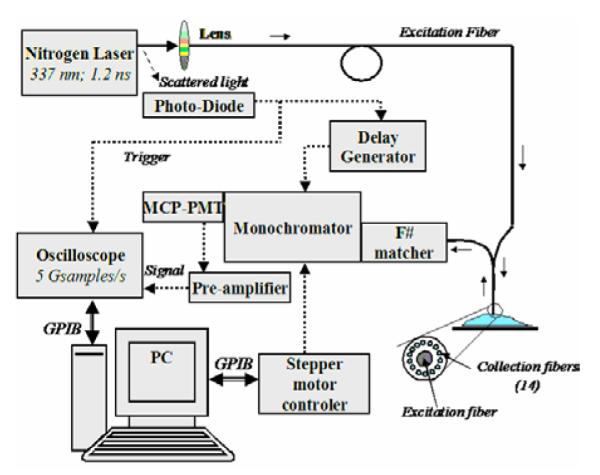
Schematic of the TR-LIFS apparatus.
3.3. Experimental procedure
The fiber optic probe was placed 3 mm above the tissue specimen to optimize the probe light collection efficiency as previously reported (15). Time-resolved emission of each sample was recorded in the 370-500 nm spectral range and scanned at 5 nm intervals. Five consecutive measurements of the fluorescence pulse emission at 390 and 460 nm were performed to assess the reproducibility of the fluorescence lifetime measurement. The energy output of the laser (at the tip of the fiber) for sample excitation was adjusted to 3.0 micro-J/pulse.
3.4. Data analysis
3.4.1. Spectroscopic data processing
The conventional spectral emission or time-integrated fluorescence spectrum was computed from the measured fluorescence pulses by integrating each pulse as a function of time for each investigated wavelength. The constructed fluorescence spectra was corrected for background noise and non-uniform instrumental system response, and then normalized by dividing the florescence intensity at each emission wavelength by the peak fluorescence intensity. The reconstructed spectrum was characterized by discrete intensity values (Ilambda) that describe the variation of fluorescence intensity as a function of wavelength.
The time-resolved fluorescence spectrum or the fluorescence impulse response function (FIRF) was constructed by numerical deconvolution of the measured laser pulse from the measured fluorescence pulse at each wavelength across the spectrum. The deconvolution was based upon Laguerre expansion of kernels technique using five Laguerre functions (16). Deconvolution based on this technique separates the computation of the FIRF from the modeling of the fluorescent system, and therefore facilitates an unconstrained interpretation of time-resolved data from tissue. The dynamic of the fluorescence decay was characterized by two time-dependent parameters: the average lifetime, taulambda, estimated as the interpolated time at which the FIRF decays to 1/e of its maximum value, and the time-decay to 10%, taulambda:10%, estimated as the interpolated time at which the FIRF decays to 10% of its maximum values. All computations were performed using the software package MATLAB® (Mathworks Inc.).
3.4.2. Statistical analysis
To compare the different tissue types based on their fluorescence emission characteristics three sets of spectroscopic parameters were used: the ratio (I390/I460) between the fluorescence intensity at 390 nm and 460 nm, the time-dependent parameters at 390 nm (tau390, tau390:10%), and the time-dependent parameters at 460 nm (tau460, tau460:10%). Statistical analysis was based upon oneway analysis of variance (ANOVA) applied to these spectroscopic parameters. The level of significance used was (P<0.05).
3.4.3. Classification
A stepwise linear discriminant analysis was employed to determine the combination of predictor variables that accounts for most of the differences in the average profiles of each tissue groups (low grade glioma, high grade gliomas without necrosis/treatment effect, high grade gliomas with necrosis/treatment effect, normal white matter, and normal cortex), and to generate a classification model (discriminant functions) for samples classification. The discriminant function analysis not only provides an effective means for classifying spectroscopic data of unknown origin, but also is appropriate when the number of samples is small (17). For this purpose, parameters describing the emission spectra (spectral features: ratios of intensity values, Ilambda) and the fluorescence decay (time-dependent parameters values, taulambda, and taulambda:10%) were used as input predictor variables. These parameters were derived from several emission wavelengths at peak emission (370 nm, 380 nm, 390 nm) and red-shifted spectral range (460 nm, 480 nm, 500 nm). Discriminant functions and classification accuracy were determined for two cases: a) predictor variables selected from only spectral features; b) predictor variables selected from both spectral and time-resolved features. A ‘leave one out’ method was used to create the test/training set. This method employs all sets of spectroscopic data except one, as the training set, and than the excluded set is used as the test set (17). The process is repeated until all data sets are tested. The classification accuracy was determined by computing the specificity and sensitivity as follows: Sensitivity = True positive predictions / Total positive cases; Specificity = True negative predictions / Total negative cases. Linear discriminant analysis was performed with the software package SPSS® (SPSS Inc.)
4. RESULTS
4.1. Histology
Out of a total of 45 sites that underwent spectroscopic analysis, 5 sites were histologically classified as uninvolved normal cerebral cortex, 9 sites as uninvolved normal white matter, 10 sites as low grade glioma (grade I & II), 15 sites as high grade glioma (grade III & IV) and 6 sites as high grade glioma with necrosis and other treatment changes. The cells underlying the areas of laser excitation are not visibly altered post-excitation with well preserved morphology.
4.2. Brain tissue: time-resolved fluorescence
Each tissue type was characterized by distinct time-resolved fluorescence emission spectra. Figure 2 depicts the most representative trends.
Figure 2.

Representative time-resolved fluorescence emission of distinct tissue types: (a) Normal Cortex; (b) Normal White matter; (c) Low Grade Glioma; (d) High Grade Glioma without necrosis. (e) High Grade Glioma with necrotic changes.
4.2.1. Cerebral cortex
The normal cortex was characterized by a broad fluorescence emission spectrum (figure 3a) with well-defined peak between 440 to 460 nm wavelength (I390/I460 = 0.55 ± 0.1) which is consistent with emission of enzyme co-factor NADH (2,9,18,19). Across the entire spectrum, the fluorescence emission was short lasting with an average lifetime (figure 3b) mainly below 1.5 ns (tau390 = 1.27 ± 0.25 ns; tau460= 1.1 ± 0.17 ns) and a decay of the intensity to 10% of its maximum (figure 3c) in less than 4 ns (tau390:10% = 3.8 ± 1.3 ns; tau460:10% = 2.65 ± 0.5 ns).
Figure 3.

Low Grade Glioma vs Normal White and Gray Matter samples. (a) Normalized fluorescence emission spectra; (b) Average fluorescence lifetime; (c) Average interpolated time at which the intensity decays to 10% of its maximum value. Results are given as mean ± standard error of the data from each independent measurement.
4.2.2. Normal white matter
The normal white matter was characterized by a broad fluorescence emission spectrum (figure 3) with two well-defined peaks at 390 and 440 nm wavelength (I390/I440 = 1.41 ± 0.33). The latter peak corresponds to the emission of the enzyme co-factor NADH (2,9,18,19). The fluorescence intensity decay (figures 4a, 4b) was found wavelength-dependent with higher time-decay values in the region of peak fluorescence (tau390 = 2.3 ± 0.7 ns; tau390:10% = 5.7 ± 1.3 ns) when compared with the red-shifted wavelengths (tau460 = 1.8 ± 0.4 ns; tau460:10% = 5.5 ± 1.7 ns).
Figure 4.

High Grade Glioma with and without necrotic changes versus White and Gray Matter. (a) Normalized fluorescence emission spectra; (b) Average fluorescence lifetime; (c) Average interpolated time at which the intensity decays to 10% of its maximum value. Results are given as mean ± standard error of the data from each independent measurement.
4.2.3.Low grade glioma
The time-resolved fluorescence emission of low grade glioma samples showed a relatively narrow broadband emission characterized by a well-defined peak (I390/I460 = 0.49 ± 0.23) at 460 nm wavelength (figure 3a). Across the entire spectrum, the fluorescence emission was short lasting with an average lifetime (figure 3b) mainly below 1.3 ns (tau390 = 1.4 ±0.3 ns; tau460 = 1.15 ± 0.23) and a decay of the intensity to 10% of its maximum (figure 3c) less than 5 ns (tau390:10% = 5.1 ± 1.0 ns; tau460:10% = 3.8 ± 1.1 ns). These trends demonstrated that low grade glioma shows different fluorescence decay dynamics than normal brain tissue.
4.2.4. High grade glioma
High grade glioma demonstrated a relatively narrow fluorescence emission spectrum (figure 4a) with well-defined peak between 440 to 460 nm wavelength (I390/I460 = 0.42 ± 0.23), peak that is also consistent with the emission of enzyme co-factor NADH. Across the entire spectrum, the fluorescence emission was short lasting with an average lifetime (figure 4b) below 1.5 ns (tau390 = 1.4 ±0.13 ns; tau460= 1.3 ± 0.16 ns) and a decay of the intensity to 10% of its maximum (figure 4c) in less than 4.6 ns (tau390:10% = 4.7 ± 0.9 ns; tau460:10% = 3.1 ± 0.8 ns). Unlike low grade glioma, high grade glioma does not show any significant difference in the late long fluorescence decay when compared with normal cerebral cortex.
4.2.5.High grade glioma with necrotic change
Typical time-resolved emission spectrum of high grade glioma with necrosis or with post radiation / treatment changes is very different from the high grade gliomas without necrosis or treatment changes. The emission spectrum (figure 4a) was characterized by a broad wavelength band with two peaks emission. The main peak is centered at about 385-390 nm, the second at about 440nm. Intensity ratio between these regions I390/I460 = 3.3 ± 2.0). The fluorescence lifetime was found wavelength-dependent: longer in the region of main peak emission (tau390 = 2.0 ± 0.35 ns) when compared with the red-shifted wavelengths (tau460 = 1.3 ± 0.2 ns) (figure 4b). A similar trend for the time-dependent parameter, taulambda:10%.(tau390:10% = 7.3 ± 2.2 ns; tau460:10% = 3.9 ± 0.76 ns) was observed (figures 4b, 4c). The late fluorescence at 390 nm of (tau390:10%) is longer that that observed in normal white matter indicating the presence of a different fluorophore than that in white matter.
Note that the attenuation of fluorescence intensity at about 415 nm observed for all tissue types corresponds to hemoglobin absorption band (3,9,10).
4.3. Statistics and Classification
4.3.1. Statistical analysis and tissues comparison
In the 385-390 nm wavelength regions, high grade gliomas with necrosis and normal white matter showed a strong intensity emission when compared with cortex, low grade glioma and high grade gliomas without necrosis/treatment effect. Within the above wavelength range, high grade glioma with necrosis was characterized by a longer-lasting emission than both normal white and cortex as showed by tau390:10% values (figure 4), and at wavelengths above 430 nm exhibited significant lower fluorescence intensity. Normal cortex showed similar fluorescence characteristics to low grade as well as high grade glioma at 460 nm with the exception of a small emission peak at 390 which was greater than observed in low and high grade glioma but lower than seen in normal white matter as well as high grade glioma with necrosis.
4.3.2. Discriminant analysis and classification
Parameters derived from both spectral as well as temporal features provided means of discrimination between the five tissue groups. In cases of low grade glioma, normal cortex and normal white matter, 96.0% of the cases in the training set and 88.0% of the cases in the cross-validated set were correctly classified. In the case of high grade glioma, normal cerebral cortex and normal white matter, 96% of cases in the training set and 93% of cross-validated cases were correctly classified. When high grade glioma with necrosis cases were also included with high grade glioma, normal cortex and normal white matter 94% of the training and 91% of the cross-validated set were classified. Figure 5 shows a two-dimensional scatter plot of discriminant functions, constructed using both spectral and time-resolved features, and the centroids for the three types of tissue. Tables 1 and Table 2 summarize the sensitivity and specificity values for the discrimination of the low grade glioma and high grade glioma from normal brain tissue. The predictor variables that accounted for more than 90% of the variance were the tau460, I390/I440 and I380/I370.
Figure 5.

Results of the linear discriminant function analysis. The Scatterplots show the discriminant score for each group of tissue. (a) Normal tissue vs Low Grade Gliomas; (b) Normal tissue vs high grade gliomas; (c) Normal tissue vs High Grade with necrotic changes. NC = Normal cortex; NWM = Normal white matter; LG = Low grade glioma; HG = High grade glioma; HGN = High grade glioma with necrosis.
Table 1.
Discrimination of low grade glioma from normal brain tissue
| NC N=5 |
NWM N=9 |
LG N=10 |
|
|---|---|---|---|
| Sensitivity (%) | 100 | 77 | 90 |
| Specificity (%) | 85 | 93 | 100 |
NC: normal cortex, NWM: normal white matter, LG: low grade glioma.
Table 2.
Discrimination of high grade glioma (with and without necrosis) from normal brain tissue
| NC N=5 |
NWM N=9 |
HG N=15 |
HGN N=6 |
|
|---|---|---|---|---|
| Sensitivity (%) | 100 | 77 | 100 | 83 |
| Specificity (%) | 96 | 100 | 95 | 100 |
NC: normal cortex, NWM: normal white matte, HG: high grade glioma, HGN: high grade glioma with necrosis
5. DISCUSSION
This study extends our previous report of TR-LIFS in the diagnosis of glioblastoma (13). We previously demonstrated that time-resolved fluorescence spectroscopy is more specific than steady-state fluorescence spectroscopy for the distinction of glioblastoma from cerebral cortex and white matter. In this study, we examine the time-resolved fluorescence emission of low grade glioma, high grade glioma without necrosis, high grade glioma with necrosis, and normal surrounding normal tissue (white matter and cortex) upon 337 nm excitation. We demonstrate that each of these can be distinguished one from the other.
5.1. Time resolved fluorescence spectroscopy in tissue characterization
In this study, we employed a time-resolved fluorescence spectroscopy apparatus allowing for acquisition of fluorescence temporal response across the emission spectrum of tissue specimens, thus both steady-state spectra and time-resolved intensity decay can be recovered from a single measurement sequence. We found that by combining spectroscopic parameters derived from both spectral- and time-domain this approach not only facilitates a better understanding of the kinetics of the biochemical and physiological processes occurring in gliomas, white matter, and cortex but also contributes to improved accuracy of tissue recognition. Although numerous research groups (1,3,4,9-12) have shown that steady-state fluorescence spectroscopy techniques alone are potential tools for diagnosis of tumors, including brain tumors, detection of cancer using only spectral information is subject to several limitations. For example, the relative broad emission brands of tissue fluorescent components may reduce the capability of this technique to resolve the spectrally overlapping components. Also, the presence of endogenous chromophores (hemoglobin) or changes of excitation/collection geometry can strongly influence the acquired spectral profile. Time-resolved measurements can improve the specificity of fluorescence measurements (5-8). This is due to its intrinsic advantages including: 1) biomolecules with overlapping fluorescence emission spectra but with different fluorescence decay times can be discriminated; 2) the measurements are sensitive to various parameters of biological microenvironment (including pH and enzymatic activity); 3) the measurement is independent of fluorescence emission intensity as long as the signal-to-noise ratio is adequate, and consequently independent of the presence of the endogenous chromophores in tissue (hemoglobin) and excitation-collection geometry or optical assembly (5).
Intraoperatively, tissue samples available for neuropathologic analysis are often small as the neurosurgeon is trying to limit injury to normal brain tissue. Routine analysis by light microscopy is also difficult in that infiltrating glioma cells can look remarkably similar to normal cells. Currently, there are no clinically useful methodologies of sufficient robustness and speed that will provide useful adjunctive diagnostic information intraoperatively and preserve the tissue for other assays. At the other end of the spectrum, when surgical tissue is abundant as in a resection, the problem is more of choosing neoplastic tissue rather than normal tissue for frozen section analysis. An adjunctive diagnostic method such as TR-LIFS would be helpful in this regard. Lastly, in a tumor bank setting, TR-LIFS may be helpful in the appropriate classification of tumor versus normal tissue prior to storage. Currently, most tumor bank samples are classified and stored based on a macroscopic or visual evaluation only.
5.2. Fluorescence-based diagnosis of brain tissue
Previous studies have shown that the 1/e optical penetration depth for 337 nm excitation wavelength ranges between 200-250 μm depths (9) in a variety of tissues including in brain tissue. Hence, spectroscopy is a measurement of tissue properties at the surface and immediate sub-surface. Two wavelength ranges appeared important for developing a diagnostic algorithm for distinguishing gliomas from normal brain tissue: 370-400 nm (the region of main peak emission for high grade glioma with necrotic changes and normal white matter) and 440-480 nm (the region of main peak emission for normal cortex as well as low and high grade gliomas). The application of multivariate statistical analysis has shown that different grades of gliomas, normal white matter, and cortex tissues can be differentiated using a relatively limited number of predictor variables (5 in total) from these two spectral ranges. Parameters obtained from both spectral (intensity values) and time-resolved emission contributed to the accuracy of tissue classification. Although in this study, we used only a small database, these results indicates that time-resolved fluorescence spectroscopy technique is robust enough to allow good discrimination between the three types of tissue investigated in this study. Moreover, the use of time-resolved information enhances the ability to discriminate tumor tissue from the surrounding normal tissue. The classification accuracy may be further improved once the number of samples for tumor and normal tissues in the training set increases.
5.3. Fluorescence of gliomas, white matter and cortex: Interpretation in terms of intrinsic fluorescent constituents
The fluorescence intensity time-decay characteristics were found both tissue- and wavelength-dependent. The fluorescence lifetimes, taulambda of high grade glioma with necrosis and normal white matter were longer when compared to cortex and decrease significantly with the emission wavelength. These trends suggest that at least two distinct fluorophores are likely to contribute to the fluorescence emission of high grade glioma with necrosis and normal white matter. Compared to the fluorescence of low grade as well as high grade glioma with normal cortex we see that normal cortex presents a small peak of emission at 390 which is low compared to high grade glioma with necrosis and normal white matter. But, the fluorescence emission of normal cortex is characterized by a short-lived emission with nearly constant lifetime values across the emission spectrum.
The fluorescence of connective tissue proteins, in particular collagens, is most likely to dominate the fluorescence emission of high grade glioma with necrosis / previous treatment and radiation. Several types of collagen and their cross-links are known to absorb light above 300 nm and to exhibit a strong fluorescence emission in the 370-500 spectral range (1,4,5,14). This assumption is supported by our histopathological analysis, which identified fibrous tissue in most of these samples. But these connective tissue proteins do not explain the small emission peak seen only in normal cortex samples, as the lifetime demonstrated is too low for the connective tissue protein.
The short-lived (<1.5ns) fluorescence emission (peak at about 460 nm) found for normal cortex, high grade glioma, and low grade glioma corresponds to the NAD(P)H fluorescence emission spectra. These features are in agreement with previous studies that have reported the spectral (3,9,10,12) as well the lifetime (2,19) fluorescence emission from NAD(P)H. Both forms of NAD(P)H, bound in mitochondria (high quantum yield and radiative lifetimes > 1 ns (2)) as well as free in the cytoplasm (low quantum yield and lifetimes <1 ns (2)), are widely recognized as endogenous fluorophores involved in cellular metabolism (29,18,19), and probably, are the source of fluorescence emission measured from cortex and glioma samples. Also, in the red-shifted spectral range, NAD(P)H fluorescence likely contributed to the fluorescence emission of high grade glioma with necrosis and normal white matter as depicted by the short lifetimes values determined for these tissues at emission wavelengths above 440 nm.
Further investigations are needed for a more complete understanding of the factors of intrinsic fluorophores causing differences in the fluorescence emission properties between normal cortex, high grade glioma, and low grade glioma. Moreover, the metabolic properties of tissue may be different ex-vivo when compared with in-vivo, and these differences can be reflected in tissue fluorescence response (9). In-vivo studies will account for such differences and enable direct comparison with the current ex-vivo studies and better understanding of how metabolic changes affect the fluorescence data. This study, however, demonstrates that time-resolved fluorescence spectroscopy represents a potential method for non-intrusively gaining insights into the biochemical composition of these tissues and thus aid in the pathological diagnosis.
5.4. Time-resolved fluorescence spectroscopy technology: clinical perspective
In this study, we used the autofluorescent properties of tissue as a diagnostic tool. For clinical or intraoperative diagnostic of diseased tissue, such an approach has inherent advantages over the use of exogenous fluorophores (molecular probes). The measurement of endogenous fluorescence does not require any systemic or local administration of an external imaging agent, thus problems associated to toxicity and pharmacodynamics/kinetics of the external agent are not encountered. Because diagnosis based upon autofluorescent properties of the tissue enables a direct and safe evaluation of the TR-LIFS technique in patients, we have recently developed a clinically compatible TR-LIFS apparatus (20). This apparatus has been used successfully intraoperatively intracranially. The unit could also be placed in the frozen section area for use by the pathologist in aiding selection of tissues to freeze and to perform adjunctive analysis. As the area analyzed by the TR-LIFS with each reading is very small, less than 2 mm, and can be adjusted to smaller diameter using a different geometry of the fiber-optic probe, even small biopsy samples could be evaluated. Each reading and interpretation can be done in less than one 1 minute. The tissue subjected to laser excitation is not histologically altered. In addition, if there are histologically undetectable changes, the area of tissue subjected to laser excitation is small and of limited depth. After the optical reading, the tissue can be subjected to standard frozen sections or permanent sections. As ex-vivo time-resolved spectra is likely different than in-vivo intracranial readings, the use of this technology by neurosurgeon and neuropathologist are not necessarily mutually exclusive and may be complementary though further work needs to be done to evaluate this.
The analytical methods employed in this study (Laguerre expansion of kernels and linear discriminant analysis) facilitate near real-time data analysis. In a previous study, we demonstrated the ability of the Laguerre expansion of kernels technique for fast (less than 35 milliseconds per wavelength) deconvolution of the fluorescence impulse function and analysis of biological systems (15). This method allows a direct recovery of the intrinsic properties of a dynamic system from the experimental input-output data (21). The discriminant function analysis, also, has been explored for automated classification of 1H MRS spectra from brain tumors (17). A fast real-time classification algorithm can be developed by assigning a discriminant score for different types of tissue. This discriminant score can then be compared with the acquired fluorescence from the unknown tissue so as to classify the tissue in real-time. The accuracy of classification by linear discriminant analysis can be increased by continuously acquiring samples for training. Although with the current TR-LIFS apparatus, data analysis is conducted off-line, once all the methods are automated, we anticipate that less than 30 seconds will be needed for data collection and analysis, and display of diagnostic information. Such a combination of analytical methods can aid the neuropathological-neurosurgical team with a real time optical biopsy of tissue.
In summary, time-resolved fluorescence spectroscopy is a rapid, non-invasive, non-destructive means of obtaining adjunctive diagnostic information on a tissue sample. Further work is warranted to identify spectral features of other intrinsic brain tumors.
6. ACKNOWLEDGMENT
This work was supported in part by the Whitaker Foundation (RG-01-0346, PI: L. Marcu).
7. REFERENCES
- 1.Wagnieres GA, Star WM, Wilson BC. In vivo fluorescence spectroscopy and imaging for oncological applications. Photochem Photobiol. 1998;68:603–632. [PubMed] [Google Scholar]
- 2.Konig K, Berns MW, Tromberg BJ. Time-resolved and steady-state fluorescence measurements of beta-nicotinamide adenine dinucleotide-alcohol dehydrogenase complex during UVA exposure. J Photochem Photobiol B: Biol. 1997;37:91–95. doi: 10.1016/s1011-1344(96)07327-7. [DOI] [PubMed] [Google Scholar]
- 3.Lin WC, Toms SA, Motamedi M, Jansen ED, Mahadevan-Jansen A. Brain tumor demarcation using optical spectroscopy; an in vitro study. J Biomed Opt. 2000;5:214–220. doi: 10.1117/1.429989. [DOI] [PubMed] [Google Scholar]
- 4.Richards-Kortum R, Sevick-Muraca E. Quantitative optical spectroscopy for tissue diagnosis. Annu Rev Phys Chem. 1996;47:555–606. doi: 10.1146/annurev.physchem.47.1.555. [DOI] [PubMed] [Google Scholar]
- 5.Marcu L, Grundfest WS, Fishbein MC. Time-Resolved Laser-Induced Fluorescnce Spectroscopy for Staging Atherosclerotic Lesions. In: Mycek MA, Pogue B, editors. Handbook of Biomedical Fluorescnce. Marcel Dekker, NY: 2003. pp. 397–430. [Google Scholar]
- 6.Das BB, Liu F, Alfano RR. Time-resolved fluorescence and photon migration studies in biomedical and model random media. Rep Progr Phys. 1997;60:227–292. [Google Scholar]
- 7.Cubeddu R, Comelli D, D’Andrea C, Taroni P, Valentini G. Time-resolved fluorescence imaging in biology and medicine. J Phys D. 2002;35:R61–R76. [Google Scholar]
- 8.Anderson-Engels S, Johansson J, Svanberg K, Svanberg S. Fluorescence Imaging and Point Measurements of Tissue: Applications to the Demarcation of Malignant Tumors and Atherosclerotic Lesions from Normal Tissue. Photochem Photobiol. 1991;53:807–814. doi: 10.1111/j.1751-1097.1991.tb09895.x. [DOI] [PubMed] [Google Scholar]
- 9.Croce AC, Fiorani S, Locatelli D, Nano R, Ceroni M, Tancioni F, Giombelli E, Benericetti E, Bottiroli G. Diagnostic potential of autofluorescence for an assisted intraoperative delineation of glioblastoma resection margins. Photochem Photobiol. 2003;77:309–318. doi: 10.1562/0031-8655(2003)077<0309:dpoafa>2.0.co;2. [DOI] [PubMed] [Google Scholar]
- 10.Chung YG, Schwartz JA, Gardner CM, Sawaya RE, Jacques SL. Diagnostic potential of laser-induced autofluorescence emission in brain tissue. J Korean Med Sci. 1997;12:135–142. doi: 10.3346/jkms.1997.12.2.135. [DOI] [PMC free article] [PubMed] [Google Scholar]
- 11.Poon WS, Schomacker KT, Deutsch TF, Martuza RL. Laser-induced fluorescence: experimental intraoperative delineation of tumor resection margins. J Neurosurg. 1992;76:679–686. doi: 10.3171/jns.1992.76.4.0679. [DOI] [PubMed] [Google Scholar]
- 12.Lin WC, Toms SA, Johnson M, Jansen ED, Mahadevan-Jansen A. In vivo brain tumor demarcation using optical spectroscopy. Photochem Photobiol. 2001;73:396–402. doi: 10.1562/0031-8655(2001)073<0396:ivbtdu>2.0.co;2. [DOI] [PubMed] [Google Scholar]
- 13.Marcu L, Jo JA, Butte PV, Yong WH, Pikul BK, Black KL, Thompson RC. Fluorescence lifetime spectroscopy of glioblastoma multiforme. Photochem Photobiol. 2004;80:98–103. doi: 10.1562/2003-12-09-RA-023.1. [DOI] [PubMed] [Google Scholar]
- 14.Marcu L, Fishbein MC, Maarek JM, Grundfest WS. Discrimination of human coronary artery atherosclerotic lipid-rich lesions by time-resolved laser-induced fluorescence spectroscopy. Arterioscler Thromb Vasc Biol. 2001;21:1244–1250. doi: 10.1161/hq0701.092091. [DOI] [PubMed] [Google Scholar]
- 15.Papaioannou T, Preyer N, Fang Q, Carnohan M, Ross R, Brightwell A, Cottone G, Jones L, Marcu L. Effects of fiber-optic probe design and probe-to-target distance on diffuse reflectance measurements of turbid media: an experimental and computational study at 337 nm. Appl Opt. 2004;43:2846–2860. doi: 10.1364/ao.43.002846. [DOI] [PMC free article] [PubMed] [Google Scholar]
- 16.Jo JA, Fang Q, Papaioannou T, Marcu L. Fast model-free deconvolution of fluorescence decay for analysis of biological systems. J Biomed Opt. 2004;9:743–752. doi: 10.1117/1.1752919. [DOI] [PMC free article] [PubMed] [Google Scholar]
- 17.Tate AR, Griffiths JR, Martinez-Perez I, Moreno A, Barba I, Cabanas ME, Watson D, Alonso J, Bartumeus F, Isamat F, Ferrer I, Vila F, Ferrer E, Capdevila A, Arus C. Towards a method for automated classification of 1H MRS spectra from brain tumours. NMR Biomed. 1998;11:177–191. doi: 10.1002/(sici)1099-1492(199806/08)11:4/5<177::aid-nbm534>3.0.co;2-u. [DOI] [PubMed] [Google Scholar]
- 18.Aubin JE. Autofluorescence of Viable Cultured Mammalian-Cells. J Histochem Cytochem. 1979;27:36–43. doi: 10.1177/27.1.220325. [DOI] [PubMed] [Google Scholar]
- 19.Schneckenburger H, Konig K. Fluorescence Decay Kinetics and Imaging of NAD(P)H and Flavins As Metabolic Indicators. Opt Eng. 1992;31:1447–1451. [Google Scholar]
- 20.Fang Q, Papaioannou T, Jo JA, Vaitha R, Shastry K, Marcu L. Time-domain laser-induced fluorescence spectroscopy apparatus for clinical diagnostics. Rev Sci Instr. 2004;75:151–162. doi: 10.1063/1.1634354. [DOI] [PMC free article] [PubMed] [Google Scholar]
- 21.Marmarelis VZ. Identification of nonlinear biological systems using Laguerre expansions of kernels. Ann Biomed Eng. 1993;21:573–589. doi: 10.1007/BF02368639. [DOI] [PubMed] [Google Scholar]