Abstract
The speed of the surface Rayleigh wave, which is related to the viscoelastic properties of the medium, can be measured by noninvasive and noncontact methods. This technique has been applied in biomedical applications such as detecting skin diseases. Static spherical indentation, which quantifies material elasticity through the relationship between loading force and displacement, has been applied in various areas including a number of biomedical applications. This paper compares the results obtained from these two methods on five gelatin phantoms of different concentrations (5%, 7.5%, 10%, 12.5% and 15%). The concentrations are chosen because the elasticity of such gelatin phantoms is close to that of tissue types such as skin. The results show that both the surface wave method and the static spherical indentation method produce the same values for shear elasticity. For example, the shear elasticities measured by the surface wave method are 1.51, 2.75, 5.34, 6.90 and 8.40 kPa on the five phantoms, respectively. In addition, by studying the dispersion curve of the surface wave speed, shear viscosity can be extracted. The measured shear viscosities are 0.00, 0.00, 0.13, 0.39 and 1.22 Pa·s on the five phantoms, respectively. The results also show that the shear elasticity of the gelatin phantoms increases linearly with their prepared concentrations. The linear regressions between concentration and shear elasticity have R2 values larger than 0.98 for both methods.
Keywords: surface wave, indentation, viscoelasticity, gelatin phantom
I. INTRODUCTION
Viscoelastic properties of soft tissue have generated considerable interest in medicine due to their clinical relevance to establishing the existence and quantifying the severity of diseases such as cancer [1],[2] and systemic sclerosis (SSc) [3], as well as monitoring and understanding physiological processes such as aging [4],[5]. Therefore, tissue electrography has been actively researched in recent years and a number of technological advancements have been achieved. Methods such as Magnetic Resonance Elastography (MRE) [6],[7], Vibro-acoustography [8],[9] and Optical Coherence Elastography (OCE) [10],[11], excite a tissue by a vibrating source of frequency under 1000 Hz and the shear wave propagating inside the tissue is monitored by Magnetic Resonance (MR), ultrasound or optical methods, respectively. More recently, ultrasound probes with dedicated emission and reception electronics for each channel and parallelized signal processing algorithms are applied to elastography, which enable the visualization of tissue elasticity in real time [12],[13].
The aforementioned methods require monitoring the shear wave propagation inside the tissue sample. On the other hand, since the discovery of the surface Rayleigh wave [14], surface waves have been applied extensively in various engineering areas as well as biomedical applications, such as the skin [15–18], lung [19] and artery [20]. The surface wave can only propagate on the surface of a medium, whereas the shear wave propagates inside a medium. Therefore, one of the advantages of the surface wave method is that it can be measured by noninvasive and noncontact methods. For example, laser vibrometry can be used to monitor the propagation of surface wave on soft tissue [15]. However, because the optical scattering coefficient of the biological tissues is usually one order of magnitude higher than their absorption coefficient [21], optical methods may suffer from the phase distortion cause by the diffuse reflectance. One viable alternative is to use an ultrasound linear array, which can measure multiple lines simultaneously. This not only can identify the surface motion easily but also can notably decrease the amount of time required to perform the test, eliminating the need for synchronizations between measurements.
Mechanical indentation has been developed to quantify material viscoelastic properties for biomedical applications by analyzing the load-displacement curves [22–30]. In fact, the widely practiced modified Rodnan skin test in diagnosing SSc is a form of static indentation, although a relative score instead of the absolute value of the skin elasticity is produced from the test [31]. Indenters of many different shapes have been studied. Among them, the most often used are flat-top [22–24] and sphere-top indenters [22],[23],[25],[26]. Spherical indentation is less sensitive to the surface flatness of the sample and introduces less risk of damaging the tissue than the flat-top indentation [27], although the displacement-load relationship is intrinsically nonlinear because the contact area changes with the indentation depth. A static indentation test assumes that the loading force has ignorable dependence on time, which is generally true for highly elastic materials such as gelatin.
Researcher have widely used viscoelastic phantoms to simulate biological tissues [32–39]. The advantage of phantoms over tissues is that they can be conveniently made and handled. Both homogenous and heterogeneous phantoms can be developed with careful process control. Different materials have been explored for fabricating tissue-mimicking phantoms. Two of the most commonly used background materials are gelatin [16],[17],[40–42] mixed with agar [34],[35]. Because the material properties of gelatin are much simpler than those of tissue, gelatin is widely used as a tissue-mimicking material for testing and developing techniques that are aimed for clinical applications. For gelatin phantoms, parameters such as compression wave speed, density and Poisson’s ratio match those of real tissue samples [32]. The ultrasound compression wave speed in soft tissue is in the range of 1560–1600 m/s [43] and the in gelatin it is around 1540 m/s [32]. Mass density is around 1000 Kg/m3 and Poisson’s ratio is close to 0.5 for both soft tissue and gelatin because of their large proportion of water. However, the viscosity of the gelatin based phantoms is generally small (under 2 Pa·s) compared to real tissues [40] and their elasticity is sensitive to their preparation procedures as well as the testing conditions, such as ambient temperature [34–36]. For characterizing the phantom properties, a number of methods have been applied. For example, a compression device can be used to measure a phantom’s elasticity [33]. A tensile test is validated with an ultrasound method [36]. A R2 = 0.93 linear correlation coefficient is found between the elasticity measurements obtained from both the magnetic resonance elastography and the ultrasound transient elastography [37].
In this study, both the surface wave method and the static spherical indentation are used to measure the mechanical properties of gelatin phantoms of different concentrations. The purpose is to compare the two techniques as well as to find the relationship between the mechanical properties of the gelatin phantoms and their concentrations. In a previous study [33], Young’s modulus is reported roughly proportional to the square of the gelatin concentration for agar/gelatin phantoms. However, no reported results are found in literature on pure gelatin phantoms to the best knowledge of the authors. Elastic properties of gelatin phantoms of different concentrations were studied by using a Dynamic Mechanical Analyzer (DMA) to measure both the shear modulus and Young’s modulus [39]. The shear modulus was measured by the shear testing on cubic phantoms. The Young’s modulus was measured by the compression tests on cylindrical phantoms. The results are shown in Table (1). One can see that the mechanical testing results are not consistent for all concentrations, which can be explained by the fact that the mechanical testing is sensitive to the size of the phantom, the boundary conditions and the clapping and holding of the phantoms and etc.
Table 1.
Gelatin phantom elasticity obtained from dynamic mechanical analyzer testing.
| Gelatin concentration (%) | Young’s modulus (kPa) | Shear Modulus (kPa) |
|---|---|---|
| 5.0 | 36.7 | 4.9 |
| 7.5 | 65.8 | 13.8 |
| 10.0 | 36.6 | 13.1 |
| 12.5 | 41.0 | 11.5 |
| 15.0 | 111.5 | 36.7 |
This paper is divided into the following sections. In section II, the theoretical foundations of both the surface wave method and the indentation method are introduced. Details about the experiments are in section III and the results and their discussions are included in section IV and V, respectively. The conclusions are drawn in section VI.
II. THEORY
1. Surface Rayleigh wave propagation
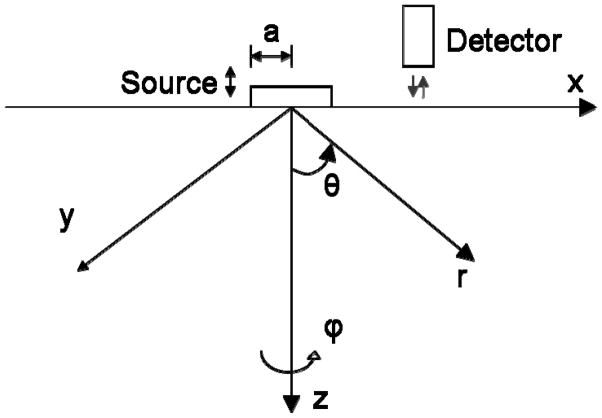
Figure (1) shows the setup for the surface wave generation and detection. The governing equation for the wave propagation in an isotropic, homogeneous and infinite medium is [44],
Figure 1.
The generation and detection of the surface wave. A circular vibrating source of radius a is acting on the surface of the sample material. A detector monitors the wave along the propagation axis. Both a Cartesian coordinate system (x, y, z) and a cylindrical coordinate system (θ, ϕ, r) are indicated in the figure.
| (1) |
where u is the displacement vector, λ and μ are, the Lamé constants of the medium and ρ is the mass density. Equation (1) has been solved in a cylindrical polar coordinate system [44] and for the surface Rayleigh wave, the relationship between wave velocity cs and μ can be expressed as [15],
| (2) |
where c2 is the shear wave velocity. Equation (2) holds as long as the Poisson’s ratio ν of the material is close to 0.5, which is generally true for incompressible materials like soft tissues.
A Voigt’s model, which consists of a spring and a dashpot connecting in parallel, can be used to simulate the linear viscoelastic behavior of tissue [45]. For the Voigt’s model, the wave speed dispersion frequency range under 1000 Hz can be formulated as a function of shear elasticity μ1, shear viscosity μ2 and the angular frequency of the excitation source ω, as show in Equation (3) [40],[42],
| (3) |
2. Static spherical indentation
a. Hayes Model
For a spherical indenter of radius r acting on an elastic material as shown in Figure (2), the relationship between the indenter center displacement d0 and load L can be described by the following series of equations [22],[23],
Figure 2.
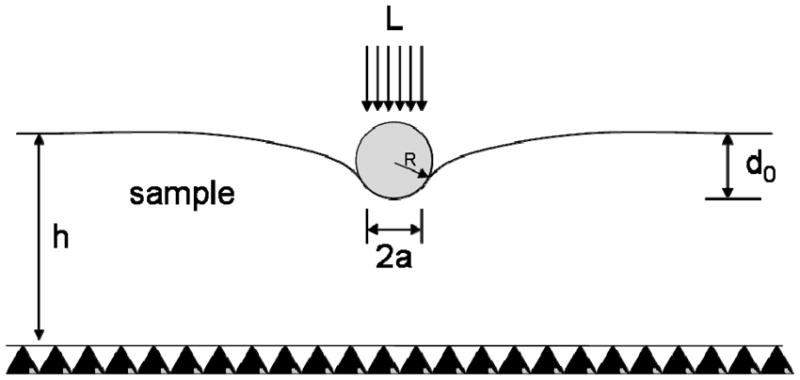
Sketch of a spherical indentation test. L is the load, d0 is the indenter center displacement, a is the contact radius, h is the sample thickness and R is the indenter radius.
| (4) |
| (5) |
| (6) |
| (7) |
| (8) |
| (9) |
| (10) |
In Equations (4–10), a is the contact radius between the indenter and sample surface. k is a correction factor for L-d0 function and it is a function of a/h and Poisson’s ratio ν, where h is the thickness of the sample. As the indenter displacement d0 changes, a also changes. The value of k, therefore, varies with d0. Equations (7–8) are Fredholm integral equations of second kind and can be solved numerically by techniques described in [46]. Details of the derivation of Equation (4–10) are discussed in [22],[23].
The procedure for calculating the elasticity μ1 from a known L-d0 curve is described as follows:
For a series of contact radius a, d1(ξ) and d2(ξ) can be solved by Equations (7–8). Then the values of χ and indenter displacement d0 can be calculated by Equation (10) and the correction factor k can be calculated by Equation (5–6). This way a lookup table of a-d0-k values is obtained.
For a series indenter displacement d0, their corresponding contact radius a and correction factor k can be evaluated by interpolating the tabular values.
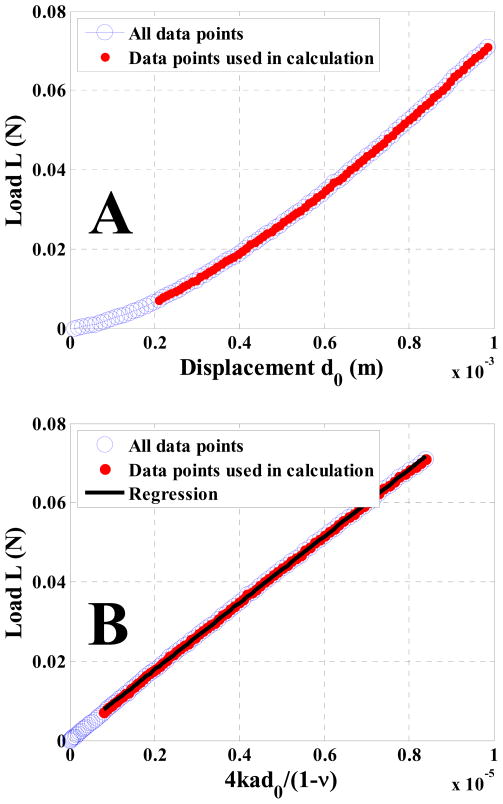
The elasticity μ1 is calculated by a linear regression between L and (4ad0k)/(1-ν) based on Equation (4).
b. Finite Element (FE) validation
The classic Hayes model described by Equations (4–10) has been applied in a number of applications, such as measuring the elasticity of a thin-layer material [47], studying the nonlinearity indentation test [48], and estimating the elasticity of cartilage [49]. To further characterize the performance of this model and to validate the implementation of the algorithms, a series of FE simulations have been carried out in COMSOL MULTIPHYSICS® (version 3.5a, COMSOL, Inc., 1 New England Executive Park, Suite 350, Burlington, MA 01803). From a simulated load-displacement curve, the elasticity μ1 can be estimated. Table (2) lists the parameters and results of the FE simulations. One can see that the model fits the simulated data sets quite well and the maximum absolute error of μ1 estimations is only 1.5%.
Table 2.
Parameters and results of finite element simulations of the static spherical indentation.
| R (mm) | ν | ρ (kg/m3) | True μ1 (kPa) | h (mm) | μ1 Estimate (kPa) | Error % |
|---|---|---|---|---|---|---|
| 5 | 0.4999 | 1000 | 2.0 | 100 | 2.03 | +1.50 |
| 50 | 2.01 | +0.50 | ||||
| 20 | 1.98 | −1.00 | ||||
| 10 | 1.97 | −1.50 |
III. EXPERIMENT
1. Phantom preparation
Five gelatin phantoms of different concentrations are prepared with porcine skin gelatin powder (Type G2500, Sigma-Aldrich Corporation, 3050 Spruce St. St. Louis, MO 63103). The concentrations are 5.0%, 7.5%, 10.0%, 12.5% and 15.0%, all calculated by volume. From the authors’ experience, gelatin phantoms in this concentration range resemble soft tissue types such as skin. In addition, gelatin phantoms with concentration smaller than 5% or larger than 15% seem difficult to maintain uniformity. 10% glycerol (Type G7757, Glycerol Reagent Plus, Sigma-Aldrich Corporation) by volume is added to increase the stiffness of the phantoms. 1 g/L of scatterers with mean diameter of 20 μm (Type S3504, Sigma-Aldrich Corporation) are embedded to improve the Radio Frequency (RF) echoes of the ultrasound measurements. The size and the material of the scatterers are selected so that the scatterers maintain uniformly suspended in the gelatin solution during the curing process. 5g/L of potassium sorbate (Type 359769, Sigma-Aldrich Corporation) is added as an antibacterial preservative.
The procedure for making these phantoms is described as follows. The gelatin, scatterers and potassium sorbate are mixed with water in room temperature. Then they are heated and the glycerol is added. The content is constantly stirred until the solids are completely dissolved. When the temperature reaches 60 °C, heat is removed and the content is placed in a vacuum chamber (Type RE2, BrandTech Scientific, Inc., 11 Bokum Rd. Essex, CT 06426-1506) to remove air bubbles. Then it is poured into a container and kept in 4 °C overnight. The final phantom measures 14×14×4.5 cm3. The size of the phantom is chosen so that the generated waves do not interfere with the reflected waves. The dimensions are used according to the testing experience that pure surface wave can be generated and detected. The same size is used for each concentration, so that the size effect, if there is any, can be minimized. Before experiments are conducted, the temperature of the phantoms is equilibrated using room temperature, which is set at 25 °C.
2. Surface wave measurement
Figure (3) shows the setup for the surface wave experiment. Sinusoidal waves of duration 100 ms are generated by a function generator (Model 33120A, Agilent, 5301 Stevens Creek Blvd, Santa Clara, CA 95051) and amplified by an audio amplifier (Model D150A, Crown Audio, Inc. 1718 W. Mishawaka RD, Elkhart, IN 46517). The duration of the sinusoidal waves is selected so that it is long enough to be detected as a plane wave and short enough to differentiate the forward travelling waves from the reflections. The frequency of the source is 100–400 Hz with 50 Hz separations. The amplified signal drives an electromagnetic (EM) shaker (Model 203, LDS test and measurements, Heath works, Baldock RD, Royston, Herts, SG8 5BQ, UK), which applies a cyclic force to the phantom surface by a cylindrical bar that is 2 cm long and 5 mm in diameter. The generated surface waves are detected by an ultrasound system (Model SonixRP, Ultrasonix Corporation, 130 - 4311 Viking Way, Richmond, BC, Canada, V6V 2K9) with a 9.5 MHz probe (Model L14-5/38, Ultrasonix Corporation). The excitation and data collection are coordinated and automated by a customized software package written in C++. The phantom is submerged in water while the experiment is being conducted.
Figure 3.
Setup for the surface wave experiments. An electromagnetic shaker is driven by a sinusoidal input voltage while a cylindrical bar mounted on the tip of the shaker is in touch with the phantom surface. The generated surface waves are detected by a 9.5 MHz ultrasound probe.
For each excitation frequency f, 7 lines are collected and the spatial separation between the two adjacent lines is 0.9 mm. Therefore, a total distance of 5.4 mm is covered. The frame rate of the ultrasound measurement is 2900 Hz. The phase of the propagating wave at each line is calculated with a cross-spectrum method. The cross-spectrum S(f) of two signals s1(t) and s2(t) is defined as [47–49],
| (11) |
where S1(f) and S2(f) are the Fourier transforms of s1(t) and s2(t), respectively; * denotes the complex conjugate and θ(f) is the phase delay between s1(t) and s2(t) at frequency f.
Ideally, the phase of the surface wave θ at a particular frequency has a linear relationship with the distance l,
| (12) |
So the surface wave speed cs can be calculated by,
| (13) |
3. Indentation measurement
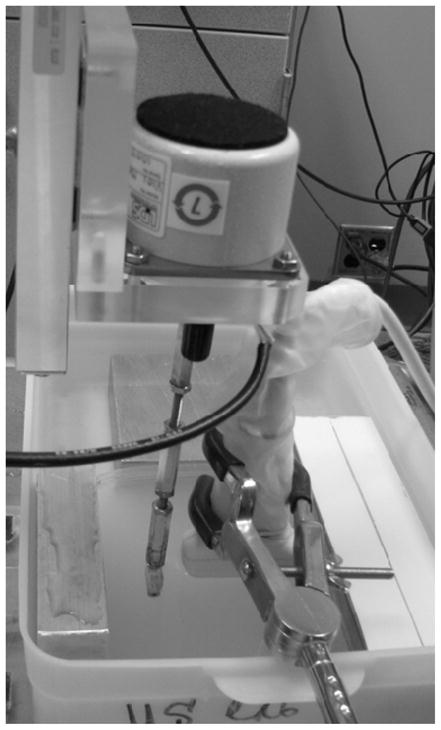
Although there are commercially available indentation devices, in order to study the effects of different conditions and adjust a wide range of parameters, a customized indentation device was built. As Figure (4) shows, a load cell (Model ULC-1N, Interface Inc., 7401 East Butherus Drive Scottsdale, Arizona 85260) is mounted on a linear translator (Model A2506Q1-S2.5, Velmex Inc. 7550 State Route 5 and 20, Bloomfield, NY 14469). The two indenters tested have radii of 2.4 mm and 4.1 mm, respectively. Loading force is displayed on a digital readout unit (Model DP25B, Omega Engineering, Inc., One Omega Drive, Box 4047, Stamford, CT 06907). The indentation and readout are done manually by the operator. The step size of the indentation is 10 μm and 100 steps are conducted for each test, making the total displacement 1 mm. A linear regression is used to calculate the shear elasticity μ1 based on Equation (4). Note that since the load L does not vary linearly with indenter displacement d0, a different contact radius a and a different correction factor k should be calculated for each indentation step, as mentioned in section II.2.
Figure 4.
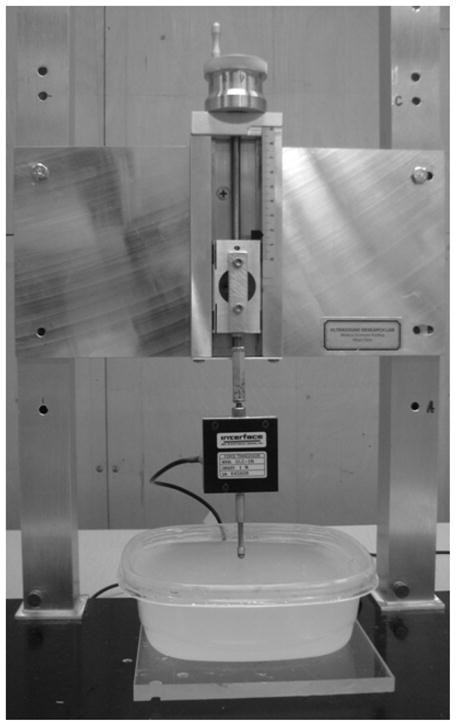
Setup for the static spherical indentation experiments. A linear translator manually moves the load cell and indenter assembly in the vertical indirection. Loading force is displayed on a digital readout unit (not shown in the figure).
IV. RESULTS
1. Surface wave experiment
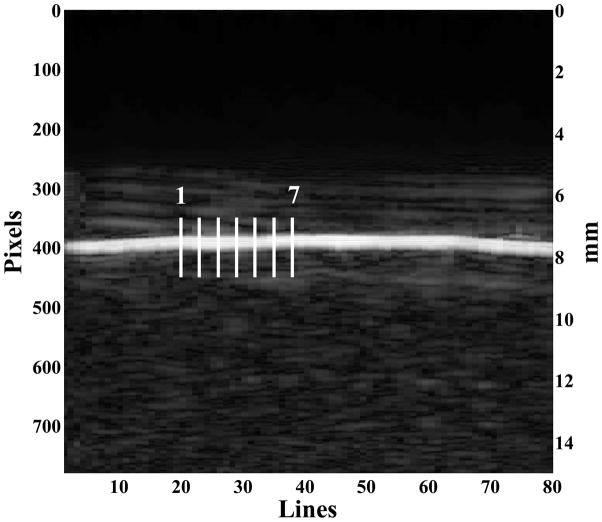
Figure (5) shows a B-mode image of the 15% phantom. In the image, the brightest horizontal line is the water-phantom interface. The image also shows the lines that are used for estimating the surface wave speed. B-mode images on all other phantoms are similar to Figure (5).
Figure 5.
A B-mode ultrasound image of the 15% phantom. On the image, the bright line is the surface of the phantom. The vertical bars indicate the lines where ultrasound echoes are tracked for analyzing the surface motion of the phantom.
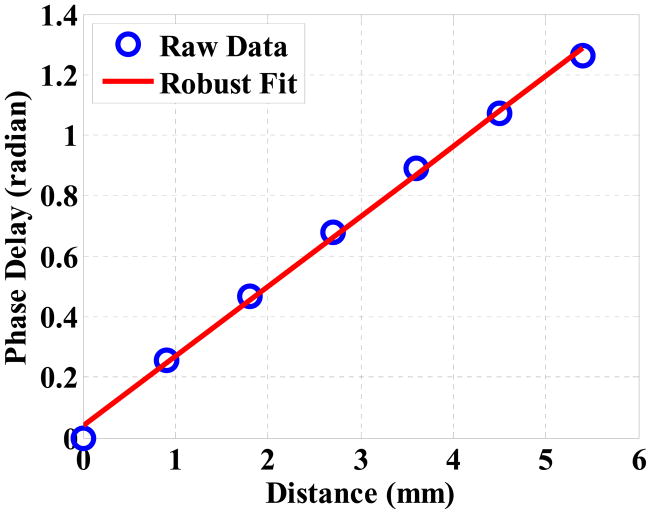
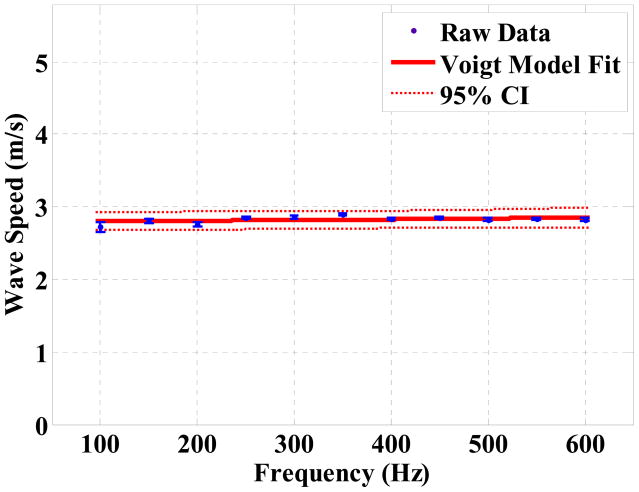
Figure (6) shows the phase delays of the 7 lines relative to the first line as a function of the distance for the 15% Gelatin phantom at 100 Hz. The phase delays are estimated with respect to the first line by evaluating Equation (11). One can see that the data points indicate a strong linear correlation (R2 = 0.98). The wave speed at each excitation frequency is then calculated based on Equation (13) and the dispersion curve is fitted with the Voigt model defined by Equation (3), as shown in Figure (7).
Figure 6.
The phase delay as a function of the distance and their robust linear regression. The source is 100 Hz and the gelatin concentration of the phantom is 15%. The robust linear regression results in Y = 0.23196X − 0.035197 with a 95% confidence. The wave speed is, therefore, 2.72 ± 0.07 m/s in the mean ± standard error format.
Figure 7.
The Voigt model is fitted for the wave speed dispersion data set from the 15% phantom. The error bars indicate the standard errors of the surface wave speed at each frequency. By a nonlinear fitting, the elasticity μ1 = 8.40 ± 0.59 kPa and viscosity μ2 = 1.22 ± 0.78 Pa·s in the mean ± standard error format. 95% confidence interval of the prediction is indicated in the figure (dotted region).
2. Indentation experiment
A raw data set of displacement-load measurement collected on the 15% gelatin phantom with the 2.4 mm radius indenter is plotted in Figure (8A). Note that this curve is not linear since the contact radius changes with indenter displacement for spherical indentations. It is linearized by the method described in section II.2. In Figure (8B), the slope of the linear regression estimates the phantom elasticity μ1. Note that not every point in the raw data set is used in the calculation because the force is small (<0.01 Newton) at the beginning of the indentation process.
Figure 8.
Indentation raw data set (A) and processed data points for calculating elasticity (B) for the 15% Gelatin phantom with a R = 2.4 mm indenter. Note that due to the spherical shape of the indenter, the displacement-load curve is nonlinear in (A). In (B), the slope term of the linear regression estimates the material elasticity μ1. In this figure, μ1 = 8.42 ± 0.03 kPa in the mean ± standard error format.
V. DISCUSSIONS
1. Phantom elasticity as a function of Gelatin concentration
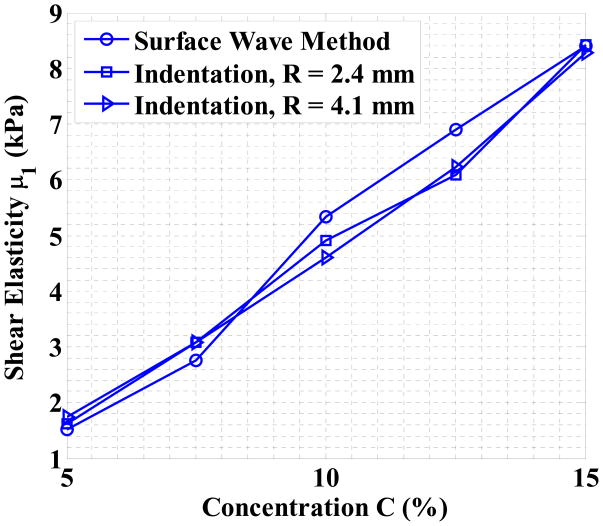
Table (3) lists the viscoelasticity estimations calculated by both the surface wave method and the static spherical indentation method. One can see that both methods result in similar values for μ1 and the results are consistent and independent from the indenter size. Larger relative differences in elasticity measurements are produced in low concentration phantoms because the longer wavelength in softer phantoms increases the error of phase delay calculations in the surface wave method and a softer phantom has smaller force measurements in the indentation tests. The largest relative difference between both methods is 15.89%, which occurs for the 5% phantom and the 4.1 mm indenter. The elasticity of the 5% and the 7.5% phantom are about 1.5 and 2.7 kPa, which are close to the elasticity of the brain tissues of younger (1.7 kPa) and older (3.3 kPa) rats [50]. The elasticity of the 15% phantom is 8.5 kPa, which is in the range of normal human skin (7–10 kPa) [51]. For gelatin phantoms under low frequency (< 1000 Hz) excitations, the shear wave and the Rayleigh wave speeds are in the range of 1–3 m/s, which is much lower than the shear wave speed measured in mammalian tissues at 2–14 MHz (9–100 m/s) [52]. Viscosity estimations from the surface wave method confirm that the gelatin phantoms have small viscosities under 2 Pa·s, which is consistent with the findings in literatures such as [40].
Table 3.
Summary of viscoelasticity obtained from both the surface wave method and the static spherical indentation. The results are organized in the mean ± standard error format.
| Phantom Concentration (%) | Surface Wave | Indentation (μ1 only, kPa) | μ1 Δ% | |||
|---|---|---|---|---|---|---|
| μ1 (kPa) | μ2 (pa·s) | R = 2.4 mm | R = 4.1 mm | R = 2.4 mm | R = 4.1 mm | |
| 5.0 | 1.51±0.10 | 0.00±0.00 | 1.62±0.01 | 1.75±0.01 | 7.28 | 15.89 |
| 7.5 | 2.75±0.12 | 0.00±0.00 | 3.08±0.01 | 3.09±0.01 | 12.00 | 12.36 |
| 10.0 | 5.34±0.48 | 0.13±0.50 | 4.91±0.02 | 4.60±0.02 | −8.05 | −13.86 |
| 12.5 | 6.90±0.35 | 0.39±1.15 | 6.08±0.02 | 6.23±0.03 | −11.88 | −9.71 |
| 15.0 | 8.40±0.59 | 1.22±0.78 | 8.42±0.03 | 8.28±0.04 | 0.24 | −1.43 |
Figure (9) plots the elasticity estimations by both methods. One can see that the concentration C and elasticity μ1 have a strong linear correlation (R2 > 0.98 for all three tests). The regression results between the two variables are listed in Table (4). In the previous studies such as [33], Young’s modulus is reported roughly proportional to the square of the gelatin concentration for agar/gelatin phantoms. However, the results in Figure (9) and Table (4) suggest that for pure gelatin phantoms, the relation between the elasticity and concentration should be linear. This finding may simplify the protocol for making gelatin phantoms, especially when multiple phantoms with equally spaced elasticities are to be studied.
Figure 9.
The elasticity μ1 estimations as a function of gelatin concentration C for both the surface wave method and the indentation method. The values of the data points are listed in Table (3).
Table 4.
The regression between elasticity μ1 and concentration C for model μ1 = AC + B.
| A | B | R2 | |
|---|---|---|---|
| Surface Wave Method | 0.717 | −2.192 | 0.9884 |
| Indentation, R = 2.4 mm | 0.664 | −1.818 | 0.9904 |
| Indentation, R = 4.1 mm | 0.648 | −1.690 | 0.9933 |
2. The influence of viscosity on the indentation results
The static indentation tests conducted in this paper do not consider the time dependency of the loading force. Therefore, unlike the surface wave method, viscosity is not solved. The influence of viscosity on the accuracy of the discussed static indentation method depends on the ratio of μ1 and μ2, as well as the indenter moving speed. Increasing the indenter speed would decrease the impact of relaxation on the measurements. Because of the noises introduced from both the surrounding vibrations and the electronics, the output of the load cell is averaged in time to produce stable readings. It is estimated that there is a 2-second averaging time before the reading stabilizes after each indenter movement. The indentation speed can be increased by shortening this averaging time, which may require a more robust design in the frame of the indentation device and electronics with an improved signal to noise ratio.
With some modifications of the current indentation setup, the relaxation and creep processes may be measured. In addition, there are commercially available instrumented indentation devices that can perform such dynamic tests. A number of models have been proposed to describe the relaxation and creep response of the spherical indentation on viscoelastic materials [25],[26],[53]. By adopting these models, not only the elastic but also the viscous properties, such as relaxation time constants, can be solved.
3. Voigt Model and Hayes Model
The Voigt model is widely used for evaluating viscoelastic properties of tissue [40],[41],[54],[55]. The dynamic property of tissue can be evaluated with the Voigt model. Other models such as the Maxwell model, which consists of a spring and dashpot connected in a series, have also been applied in measuring the viscoelasticity of tissue. The advantage of both the Voigt and the Maxwell models is that they only have two components and the elasticity and viscosity obtained from these two models are conveniently interpreted in clinical applications. However, the Maxwell model seems to have difficulty in predicting the viscosity and the wave attenuation [56].
The indentation with the Hayes model is also widely used in evaluating the elasticity of a material [47–49]. The static property of the material is evaluated with the Hayes model. The advantage of Hayes model is that it is the exact solution of spherical indentation which takes account of the sample thickness. If the thickness of the sample is much larger than the size of the indenter (h/R>20), a much simplified closed-form solution may be applied [25],
| (14) |
Although direct comparison of the Voigt model and the Hayes model is not possible, indirect comparison of the two models on elasticity of tissue is feasible.
VI. CONCLUSIONS
Five Gelatin phantoms of different concentrations are prepared and measured under the same conditions by both a surface wave method and a static spherical indentation method. The elasticity results are cross validated by both approaches. The surface wave method can also solve the viscosity if the speed of surface Rayleigh wave is measured at multiple excitation frequencies. The results also suggest that the elasticity of the gelatin phantoms increases linearly with their concentrations.
Acknowledgments
The authors would like to thank Randall Kinnick for his enormous help in hardware development, Carolina Amador Carrascal for her insightful discussions about indentation and Scott Mitchell for his expert inputs on FE modeling. The authors would also like to extend their appreciation to Jennifer Milliken for her secretarial assistance. This study is supported by grant EB02167 from the National Institutes of Health and a research career development award by Mayo Clinic.
Footnotes
Publisher's Disclaimer: This is a PDF file of an unedited manuscript that has been accepted for publication. As a service to our customers we are providing this early version of the manuscript. The manuscript will undergo copyediting, typesetting, and review of the resulting proof before it is published in its final citable form. Please note that during the production process errors may be discovered which could affect the content, and all legal disclaimers that apply to the journal pertain.
References
- 1.Greenleaf JF, Fatemi M, Insana M. Selected Methods for Imaging Elastic Properties of Biological Tissues. Annual Review of Biomedical Engineering. 2003;5:57–78. doi: 10.1146/annurev.bioeng.5.040202.121623. [DOI] [PubMed] [Google Scholar]
- 2.Qiu Y, Sridhar M, Tsou JK, Lindfors KK, Insana MF. Ultrasonic viscoelasticity imaging of nonpalpable breast tumors: preliminary results. Academic Radiology. 2008 Dec;15:1526–1533. doi: 10.1016/j.acra.2008.05.023. [DOI] [PMC free article] [PubMed] [Google Scholar]
- 3.Dobrev HP. In vivo study of skin mechanical properties in patients with systemic sclerosis. Journal of the American Academy of Dermatology. 1999 Mar;40:436–442. doi: 10.1016/s0190-9622(99)70494-9. [DOI] [PubMed] [Google Scholar]
- 4.Flynn C, McCormack BAO. Simulating the wrinkling and aging of skin with a multi-layer finite element model. Journal of Biomechanics. 2010 Feb;43:442–448. doi: 10.1016/j.jbiomech.2009.10.007. [DOI] [PubMed] [Google Scholar]
- 5.Sack I, Beierbach B, Wuerfel J, Klatt D, Hamhaber U, Papazoglou S, Martus P, Braun J. The impact of aging and gender on brain viscoelasticity. NeuroImage. 2009 Jul;46:652–657. doi: 10.1016/j.neuroimage.2009.02.040. [DOI] [PubMed] [Google Scholar]
- 6.Huwart L, van Beers BE. MR elastography. Gastroentérologie Clinique Et Biologique. 2008 Sep;32:68–72. doi: 10.1016/S0399-8320(08)73995-2. [DOI] [PubMed] [Google Scholar]
- 7.Muthupillai R, Ehman RL. Magnetic resonance elastography. Nature Medicine. 1996 May;2:601–603. doi: 10.1038/nm0596-601. [DOI] [PubMed] [Google Scholar]
- 8.Fatemi M, Greenleaf JF. Vibro-acoustography: An imaging modality based on ultrasound-stimulated acoustic emission. Proceedings of the National Academy of Sciences of the United States of America. 1999 Jun;96:6603–6608. doi: 10.1073/pnas.96.12.6603. [DOI] [PMC free article] [PubMed] [Google Scholar]
- 9.Fatemi M, Greenleaf JF. Ultrasound-stimulated vibro-acoustic spectrography. Science (New York, NY) 1998 Apr;280:82–85. doi: 10.1126/science.280.5360.82. [DOI] [PubMed] [Google Scholar]
- 10.Kennedy BF, Hillman TR, McLaughlin RA, Quirk BC, Sampson DD. In vivo dynamic optical coherence elastography using a ring actuator. Optics Express. 2009 Nov;17:21762–21772. doi: 10.1364/OE.17.021762. [DOI] [PubMed] [Google Scholar]
- 11.Schmitt J. OCT elastography: imaging microscopic deformation and strain of tissue. Optics Express. 1998 Sep;3:199–211. doi: 10.1364/oe.3.000199. [DOI] [PubMed] [Google Scholar]
- 12.Bercoff J, Tanter M, Fink M. Supersonic shear imaging: a new technique for soft tissue elasticity mapping. IEEE Transactions on Ultrasonics Ferroelectrics and Frequency Control. 2004;51:396–409. doi: 10.1109/tuffc.2004.1295425. [DOI] [PubMed] [Google Scholar]
- 13.Tanter M, Bercoff J, Athanasiou A, Deffieux T, Gennisson J, Montaldo G, Muller M, Tardivon A, Fink M. Quantitative Assessment of Breast Lesion Viscoelasticity: Initial Clinical Results Using Supersonic Shear Imaging. Ultrasound in Medicine & Biology. 2008 Sep;34:1373–1386. doi: 10.1016/j.ultrasmedbio.2008.02.002. [DOI] [PubMed] [Google Scholar]
- 14.Rayleigh L. On waves propagated along the plane surface of an elastic solid. Proceedings of the London Mathematical Society. 1885;1:4. [Google Scholar]
- 15.Zhang X, Greenleaf JF. Estimation of tissue’s elasticity with surface wave speed. The Journal of the Acoustical Society of America. 2007 Nov;122:2522–2525. doi: 10.1121/1.2785045. [DOI] [PubMed] [Google Scholar]
- 16.Qiang B, Zhang X, Greenleaf J. Estimation of skin elasticity by measuring surface wave velocity under impulse stimulus using compact optical sensors. Ultrasonics Symposium, IEEE. 2009:51–52. [Google Scholar]
- 17.Brum J, Catheline S, Benech N, Negreira C. Shear elasticity estimation from surface wave: the time reversal approach. The Journal of the Acoustical Society of America. 2008 Dec;124:3377–3380. doi: 10.1121/1.2998769. [DOI] [PubMed] [Google Scholar]
- 18.Weigel R, Holm A, Russer P, Ruile W, Solkner G. Accurate optical measurement of surface acoustic wave phase velocity. Ultrasonics Symposium, IEEE. 1993:319–322. [Google Scholar]
- 19.Jahed M, Lai-Fook SJ. Stress wave velocity measured in intact pig lungs with cross-spectral analysis. Journal of Applied Physiology. 1994;76:565. doi: 10.1152/jappl.1994.76.2.565. [DOI] [PubMed] [Google Scholar]
- 20.Zhang X, Greenleaf JF. Noninvasive generation and measurement of propagating waves in arterial walls. The Journal of the Acoustical Society of America. 2006;119:1238. doi: 10.1121/1.2159294. [DOI] [PubMed] [Google Scholar]
- 21.Schmitt JM, Kumar G. Optical Scattering Properties of Soft Tissue: A Discrete Particle Model. Applied Optics. 1998 May;37:2788–2797. doi: 10.1364/ao.37.002788. [DOI] [PubMed] [Google Scholar]
- 22.Hayes WC, Keer LM, Herrmann G, Mockros LF. A mathematical analysis for indentation tests of articular cartilage. Journal of Biomechanics. 1972 Sep;5:541–551. doi: 10.1016/0021-9290(72)90010-3. [DOI] [PubMed] [Google Scholar]
- 23.Sakamoto M, Li G, Hara T, Chao EY. A new method for theoretical analysis of static indentation test. Journal of Biomechanics. 1996 May;29:679–685. doi: 10.1016/0021-9290(95)00120-4. [DOI] [PubMed] [Google Scholar]
- 24.Cheng L, Xia X, Yu W, Scriven LE, Gerberich WW. Flat-punch indentation of viscoelastic material. Journal of Polymer Science Part B: Polymer Physics. 2000;38:10–22. [Google Scholar]
- 25.Cheng L, Xia X, Scriven LE, Gerberich WW. Spherical-tip indentation of viscoelastic material. Mechanics of Materials. 2005 Jan;37:213–226. [Google Scholar]
- 26.Mattice JM, Lau AG, Oyen ML, Kent RW. Spherical indentation load-relaxation of soft biological tissues. Journal of Materials Research. 2006;21:2003–2010. [Google Scholar]
- 27.Ebenstein DM, Pruitt LA. Nanoindentation of biological materials. Nano Today. 2006 Aug;1:26–33. [Google Scholar]
- 28.Hajji MA, Wilson TA, Lai-Fook SJ. Improved measurements of shear modulus and pleural membrane tension of the lung. Journal of Applied Physiology: Respiratory, Environmental and Exercise Physiology. 1979 Jul;47:175–181. doi: 10.1152/jappl.1979.47.1.175. [DOI] [PubMed] [Google Scholar]
- 29.Harrison SM, Bush MB, Petros PE. A pinch elastometer for soft tissue. Medical Engineering & Physics. 2007 Apr;29:307–315. doi: 10.1016/j.medengphy.2006.03.011. [DOI] [PubMed] [Google Scholar]
- 30.Kalanovic D, Ottensmeyer MP, Gross J, Buess G, Dawson SL. Independent testing of soft tissue visco-elasticity using indentation and rotary shear deformations. Studies in Health Technology and Informatics. 2003;94:137–143. [PubMed] [Google Scholar]
- 31.Furst DE, Clements PJ, Steen VD, Medsger TA, Masi AT, D’Angelo WA, Lachenbruch PA, Grau RG, Seibold JR. The modified Rodnan skin score is an accurate reflection of skin biopsy thickness in systemic sclerosis. The Journal of Rheumatology. 1998 Jan;25:84–88. [PubMed] [Google Scholar]
- 32.Browne JE, Ramnarine KV, Watson AJ, Hoskins PR. Assessment of the acoustic properties of common tissue-mimicking test phantoms. Ultrasound in Medicine & Biology. 2003 Jul;29:1053–1060. doi: 10.1016/s0301-5629(03)00053-x. [DOI] [PubMed] [Google Scholar]
- 33.Hall TJ, Bilgen M, Insana MF, Krouskop TA. Phantom materials for elastography. IEEE Transactions on Ultrasonics, Ferroelectrics and Frequency Control. 1997;44:1355–1365. [Google Scholar]
- 34.Madsen EL, Hobson MA, Shi H, Varghese T, Frank GR. Tissue-mimicking agar/gelatin materials for use in heterogeneous elastography phantoms. Physics in Medicine and Biology. 2005 Dec;50:5597–5618. doi: 10.1088/0031-9155/50/23/013. [DOI] [PMC free article] [PubMed] [Google Scholar]
- 35.Madsen EL, Frank GR, Krouskop TA, Varghese T, Kallel F, Ophir J. Tissue-mimicking oil-in-gelatin dispersions for use in heterogeneous elastography phantoms. Ultrasonic Imaging. 2003;25:17–38. doi: 10.1177/016173460302500102. [DOI] [PubMed] [Google Scholar]
- 36.de Korte CL, Céspedes EI, van der Steen AF, Norder B, te Nijenhuis K. Elastic and acoustic properties of vessel mimicking material for elasticity imaging. Ultrasonic Imaging. 1997 Apr;19:112–126. doi: 10.1177/016173469701900202. [DOI] [PubMed] [Google Scholar]
- 37.Fromageau J, Gennisson JL, Schmitt C, Maurice RL, Mongrain R, Cloutier G. Estimation of polyvinyl alcohol cryogel mechanical properties with four ultrasound elastography methods and comparison with gold standard testings. IEEE Transactions on Ultrasonics, Ferroelectrics and Frequency Control. 2007;54:498–509. doi: 10.1109/tuffc.2007.273. [DOI] [PubMed] [Google Scholar]
- 38.Oudry J, Chen J, Glaser KJ, Miette V, Sandrin L, Ehman RL. Cross-validation of magnetic resonance elastography and ultrasound-based transient elastography: A preliminary phantom study. Journal of Magnetic Resonance Imaging. 2009;30:1145–1150. doi: 10.1002/jmri.21929. [DOI] [PMC free article] [PubMed] [Google Scholar]
- 39.Gu J, Greenleaf J. The structural and acoustical properties of phantoms. Mayo Clinic; 2001. [Google Scholar]
- 40.Catheline S, Gennisson JL, Delon G, Fink M, Sinkus R, Abouelkaram S, Culioli J. Measuring of viscoelastic properties of homogeneous soft solid using transient elastography: an inverse problem approach. The Journal of the Acoustical Society of America. 2004 Dec;116:3734–3741. doi: 10.1121/1.1815075. [DOI] [PubMed] [Google Scholar]
- 41.Catheline S, Wu F, Fink M. A solution to diffraction biases in sonoelasticity: the acoustic impulse technique. The Journal of the Acoustical Society of America. 1999 May;105:2941–2950. doi: 10.1121/1.426907. [DOI] [PubMed] [Google Scholar]
- 42.Chen S, Urban MW, Pislaru C, Kinnick R, Zheng Y, Yao A, Greenleaf JF. Shearwave dispersion ultrasound vibrometry (SDUV) for measuring tissue elasticity and viscosity. IEEE Transactions on Ultrasonics, Ferroelectrics, and Frequency Control. 2009 Jan;56:55–62. doi: 10.1109/TUFFC.2009.1005. [DOI] [PMC free article] [PubMed] [Google Scholar]
- 43.Frizzell LA, Gindorf JD. Measurement of ultrasonic velocity in several biological tissues. Ultrasound in Medicine & Biology. 1981;7:385–387. doi: 10.1016/0301-5629(81)90049-1. [DOI] [PubMed] [Google Scholar]
- 44.Miller GF, Pursey H. The Field and Radiation Impedance of Mechanical Radiators on the Free Surface of a Semi-Infinite Isotropic Solid. 1954 May; [Google Scholar]
- 45.Lakes RS. Viscoelastic solids. CRC Press; 1999. Exponentials and mechanical models; pp. 23–30. [Google Scholar]
- 46.Atkinson KE, Shampine LF. Solving Fredholm integral equations of the second kind in MATLAB. ACM Transactions on Mathematical Software. 2008;34 [Google Scholar]
- 47.Dimitriadis EK, Horkay F, Maresca J, Kachar B, Chadwick RS. Determination of elastic moduli of thin layers of soft material using the atomic force microscope. Biophysical Journal. 2002;82:2798–2810. doi: 10.1016/S0006-3495(02)75620-8. [DOI] [PMC free article] [PubMed] [Google Scholar]
- 48.Zhang M, Zheng YP, Mak AF. Estimating the effective Young’s modulus of soft tissues from indentation tests–nonlinear finite element analysis of effects of friction and large deformation. Medical engineering & physics. 1997;19:512. doi: 10.1016/s1350-4533(97)00017-9. [DOI] [PubMed] [Google Scholar]
- 49.Hyttinen MM, Töyräs J, Lapveteläinen T, Lindblom J, Prockop DJ, Li SW, Arita M, Jurvelin JS, Helminen HJ. Inactivation of one allele of the type II collagen gene alters the collagen network in murine articular cartilage and makes cartilage softer. Annals of the rheumatic diseases. 2001;60:262. doi: 10.1136/ard.60.3.262. [DOI] [PMC free article] [PubMed] [Google Scholar]
- 50.Gefen A, Gefen N, Zhu Q, Raghupathi R, Margulies SS. Age-Dependent Changes in Material Properties of the Brain and Braincase of the Rat. Journal of Neurotrauma. 2003;20:1163–1177. doi: 10.1089/089771503770802853. [DOI] [PubMed] [Google Scholar]
- 51.Boyer G, Laquièze L, Le Bot A, Laquièze S, Zahouani H. Dynamic indentation on human skin in vivo: ageing effects. Skin Research and Technology. 2009 Feb;15:55–67. doi: 10.1111/j.1600-0846.2008.00324.x. [DOI] [PubMed] [Google Scholar]
- 52.Frizzell LA, Carstensen EL, Dyro JF. Shear properties of mammalian tissues at low megahertz frequencies. The Journal of the Acoustical Society of America. 1976;60:1409. doi: 10.1121/1.381236. [DOI] [PubMed] [Google Scholar]
- 53.Oyen ML. Spherical indentation creep following ramp loading. Journal of Materials Research. 2005;20:2094–2100. [Google Scholar]
- 54.Qiang B, Greenleaf J, Zhang X. Quantifying Viscoelasticity of Gelatin Phantoms by Measuring Impulse Response Using Compact Optical Sensors. Transactions on Ultrasonics, Ferroelectrics, and Frequency Control. 2010;57:1696–1700. doi: 10.1109/TUFFC.2010.1600. [DOI] [PubMed] [Google Scholar]
- 55.Orescanin M, Insana M. Shear modulus estimation with vibrating needle stimulation. Ultrasonics, Ferroelectrics and Frequency Control, IEEE Transactions on. 2010;57:1358–1367. doi: 10.1109/TUFFC.2010.1555. [DOI] [PubMed] [Google Scholar]
- 56.Catheline S, Gennisson JL, Delon G, Fink M, Sinkus R, Abouelkaram S, Culioli J. Measurement of viscoelastic properties of homogeneous soft solid using transient elastography: an inverse problem approach. The Journal of the Acoustical Society of America. 2004;116:3734. doi: 10.1121/1.1815075. [DOI] [PubMed] [Google Scholar]


