Abstract
This laboratory has developed a flow cytometric approach for scoring in vitro micronuclei (In Vitro MicroFlow®) whose characteristics are expected to benefit studies designed to comprehensively investigate genotoxicity dose-response relationships. In particular, new experimental designs become possible when automated scoring is combined with treatment, processing and sampling that all occur in microtiter plates. To test this premise, experiments described herein investigated micronucleus (MN) formation in TK6 cells treated with genotoxic agents applied at 22 closely-spaced concentrations in quadruplicate, with 10,000 cells analyzed per replicate. The genotoxicants colchicine, vinblastine sulfate, ethyl methanesulfonate, methyl methanesulfonate, ethyl nitrosourea, methyl nitrosourea, and bleomycin were applied continuously for 24 – 30 hrs. Following treatment, all cell processing, sampling and data acquisition steps were accomplished in the same 96-well plate. Data acquisition occurred in a walk-away mode via the use of a high throughput sampling device. The resulting flow cytometric MN values were evaluated with a statistical model that indicated non-linear relationships describe the data better than linear fits. The one exception was bleomycin, where MN induction was consistently best described by a linear dose-response relationship. Collectively, these results suggest that flow cytometry represents a practical and efficient approach for thoroughly examining the dose-response relationship, and clearly benefits studies that seek to characterize no observable genotoxic effect levels, lowest observable genotoxic effect levels, and/or benchmark doses.
Keywords: micronuclei, flow cytometry, genotoxicity, threshold, risk assessment, TK6 cells
Introduction
The existence of a threshold dose, that is, a dose level below which no observed adverse effects occur, is a well-known concept in toxicology [1]. For certain classes of genotoxicants, primarily aneugens, there is general consensus that their dose-response relationships are thresholded [2–4]. The mode of action for these agents is considered a key variable. For instance in the case of spindle poisons, chromosome segregation is not affected unless multiple targets are disrupted, a situation that is predicted to result in a thresholded response [5]. Conversely, radiation and DNA-reactive gentoxicants have historically been assumed to exhibit non-thresholded dose-response relationships [6–7]. This default assumption has important consequences, since by definition there is no dose without effect. Regulation of genotoxicants with this profile is therefore strict in order to prevent or at least minimize human exposure [8–9]. However, new evidence is accumulating that suggests even DNA-reactive genotoxicants can exhibit thresholded dose-responses [10–14]. Cellular defenses mechanisms, especially DNA-repair capacity, are often cited as contributing to thresholds in these cases [15].
Given the important implications that dose-response relationships have in risk assessment, it is clear that assumptions about DNA-reactivity/non-reactivity and thresholded versus non-thresholded responses requires further study. This situation highlights the need for in vitro assays that can comprehensively evaluate the low end of the dose-response curve. Indeed, Johnson and colleagues [12] expressed the need for in vitro assays that allow for large numbers of individual cells to be analyzed, include many replicates, and utilize closely-spaced dose levels. However, the desire for thorough dose-response data is problematic unless the assay is very efficient, with data acquisition occurring via an automated process.
This laboratory has previously reported on the development of a flow cytometric method for scoring in vitro micronuclei (commercially known as In Vitro MicroFlow®) [16–18]. In this system, a non-ionic detergent is used to liberate nuclei and micronuclei into suspension. In conjunction with outer membrane lysis, a sequential staining procedure is used to differentially stain chromatin from dead and dying cells from that of “healthy cells”, thereby minimizing the impact that necrosis and apoptosis has on the micronucleus (MN) frequency determinations. The so-called miniaturized version of the assay, conducted in 96 well plates, exhibits several characteristics that address the requirements articulated by Johnson and colleagues. For instance, all the cell processing steps occur in the same 96 well plate, thus enhancing assay efficiency. In this format, it becomes simple to examine a very large number of concentrations and to include many replicate wells. Furthermore, flow cytometric data acquisition allows one to interrogate many cells per replicate for MN formation. We hypothesized that these characteristics would provide a useful platform for studying genotoxicity dose-response relationships. To test this premise, we used this system to study several prototypical genotoxicants, both DNA-reactive and non-reactive, using many finely-spaced dose levels. The resulting data were evaluated in a statistical model designed to estimate a threshold dose and its confidence limits [19]. The results are discussed in regards to the ongoing need for data that thoroughly evaluates dose-response relationships.
Materials and Methods
Reagents
Colchicine (COL), vinblastine sulfate (VB), ethyl methanesulfonate (EMS), methyl methanesulfonate (MMS), ethyl nitrosourea (ENU), methyl nitrosourea (MNU), bleomycin (BLEO), and dimethyl sulfoxide (DMSO) were purchased from Sigma-Aldrich (St. Louis, MO). Reagents for staining and lysing cells for flow cytometric analysis were from In Vitro MicroFlow® Kits (Litron Laboratories, Rochester, NY). These materials included Buffer Solution, Nucleic Acid Dye A Solution (i.e., ethidium monoazide bromide), Nucleic Acid Dye B Solution (i.e., SYTOX® Green dye), Lysis Solutions 1 and 2, and RNase Solution. Six micron fluorescent beads used to acquire nuclei-to-bead ratios were purchased from Invitrogen (Carlsbad, CA; cat. no. P14828).
Cell Culture
TK6 cells (from ATCC, Manassas, VA) were maintained at 37°C, 5% CO2, and in a humid atmosphere. For routine culturing, the cells were maintained at or below approximately 1×10⁶/ml. The culture medium consisted of RPMI 1640 with 200 µg sodium pyruvate/ml, 200 µM L-glutamine, 50 units penicillin/ml, 50 µg streptomycin /ml, and 10% v/v heat-inactivated horse serum. Except for sodium pyruvate (Sigma) and horse serum (Invitrogen), all other culture medium components were from Mediatech, Inc. (Manassa, VA).
Treatment
A series of wells were generated that covered a range of closely spaced test article concentrations (4 replicate wells per concentration, except for solvent control’s 8 wells). Note that top concentrations were chosen based on pilot experiments that were conducted to ensure significant MN induction while avoiding overly cytotoxic concentrations (data not shown). For the definitive experiments, using a multichannel pipettor, 100 µl culture medium with 2% v/v DMSO was aliquoted across wells of a 96-well plate (product ID: Costar 3799, Corning Inc., Corning NY). Four wells received 200 µl each of culture medium with 2% v/v DMSO and 2x the desired final highest concentration of test article. Another four wells received 200 µl each of culture medium with 2% DMSO and 2x the desired second highest concentration of test article (second highest concentration being 75% of high concentration). Up to 20 lower test article concentrations were prepared on the same plate through serial dilutions of these top two test article-containing wells. The result was a series of finely spaced concentrations with 2x the desired final concentration of test article and DMSO.
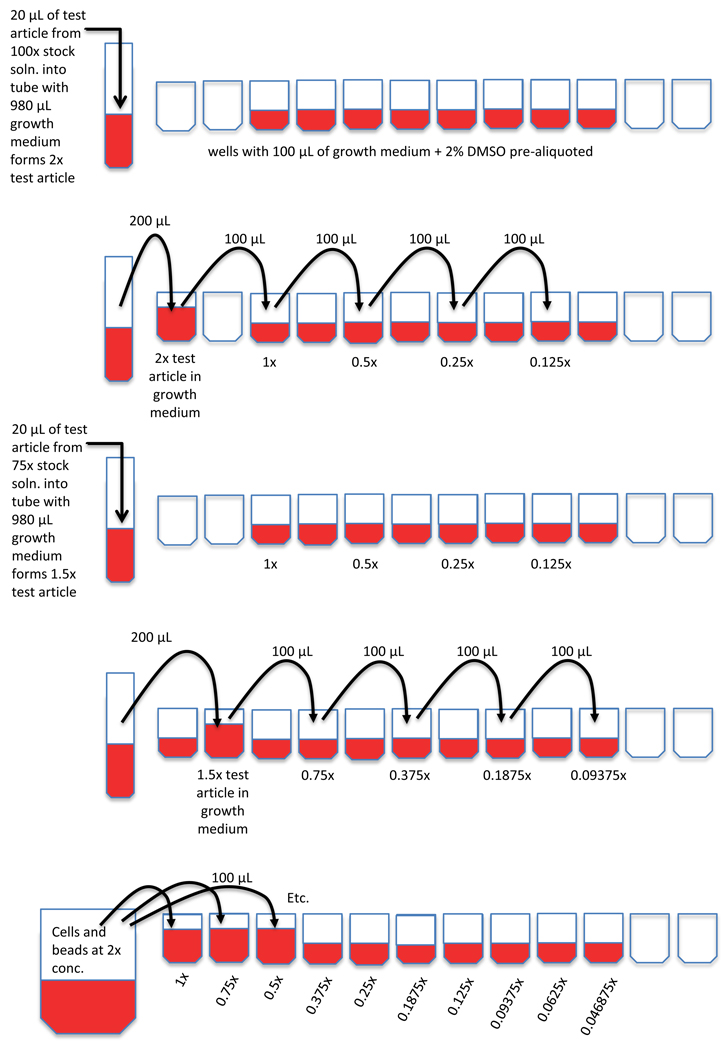
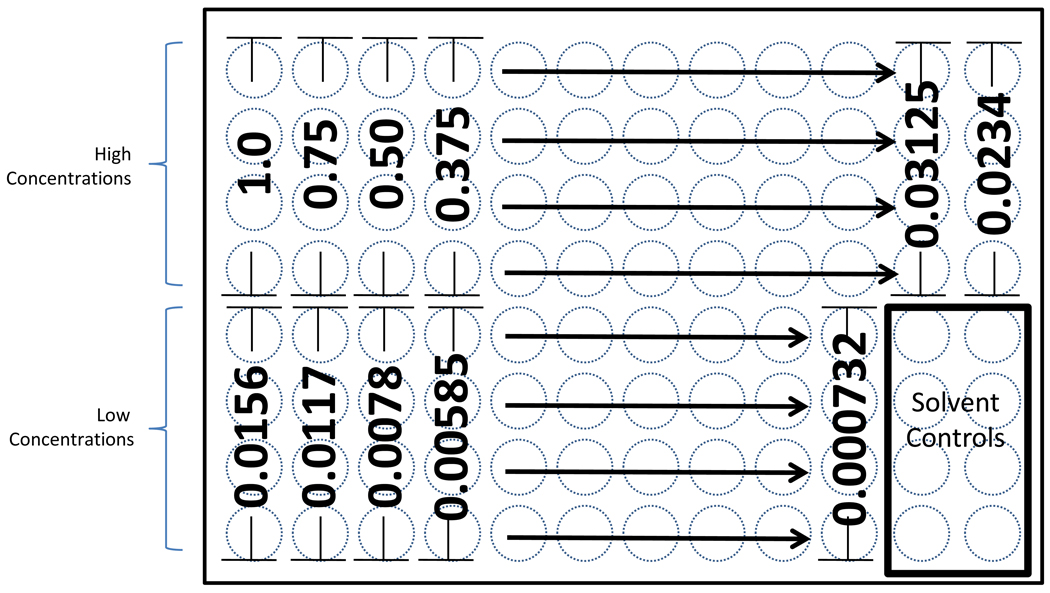
A suspension of log phase TK6 cells plus counting beads were then added to each microtiter well to achieve the desired final concentrations of test article, DMSO, cells, and counting beads. Specifically, TK6 cells were adjusted to 4×10⁵ cells/ml, and approximately one drop of six micron fluorescent beads (“counting beads”) were added per 10 ml cell culture. 100 µl per well of this cell/bead suspension was then distributed across each well that contained 100 µl of test article at 2x the desired final concentration, as described above. Figure 1 illustrates this plating procedure. Additional information about the resulting dilution series is provided in Figure 2 and Table I. The cells were returned to the 37°C incubator and exposed for the amount of time that corresponds to 1.5 to 2.0 normal cell doublings (i.e., 24 – 30 hrs).
Figure 1.
Sequence of steps illustrate the manner by which 96-well plates were prepared with consistent densities of TK6 cells and microspheres, but a range of finely spaced test articles concentrations. Reading from top to bottom, the first step is to aliquot growth medium plus solvent. Test article-containing growth medium is then diluted serially by ½ steps from 2x and 1.5x solutions. When a cell/microspheres suspension is added, desired final concentrations of cells, beads, solvent, and test article are achieved.
Figure 2.
The plate layout used in these studies is illustrated. With “1” representing the top concentration of test article evaluated, the relative concentrations of the remaining wells is depicted. As shown here, 22 concentrations spanning three orders of magnitude were investigated.
Table I.
Chemicals and Treatment Information
| Chemical (trial no.) | No. Conc. Tested |
Conc. Units |
Lowest Conc. Tested |
Highest Conc. Tested |
No. Conc. ≥ 50% RS |
No. Conc. Evaluated by Statistical Model |
Relative Survival at Top Conc. Evaluated by Statistical Model |
|---|---|---|---|---|---|---|---|
| COL (1) | 22 | ng/ml | 0.004394531 | 6 | 21 | 21 | 50 % |
| COL (2) | 22 | ng/ml | 0.004394531 | 6 | 22 | 22 | 79 % |
| VB (1) | 22 | ng/ml | 0.000366211 | 0.5 | 21 | 21 | 54 % |
| VB (2) | 22 | ng/ml | 0.000366211 | 0.5 | 22 | 22 | 84 % |
| ENU (1) | 22 | µg/ml | 0.073242188 | 100 | 17 | 17 | 51 % |
| ENU (2) | 22 | µg/ml | 0.073242188 | 100 | 17 | 17 | 57 % |
| MNU (1) | 22 | µg/ml | 0.007324219 | 10 | 21 | 19 | 59 % |
| MNU (2) | 22 | µg/ml | 0.007324219 | 10 | 16 | 16 | 57 % |
| EMS (1) | 22 | µg/ml | 0.036621094 | 50 | 22 | 20 | 67 % |
| EMS (2) | 22 | µg/ml | 0.036621094 | 50 | 20 | 20 | 53 % |
| MMS (1) | 22 | µg/ml | 0.003662109 | 5 | 22 | 22 | 54 % |
| MMS (2) | 22 | µg/ml | 0.003662109 | 5 | 20 | 20 | 58 % |
| BLEO (1) | 22 | µM | 0.000366211 | 0.5 | 18 | 18 | 58 % |
| BLEO (2) | 22 | µM | 0.000366211 | 0.5 | 22 | 22 | 100 % |
Cell Staining/Lysis
Cell staining and lysis occurred with kit reagents according to manufacturer recommendations (In Vitro MicroFlow® Kit Manual, v100223; Litron Laboratories, Rochester, NY). The method is an adaption of an approach originally described by Nüsse and colleagues [20–21]. For the current experiments, staining occurred in the same 96-well plate(s) that were used to treat cells. That is, at time of harvest, growth medium was carefully removed with a bridge aspirator that controlled the depth of the prongs so that approximately 10 µl remained on the bottom of each well (aspirator comb, cat. no. VP180B; aspirator bridge, cat. no. VP180S; both from VP Scientific, San Diego, CA). Kit-supplied ethidium monoazide bromide (EMA) solution was added, and after a photoactivation step, the plates were centrifuged for 5 minutes in a swinging bucket centrifuge at 300×g. After removing supernatants with the bridge aspirator, 75 µl each of Lysis Solutions I and II were successively added to each well using a multichannel pipettor. The Lysis Solutions are composed in part of a non-ionic detergent, the pan-nucleic acid dye SYTOX® Green, and RNase. After lysis, the samples were stored for no longer than 4 days at 4°C before flow cytometric analysis occurred.
Flow Cytometric Scoring
Flow cytometric scoring of MN was performed according to MicroFlow Kit recommendations. Room temperature-equilibrated plates were analyzed with a BD Biosciences (San Jose, CA) FACSCanto II flow cytometer running Diva v6.1.1 and equipped with a BD High Throughput Sampler (HTS). Based on the acquisition of at least 10,000 EMA-negative/SYTOX Green-positive (“healthy”) nuclei per well, %MN and %Relative Survival values were calculated. The manner of performing these calculations has been described previously [17].
Data Analysis
The MN frequency data were evaluated with the so-called hockey stick model devised by Lutz and Lutz [19]. For these analyses, MN frequencies and concentrations were entered into the R package (The R Foundation for Statistical Computing, version 2.9.0 downloaded from http://www.r-project.org) and processed according to the Lutz and Lutz program, kindly provided by Professor Werner Lutz. The calculated p-values indicate the level at which linearity can be rejected against the threshold model. Furthermore, in the case of an apparent threshold, the inflection point is calculated, along with upper and lower confidence intervals.
As recommended by Lutz and Lutz [19], in order to reduce the influence that saturation of the MN response has on this model, an iterative approach was used whereby upper dose levels were removed one by one until p-values reached a minimum value. This procedure was utilized for two data sets (the second MNU and the first EMS experiment), as these were the only instances that appreciably different p-value were observed.
Proof-of-Principle Reconstruction Experiment
Rather than assuming linear responses could be detected by flow cytometry in conjunction with the hockey stick model, experiments with two types of fluorescent latex beads were performed (both bead types from the BD Calbrite kit, cat. no. 349502, BD Bioscience, San Jose, CA). First, a so-called “Baseline Suspension” was created with red fluorescence latex particles at a density that approximated cells in culture at time of harvest (8×10⁵/ml) and with green fluorescence latex particles that were added to approximate the incidence of MN events (approximately 0.3%). An “Induced Suspension” was created with the same density of red particles, but green fluorescent latex particles were added at a higher density to simulate an induced MN frequency (approximately 4 and 5% for the two independent experiments). Then, a series of 20 specimens with intermediate concentrations of MN-mimicking red beads was created by serially diluting the Induced Suspension with equal volumes of the Baseline Suspension. These preparations were aliquoted over 4 wells of a 96-well plate, except for the Baseline Suspension, which was aliquoted over 8 wells. As with the TK6 cell experiments described above, each well was analyzed via flow cytometry and the stop mode was 10,000 to be consistent with the cell experiments. The incidence of red particles was expressed as frequency percent, and these values were analyzed with the hockey stick program as described above. In place of chemical concentration, relative concentrations of red beads were inputted into the program, with the Induced Suspension given the arbitrary value of 50.
Results
Preliminary Experiments
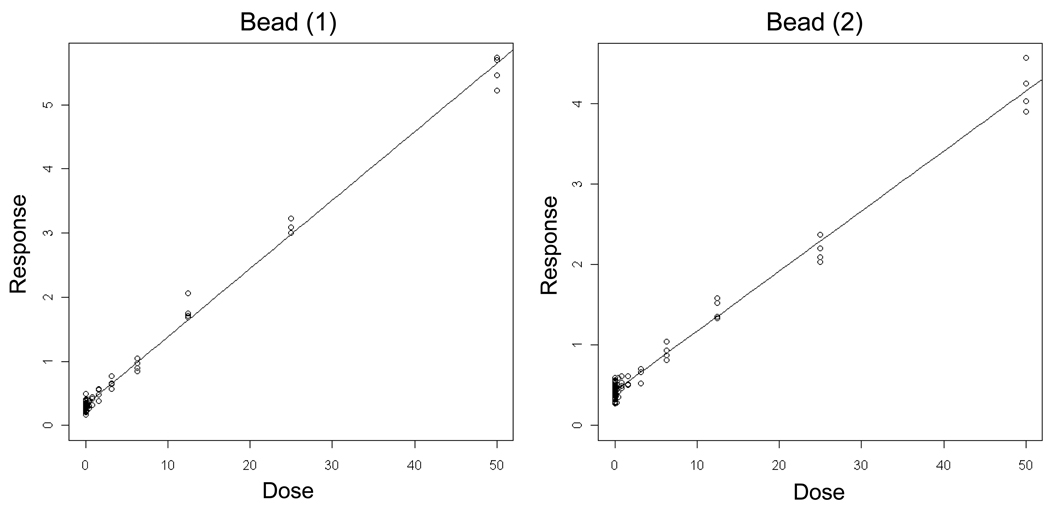
Results from two independent reconstruction experiments performed with latex microspheres are shown in Figure 3 and Table II. Importantly, the density and incidence of the latex microspheres were carefully chosen to simulate the occurrence of nuclei and MN evaluated in the cell-based work that followed. With high p-values as well as zero values for the lower limit of the threshold confidence interval, the hockey stick model indicated that these data sets are best described by linear fits. These results represent an important starting point that demonstrated that flow cytometry, in conjunction with the hockey stick model, is able to accurately identify truly linear dose-response relationships.
Figure 3.
Output from the hockey-stick program of Lutz and Lutz [19] is shown for two independent microsphere (“Bead”) simulation experiments. In these examples, the frequency (%) of red fluorescence microspheres determined via flow cytometric analysis is graphed as a function of their known incidence. The results and corresponding p-values indicate that these data are best described by linear fits.
Table II.
Results of R-Based Statistical Analyses (Lutz and Lutz model)
| Chemical (trial no.) | td | Confidence Interval for td |
b | Confidence Interval for b |
p Value |
|---|---|---|---|---|---|
| Beads (1) | −0.939 | 0.0, 0.160 | 0.107 | 0.105, 0.108 | 1 |
| Beads (2) | −0.857 | 0.0, 0.467 | 0.0745 | 0.073, 0.076 | 0.99 |
| Colchicine (1) | 2.732 | 2.689, 2.773 | 5.863 | 5.671, 6.056 | 0 |
| Colchicine (2) | 2.811 | 2.690, 2.921 | 0.998 | 0.945, 1.052 | 0 |
| Vinblastine (1) | 0.178 | 0.165, 0.210 | 5.751 | 5.209, 7.132 | 0 |
| Vinblastine (2) | 0.208 | 0.166, 0.229 | 4.433 | 3.688, 4.935 | 8.88e-16 |
| ENU (1) | 2.34 | 1.319, 2.917 | 0.074 | 0.066, 0.081 | 0.003 |
| ENU (2) | 5.845 | 2.933, 8.322 | 0.051 | 0.036, 0.069 | 0.0002 |
| MNU (1) | 0.357 | 0.231, 0.500 | 0.831 | 0.746, 0.924 | 0.0003 |
| MNU (2) | 0.259 | 0.191, 0.356 | 2.87 | 2.549, 3.303 | 1.44e-05 |
| EMS (1) | 8.074 | 7.372, 8.710 | 0.316 | 0.296, 0.336 | 0 |
| EMS (2) | 7.581 | 4.762, 9.139 | 0.058 | 0.046, 0.067 | 9.33e-06 |
| MMS (1) | 0.804 | 0.266, 1.280 | 0.561 | 0.462, 0.673 | 0.022 |
| MMS (2) | 0.723 | 0.404, 0.877 | 1.287 | 1.013, 1.482 | 3.22e-05 |
| Bleomycin (1) | −0.066 | 0.0, 0.001 | 31.501 | 28.98, 34.03 | 1 |
| Bleomycin (2) | −1.370 | 0.0, 0.002 | 5.948 | 5.33, 6.56 | 1 |
td = Best estimate of the threshold dose
b = Best estimate for the slope above the threshold dose
p Value < 0.05 with confidence intervals that do not include zero indicates statistically better fit for threshold model.
p Value ≥ 0.05 indicates linear fit cannot be rejected.
In order to help rationally determine an appropriate stop mode for the definitive experiments that followed, pilot studies were performed with genotoxicant-treated TK6 cells whereby the incidence of MN was determined upon the acquisition of varying numbers of nuclei (2,000 to 100,000 per replicate). The results of this work suggested that while the Lutz model’s estimated threshold concentrations were only modestly affected, the associated confidence intervals tended to become appreciably tighter when higher numbers of events were interrogated. For instance given continuous MNU treatment, the threshold concentration’s lower and upper 95% confidence intervals were 0.175 – 0.467 µg/ml when 2,000 nuclei/replicate were acquired, versus 0.287 – 0.421 when 20,000 nuclei/replicate were collected. As with confidence intervals, probability values were also affected by the stop mode. For the MNU example described above, the p-values were 0.04 and 5.14e-09 for the 2,000 versus 20,000 nuclei/replicate data sets, respectively. These and other pilot data (not shown) suggested that a stop mode of 10,000 nuclei/replicate represented a good compromise between precision and the efficient acquisition of large data sets.
Aneugens
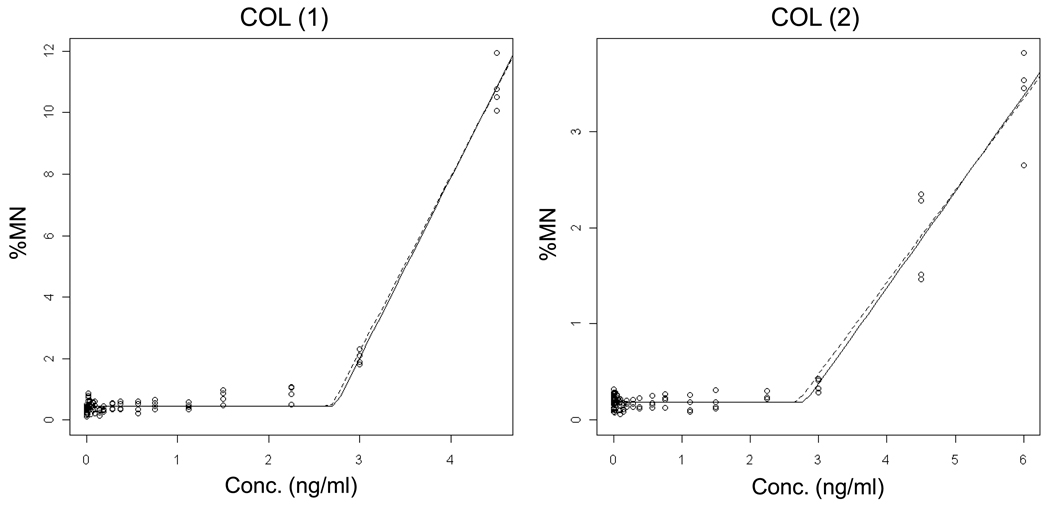
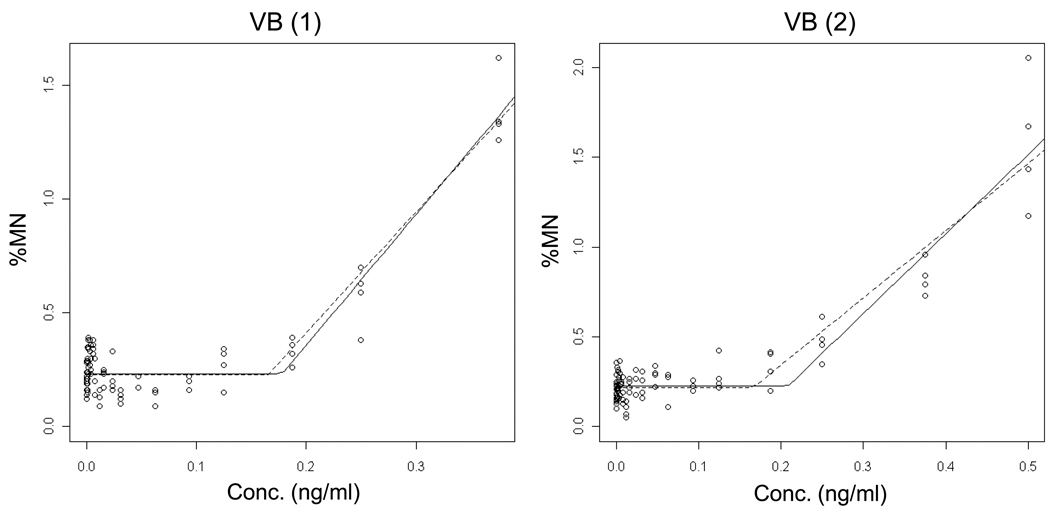
As shown in Figures 4 – 5 and Table II, COL and VB results showed strong evidence for thresholded, non-linear dose-response relationships. Low p-values with a positive lower limit of the confidence interval for the threshold support this interpretation. Data from replicate experiments indicate that the estimated threshold doses were quite reproducible between experiments, whereas the slopes above the threshold dose were more variable, especially in the case of COL.
Figure 4.
Output from the hockey-stick program [19] is shown for two independent Colchicine (COL) experiments. The frequency (%) of micronuclei determined via flow cytometric analysis is graphed as a function of COL concentration (ng/ml). Whereas the solid line indicates the best fit, the dashed line shows the hockey stick based on the lower limit of a confidence interval for the threshold dose. The results and statistically significant p-values suggest that the hockey stick model is a better description of the dose-response relationships than a linear fit.
Figure 5.
Output from the hockey-stick program [19] is shown for two independent Vinblastine sulfate (VB) experiments. The frequency (%) of micronuclei determined via flow cytometric analysis is graphed as a function of VB concentration (ng/ml). Whereas the solid line indicates the best fit, the dashed line shows the hockey stick based on the lower limit of a confidence interval for the threshold dose. The results and statistically significant p-values suggest that the hockey stick model is a better description of the dose-response relationships than a linear fit.
Alkylating Agents
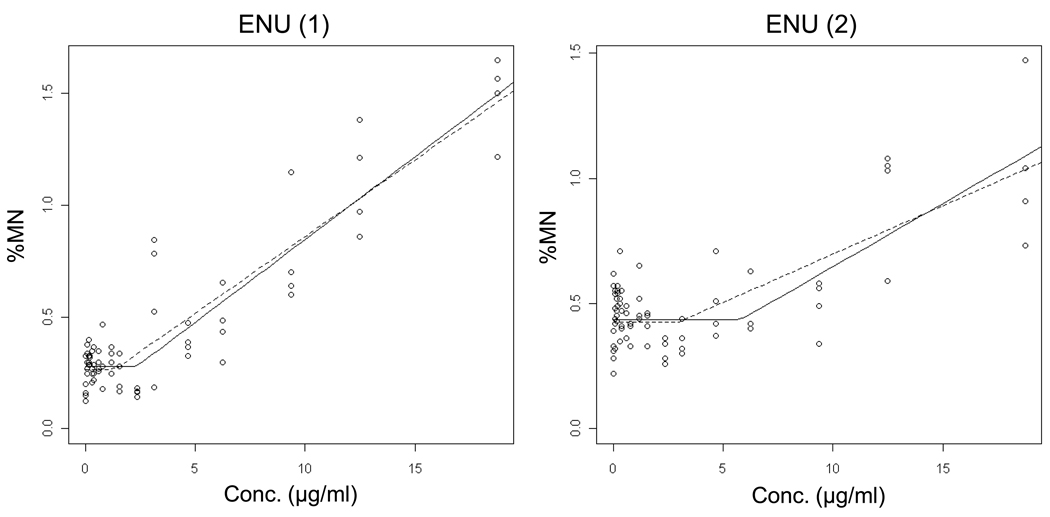
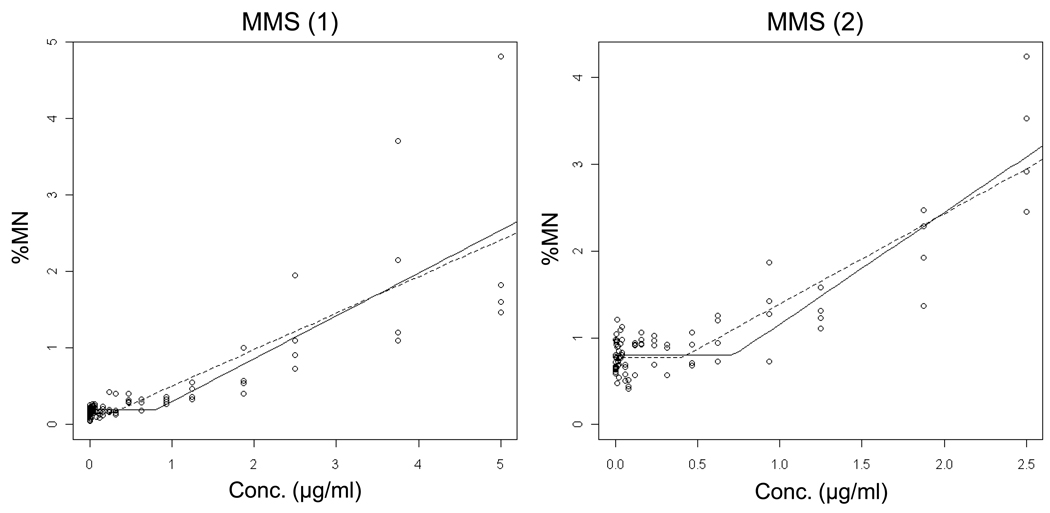
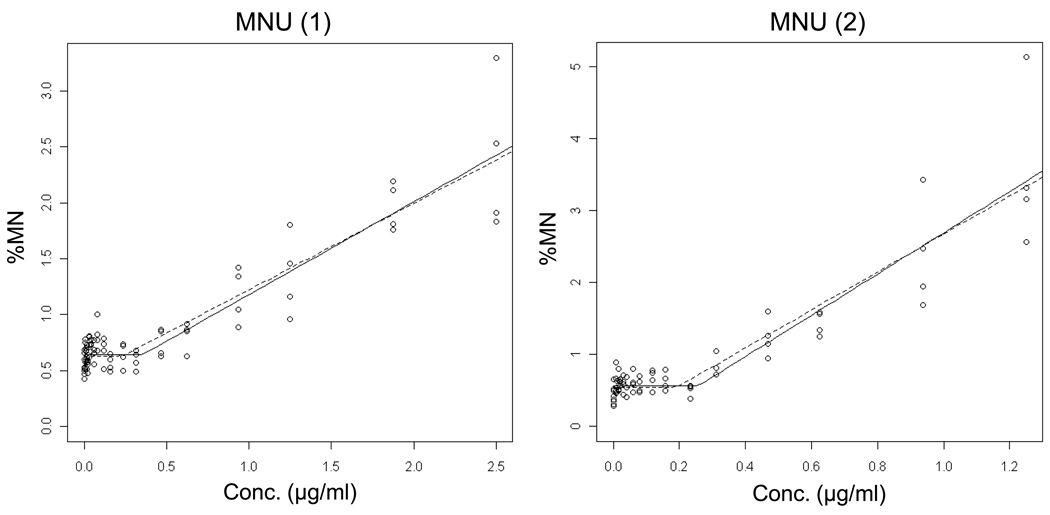
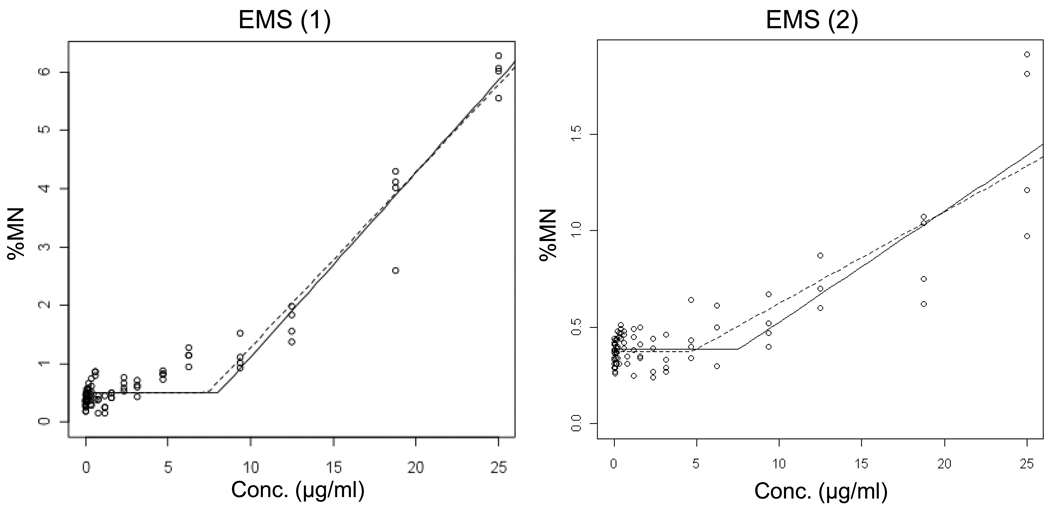
Data for the alkylating agents ENU, MNU, EMS and MMS are shown in Figures 6 – 9 and Table II. Each agent showed evidence of non-linear dose response relationships. That is, statistically significant p-values suggest that the hockey stick model is a better description of the dose-response relationships than a linear fit. These interpretations were confirmed with independent repeat experiments. Note that the MNU experiment 2 seemingly produced a non-significant p-value, but following the recommended iterative approach that reduces the impact that a saturated response variable has on the output [19], the highly significant result shown in Table II was generated.
Figure 6.
Output from the hockey-stick program [19] is shown for two independent ethyl nitrosourea (ENU) experiments. The frequency (%) of micronuclei determined via flow cytometric analysis is graphed as a function of ENU concentration µg/ml). Whereas the solid line indicates the best fit, the dashed line shows the hockey stick based on the lower limit of a confidence interval for the threshold dose. The results and statistically significant p-values suggest that the hockey stick model is a better description of the dose-response relationships than a linear fit.
Figure 9.
Output from the hockey-stick program [19] is shown for two independent methyl methanesulfonate (MMS) experiments. The frequency (%) of micronuclei determined via flow cytometric analysis is graphed as a function of EMS concentration µg/ml). Whereas the solid line indicates the best fit, the dashed line shows the hockey stick based on the lower limit of a confidence interval for the threshold dose. The results and statistically significant p-values suggest that the hockey stick model is a better description of the dose-response relationships than a linear fit.
The estimated threshold doses were fairly reproducible between independent repeat experiments, especially for the methanesulfonates. On the other hand, as with the aneugens, the slopes above the threshold doses tended to be more variable.
Bleomycin
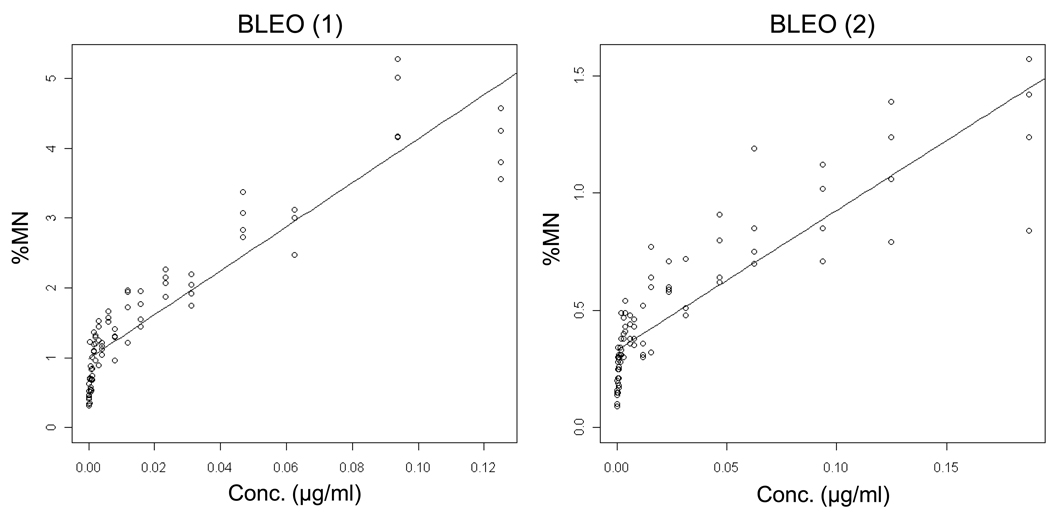
Whereas each of the six other genotoxicants showed evidence of non-linear dose responses, BLEO data were quite different. See Figure 10 and Table II. In two independent experiments, high p-values as well as zero values for the lower limit of the threshold confidence interval were observed, indicating that a linear dose-response relationship cannot be rejected.
Figure 10.
Output from the hockey-stick program [19] is shown for two independent bleomycin (BLEO) experiments. The frequency (%) of micronuclei determined via flow cytometric analysis is graphed as a function of BLEO concentration µM). The results and corresponding p-values indicate that these data are best described by linear fits.
Discussion
Elucidation of dose-response relationships at relatively low concentrations can have significant implications for risk assessment, and new tools and techniques for conducting these investigations are needed [9, 12]. We undertook these proof-of-principle studies with a flow cytometry-based MN scoring system, realizing its throughput capacity has the potential to enhance the experimental design, especially in terms of numbers concentrations, replicate wells, and cells scored. To begin examining the merits of this system, we chose prototypical genotoxicants that have been studied in detail previously.
As expected, both of the aneugens exhibited clear evidence of thresholded MN responses. Interestingly, each of the DNA-reactive alkylating agents exhibited significant deviations from linearity. As articulated by Lutz and Lutz [19], it should be noted that the low p-values reported herein do not represent “proof” of mathematical threshold dose-responses, but rather represent evidence that linearity is highly unlikely as compared to a hockey stick model. The one exception to a non-linear dose-response relationship was with BLEO, an agent that generates reactive oxygen species that are capable of cleaving the sugar ring of DNA and forming a-basic sites [22]. In both replicate experiments, high p-values and zero values for the lower limit of the threshold confidence interval were observed, indicating a linear fit model could not be rejected.
The advantage of starting with these particular seven agents is that they have been extensively studied by others, albeit using manual scoring methods that tended to limit the numbers of replicates, cells, and concentrations examined. For instance, Doak and colleagues investigated MN formation and mutation at the HPRT locus following treatment of AHH-1 human lymphoblastoid cells to ENU, MNU, EMS, and MMS [11]. Dose response curves for both EMS and MMS revealed ‘no effect’ thresholds for MN formation and gene mutation, whereas both ENU and MNU responses were initially reported to be best described by linear fits. When these investigators subsequently reanalyzed their data using the Lutz hockey stick model, the threshold doses (MN formation) for EMS and MMS were 1.06 and 0.38 µg/ml, respectively [12]. These values are somewhat lower than the 7.6 – 8.1 µg/ml we observed for EMS, and 0.72 – 0.80 for MMS, but they do exhibit the same rank order. It is not clear at this time whether significant differences in experimental design, for instance Doak and colleagues’ use of cytochalasin B or a mutant p53 cell line, are responsible for these modest discrepancies. In any event, it was the nitrosoureas that produced more striking differences. Whereas our data showed evidence for non-linear dose response relationships, Doak et al. could not reject linear fits for the MN endpoint. Interestingly, the hockey stick model did suggest a threshold dose of 0.32 µg/ml for ENU-induced gene mutation [12]. Again, it is not clear what aspects of experimental design may have contributed to these differences. Even so, it is noteworthy that the authors concluded their article by speculating that if they had tested lower concentrations of ENU and MNU, thresholds for gene and point mutations in vitro may have been identified.
Investigations with ENU and EMS were performed as part of extensive experimentation into the potential human health implications of EMS-contaminated Viracept [14–15]. In these studies, in vivo genotoxicity was studied using the bone marrow micronucleus endpoint, and also mutation analysis in multiple tissues of the Muta™ Mouse model. No-observed-adverse-effect-level (NOAEL) of approximately 25 mg/kg/day was found for EMS, and these data contributed to a risk assessment investigation that predicted no adverse effects of the reported human exposure incident [24]. Because repeat administration of 0.5 mg ENU/kg/day produced marginal in vivo responses that were considerably less than one-thirtieth of the response when 15 mg/kg/day was used, the authors speculated that a threshold for ENU of approximately 0.4 mg/kg/day may exist.
Pottenger and colleagues examined DNA adducts and gene mutation in L5178Y mouse lymphoma cells exposed to the alkylating agents MMS and MNU [25]. Employing various statistical methods, these investigators provided evidence of ‘operational thresholds’ where no increases in Tk mutation frequency were observed, despite quantifiable increases in N7-methylguanine adducts, a biomarker of exposure. These authors concluded their report with the recommendation to collect “…complete dose-response data as a standard approach, including NOAELs, the same paradigm that applies to the rest of toxicology.”
Recent work with BLEO and the in vitro MN endpoint has also occurred [26]. These investigators also studied TK6 cells, and one of their exposure scenarios, continuous treatment for 24 hrs, closely mimics the one utilized herein. Whereas we could not rule out a linear dose-response relationship, Platel and colleagues showed evidence of a non-linear MN response, with an estimated NOEL of 6.25×10⁻³ µM. The degree to which these results were affected by practical limitations of microscopy—two replicate cultures and 1000 cells per culture in this case—is not clear at this time. In any event, these discrepant BLEO results indicate the need for further study.
As reports regarding genotoxic effects at low concentrations continue to appear in the literature, it is becoming clear that new approaches for quantitatively assessing responses and exposures are needed. Automated scoring of genotoxicity endpoints is likely to be a key requirement, since it will be important to comprehensively study the dose-response relationship, and to survey many cells per replicate in order to enhance the sensitivity and precision of the measurements. The automated MN scoring platform presented herein therefore represents an important step forward, as it represents a practical means of accumulating these data. Developing a better understanding of the merits and limitations of various statistical approaches for evaluating dose-response relationships is another area that may benefit from the continued development of this and other automated scoring methodologies. With this in mind, we would like to make the complete MN data sets described herein available to interested genetic toxicology and risk assessment researchers in order to facilitate alternate analyses and deeper discussions (requests can be made to the corresponding author).
Figure 7.
Output from the hockey-stick program [19] is shown for two independent methyl nitrosourea (MNU) experiments. The frequency (%) of micronuclei determined via flow cytometric analysis is graphed as a function of MNU concentration µg/ml). Whereas the solid line indicates the best fit, the dashed line shows the hockey stick based on the lower limit of a confidence interval for the threshold dose. The results and statistically significant p-values suggest that the hockey stick model is a better description of the dose-response relationships than a linear fit.
Figure 8.
Output from the hockey-stick program [19] is shown for two independent ethyl methanesulfonate (EMS) experiments. The frequency (%) of micronuclei determined via flow cytometric analysis is graphed as a function of EMS concentration µg/ml). Whereas the solid line indicates the best fit, the dashed line shows the hockey stick based on the lower limit of a confidence interval for the threshold dose. The results and statistically significant p-values suggest that the hockey stick model is a better description of the dose-response relationships than a linear fit.
Acknowledgments
Acknowledgments and Disclosures
This work was funded by a grant from the National Institute of Health/National Institute of Cancer (S.D.D., No. R44CA117093). The contents are solely the responsibility of the authors, and do not necessarily represent the official views of the NCI.
The authors are employed by Litron Laboratories, a company that holds patents related to flow cytometry-based micronucleus scoring. Litron sells kits based on this technology that are commercially known as In Vitro MicroFlow® Kits.
Footnotes
Publisher's Disclaimer: This is a PDF file of an unedited manuscript that has been accepted for publication. As a service to our customers we are providing this early version of the manuscript. The manuscript will undergo copyediting, typesetting, and review of the resulting proof before it is published in its final citable form. Please note that during the production process errors may be discovered which could affect the content, and all legal disclaimers that apply to the journal pertain.
References
- 1.Cox C. Threshold Dose-Response Models in Toxicology. Biometrics. 1987;43:511–523. [PubMed] [Google Scholar]
- 2.Parry JM, Fiedler RJ, McDonald A. Thresholds for aneuploidy-inducing chemicals. Mutagenesis. 1994;9:503–504. doi: 10.1093/mutage/9.6.503. [DOI] [PubMed] [Google Scholar]; Elhajouji A, Van Hummelen P, Kirsh-Volders M. Indications for a threshold of chemically-induced aneuploidy in vitro in human lymphocytes. Environ. Mol. Mutagen. 1995;26:292–304. doi: 10.1002/em.2850260405. [DOI] [PubMed] [Google Scholar]
- 3.Aardema MJ, Albertini S, Arni P, Henderson LM, Kirsch-Volders M, Mackay JM, Sarrif AM, Stringer DA, Tallman RD. Aneuploidy: a report of an ECETOC task force. Mutat. Res. 1998;410:3–79. doi: 10.1016/s1383-5742(97)00029-x. [DOI] [PubMed] [Google Scholar]
- 4.Cammerer Z, Schumacher MM, Kirsch-Volders M, Suter W, Elhajouji A. Flow cytometric peripheral blood micronucleus test in vivo: Determination of potential thresholds for aneuploidy induced by spindle poisons. Environ. Mol. Mutagen. 2010;51:278–284. doi: 10.1002/em.20542. [DOI] [PubMed] [Google Scholar]
- 5.Kirsch-Volders M, Aardema M, Elhajouji A. Concepts of thresholds in mutagenesis and carcinogenesis. Mutat. Res. 2000;464:3–11. doi: 10.1016/s1383-5718(99)00161-8. [DOI] [PubMed] [Google Scholar]
- 6.UNSCEAR. United Nations Scientific Committee on the Effects of Atomic Radiation, Sources and effects of ionizing radiation, report to the General Assembly, Official Records, Thirteenth Session. 1958 Supplement No. 17 (A/38 38) [Google Scholar]
- 7.Ehling UH, Averbeck D, Cerutti PA, Friedman J, Greim H, Kolbye AC, Jr, Mendelsohn ML. International Commission for Protection against Environmental Mutagens and Carcinogens. ICPEMC publication no. 10 Review of the evidence for the presence or absence of thresholds in the induction of genetic effects by genotoxic chemicals. Mutat. Res. 1983;123:281–341. doi: 10.1016/0165-1110(83)90026-x. [DOI] [PubMed] [Google Scholar]
- 8.WHO. Geneva, Switzerland: World Health Organization (WHO), International Programme on Chemical Safety (IPCS), in cooperation with the Joint WHO/FAO Expert Committee on Food Additives (JECFA); Principles for the Safety of Food Additives and Contaminants in Food. WHO Environmental Health Criteria. Environmental Health Criteria No. 70.
- 9.Müller L, Mauthe RJ, Riley CM, Andino MM, Antonis DD, Beels C, DeGeorge J, De Kaep AG, Ellison D, Fagerland JA, Frank R, Fritschel B, Galloway S, Harpur E, Humfrey CD, et al. A rationale for determinating, testing, and controlling specific impurities in pharmaceuticals that possess potential for genotoxicity. Regul. Toxicol. Pharmacol. 2006;44:198–211. doi: 10.1016/j.yrtph.2005.12.001. [DOI] [PubMed] [Google Scholar]
- 10.Asano N, Torous DK, Tometsko CR, Dertinger SD, Morita T, Hayashi M. Practical thresholds for micronucleated reticulocyte induction observed for low doses of mitomycin C, Ara-C and colchicine. Mutagenesis. 2006;21:15–20. doi: 10.1093/mutage/gei068. [DOI] [PubMed] [Google Scholar]
- 11.Doak SH, Jenkins GJ, Johnson GE, Quick E, Parry EM, Parry JM. Mechanistic influences for mutation induction curves after exposure to DNA-reactive carcinogens. Cancer Res. 2007;67:3904–3911. doi: 10.1158/0008-5472.CAN-06-4061. [DOI] [PubMed] [Google Scholar]
- 12.Johnson GE, Doak SH, Griffiths SM, Quick EL, Skibinski DOF, Zaïr ZM, Jenkins GJ. Non-linear dose-response of DNA-reactive genotoxicants: Recommendations for data analysis. Mutat. Res. 2009;678:95–100. doi: 10.1016/j.mrgentox.2009.05.009. [DOI] [PubMed] [Google Scholar]
- 13.Pottenger LH, Schisler MR, Zhang F, Bartels MJ, Fontaine DD, McFadden LG, Gollapudi BB. Dose-response and operational thresholds/NOAELs for in vitro mutagenic effects from DNA-reactive mutagens, MMS and MNU. Mutat. Res. 2009;678:138–147. doi: 10.1016/j.mrgentox.2009.07.002. [DOI] [PubMed] [Google Scholar]
- 14.Gocke E, Müller L. In vivo studies in the mouse to define a threshold for the genotoxicity of EMS and ENU. Mutat. Res. 2009;678:101–107. doi: 10.1016/j.mrgentox.2009.04.005. [DOI] [PubMed] [Google Scholar]
- 15.Moustacchi E. DNA damage and repair: consequences on dose-responses. Mutat. Res. 2000;464:35–40. doi: 10.1016/s1383-5718(99)00164-3. [DOI] [PubMed] [Google Scholar]
- 16.Avlasevich SL, Bryce SM, Cairns SE, Dertinger SD. In vitro micronucleus scoring by flow cytometry: differential staining of micronuclei versus apoptotic and necrotic chromatin enhances assay reliability. Environ. Mol. Mutagen. 2006;47:56–66. doi: 10.1002/em.20170. [DOI] [PubMed] [Google Scholar]
- 17.Bryce SM, Bemis JC, Avlasevich SL, Dertinger SD. In vitro micronucleus assay scored by flow cytometry provides a comprehensive evaluation of cytogenetic damage and cytotoxicity. Mutat. Res. 2007;630:78–91. doi: 10.1016/j.mrgentox.2007.03.002. [DOI] [PMC free article] [PubMed] [Google Scholar]
- 18.Avlasevich SL, Bryce SM, Bemis JC, Dertinger SD. Miniaturized flow cytometry-based in vitro micronucleus assay discriminates aneugenic and clastogenic modes of action. Environ. Mol. Mutagen. 2010 doi: 10.1002/em.20618. in press. [DOI] [PubMed] [Google Scholar]
- 19.Lutz WK, Lutz RW. Statistical model to estimate a threshold dose and its confidence limits for the analysis of sublinear dose-response relationships, exemplified for mutagenicity data. Mutat. Res. 2009;678:118–122. doi: 10.1016/j.mrgentox.2009.05.010. [DOI] [PubMed] [Google Scholar]
- 20.Nüsse M, Kramer J. Flow cytometric analysis of micronuclei found in cells after irradiation. Cytometry. 1984;5:20–25. doi: 10.1002/cyto.990050105. [DOI] [PubMed] [Google Scholar]
- 21.Nüsse M, Beisker W, Kramer J, Miller BM, Schreiber GA, Viaggi S, Weller EM, Wessels JM. Measurement of micronuclei by flow cytometry. Methods Cell Biol. 1994;42Pt B:149–158. doi: 10.1016/s0091-679x(08)61072-9. (1994) [DOI] [PubMed] [Google Scholar]
- 22.Hecht SM. Bleomycin: new perspectives on the mechanism of action. J. Natl. Proc. 2000;63:158–168. doi: 10.1021/np990549f. [DOI] [PubMed] [Google Scholar]
- 23.Gocke E, Ballantyne M, Whitwell J, Müller L. MNT and Muta™ Mouse studies to define the in vivo dose response relations of the genotoxicity of EMS and ENU. Tox. Lett. 2009;190:286–297. doi: 10.1016/j.toxlet.2009.03.021. [DOI] [PubMed] [Google Scholar]
- 24.Müller L, Gocke E, Lavé T, Pfister T. Ethyl methanesulfonate toxicity in Viracept—a comprehensive human risk assessment based on threshold data for genotoxicity. Toxicol. Lett. 2009;190:317–329. doi: 10.1016/j.toxlet.2009.04.003. [DOI] [PubMed] [Google Scholar]
- 25.Pottenger LH, Schisler MR, Zhang F, Bartels MJ, Fontaine DD, McFadden LG, Gollapudi BB. Dose-response and operational thresholds/NOAELs for in vitro mutagenic effects from DNA-reactive mutagens, MMS and MNU. Mutat. Res. 2009;678:138–147. doi: 10.1016/j.mrgentox.2009.07.002. [DOI] [PubMed] [Google Scholar]
- 26.Platel A, Nesslany F, Gervais V, Marzin D. Study of oxidative DNA damage in TK6 human lymphoblastoid cells by use of the in vitro micronucleas test: Determination of No-Observed-Effect Levels. Mutat. Res. 2009;678:30–37. doi: 10.1016/j.mrgentox.2009.06.006. [DOI] [PubMed] [Google Scholar]


