

Abstract
Background/Rationale
Type 2 diabetes (T2DM) impairs hepatic clearance of atherogenic postprandial remnant lipoproteins. Our work and others’ identified syndecan-1 heparan sulfate proteoglycans (HSPGs) as remnant lipoprotein receptors. Nevertheless, the defects in T2DM liver had not been molecularly characterized, nor had the correction that occurs upon caloric restriction
Main Results
We used microarrays to compare expression of proteoglycan-related genes in livers from control db/m mice; obese, T2DM db/db littermates fed ad-libitum (AL); and db/db mice pair-fed to match the intake of db/m mice (PF). Surprisingly, the arrays identified only one gene whose dysregulation by T2DM would disrupt HSPG structure: the HS glucosamine-6-O-endosulfatase-2 (Sulf2). SULF2 degrades HSPGs by removing 6-O-sulfate groups, but had no previously known role in diabetes or lipoprotein biology. Follow-up quantitative PCR revealed a striking 11-fold induction of Sulf2 mRNA in livers of AL T2DM mice compared to controls. Immunoblots demonstrated induction of SULF2 in AL livers, with restoration towards normal in PF livers. Knock-down of SULF2 in cultured hepatocytes doubled HSPG-mediated catabolism of model remnant lipoproteins. Notably, co-immunoprecipitations revealed a persistent physical association of SULF2 with syndecan-1. To identify mechanisms of SULF2 dysregulation in T2DM, we found that advanced glycosylation end-products provoked a 10-fold induction in SULF2 expression by cultured hepatocytes and a ~50% impairment in their catabolism of remnants and VLDL, an effect that was entirely reversed by SULF2 knock-down. Adiponectin and insulin each suppressed SULF2 protein in cultured liver cells and in murine livers in vivo, consistent with a role in energy flux. Likewise, both hormones enhanced remnant lipoprotein catabolism in vitro.
Conclusions
SULF2 is an unexpected suppressor of atherogenic lipoprotein clearance by hepatocytes and an attractive target for inhibition.
Keywords: Adiponectin, advanced glycosylation end-products, insulin resistance, obesity, proteoglycans
Accelerated atherosclerotic cardiovascular disease remains the major cause of death in patients with diabetes and related syndromes.1 Atherosclerosis arises from the retention of cholesterol-rich, apolipoprotein-B (apoB)-containing lipoproteins within the vessel wall.2 Importantly, diabetic patients suffer from a unique and typically neglected aspect of cardiovascular risk, namely, the striking persistence of postprandial apoB-lipoproteins, called ‘remnants,’ in their plasma after each meal. A major cause is a defect in hepatic clearance of these harmful particles.3-6
A conspicuous impediment in this area had been our ignorance regarding pathways for remnant uptake into liver. Over a quarter century ago, hepatic uptake of remnants was shown to occur independently of LDL receptors.7 This realization launched a long, difficult search for the responsible molecules. Our work8 and others’9-12 implicated heparan sulfate proteoglycans (HSPGs) as remnant lipoprotein receptors (reviewed by5, 6, 13). Each HSPG molecule consists of a protein strand onto which the cell assembles sugar polymers, called heparan sulfate, that we showed could capture lipoproteins. Thus, the ligand-binding domains of these molecules are carbohydrate, not polypeptide. The liver contains several different species of HSPGs, from which our laboratory identified syndecan-1 as a strong candidate to participate in remnant lipoprotein clearance, based on its abundance along the sinusoidal surface of hepatic parenchymal cells and our finding that it directly mediates endocytosis of lipoproteins.13-15 These results were recently extended by the demonstration that syndecan-1 knock-out mice exhibit substantially impaired remnant lipoprotein clearance.16 Thus, the syndecan-1 HSPG is a major hepatic receptor for remnant lipoproteins.13, 15, 16
In the current study, we focused on type 2 diabetes (T2DM), a disease of considerable and increasing clinical impact.1, 5, 6 In T2DM and other syndromes of insulin resistance, the proteoglycans from liver17 and elsewhere18 exhibit subnormal charge density17, decreased heparan sulfation17, 18, and impaired binding to model remnant lipoproteins.17 Hyperphagic mice provide a suitable animal model, because they mimic humans who overeat and thereby develop the same downstream consequences, including obesity, insulin resistance, T2DM, and impaired remnant catabolism by the liver.19 To assess the effects of T2DM on the roughly 50 genes involved in HSPG assembly and disassembly, we used a highly annotated glycomic microarray20 to compare hepatic expression profiles in hyperphagic mice versus controls. Surprisingly, these arrays identified just one gene whose dysregulation would impair HSPG structure: the heparan sulfate glucosamine-6-O-endosulfatase-2 (Sulf2). This gene encodes an enzyme that degrades cell-surface HSPGs by removing 6-O-sulfates. The SULF2 enzyme has been studied so far only in the context of growth factor and morphogen signaling,21, 22 with no prior suspicion of a role in lipoprotein biology or diabetes.5, 6 Preliminary reports of this work were presented at the International Symposium on Atherosclerosis (June 2009, Boston, USA)23 and at the American Heart Association Scientific Sessions (November 2009, Orlando, USA).24
Experimental Procedures
Materials
Antibodies against SULF2 and the syndecan-1 core protein (catalogue #sc68436 and #sc-5632, Santa Cruz Biotechnology, Santa Cruz, CA), rat Sulf2 siRNA (#M-093673-00-0010, Smartpool, Dharmacon, Lafayette, CO), control siRNA, ELISA kits to quantify mouse adiponectin (#RD293023100R, BioVendor, Candler, NC) and insulin (#EZRMI-13K, Millipore, Billerica, MA), full-length adiponectin prepared in eukaryotic cells (fAd, Pepro Technology, Rocky Hill, NJ), and insulin (#I2643, Sigma Chemical Company, St. Louis, MO) were obtained commercially. AGEs were made by a six-week incubation of sterile, endotoxin-free bovine serum albumin (BSA, 100 mg/mL) with D-glucose (90 mg/mL). As a control, an aliquot of BSA was simultaneously incubated for six weeks in the same buffer but without D-glucose.
Primers and probes for qPCR were synthesized by the Gene Expression Facility at the University of North Carolina (Chapel Hill, NC, Dr. Hyung Suk Kim, director). Sequences for the mouse and rat Sulf2 reactions were: 5’-ggc tta gag acg gag gaa g-3’ (sense primer), 5’-ggt ctc ttc att tct ggc ca-3’ (antisense primer), and F-5’-tg aac aat aca ggc agt ttc agc ctg g-3’-Q (probe, where F and Q denote the positions of the fluorophore and quencher). Sequences for the mouse and rat Ppia (cyclophilin A) reactions were: 5’-atc tgc act gcc aag act ga-3’ (sense primer), 5’-cgc tcc atg gct tcc aca at-3’ (antisense primer), and F-5’-ct tcc caa aga cca cat gct tgc cat c-3’-Q (probe).
Type 2 diabetic mice and microarrays
We prepared three groups of mice to study using microarrays: phenotypically lean db/m mice at age 14 weeks (controls); obese, T2DM db/db (Leprdb/db) mice that we fed ad-libitum until age 14 weeks (AL); and db/db mice pair-fed from age eight to 14 weeks, to match the intake of the db/m mice during that period (PF). The background strain was C57BLKS, from Jackson Laboratory (Bar Harbor, ME), and the mice were male. Despite mild phenotypic changes, db/m mice do not develop T2DM under these conditions.25, 26 At age 14 weeks, mice were euthanized. Plasma samples were obtained for in-house assays of adiponectin and insulin concentrations, as well as lipid, lipoprotein, and hemoglobin A1c levels by the Vanderbilt Mouse Metabolic Phenotyping Center (Nashville, TN). The livers of these mice were promptly flushed in situ with cold phosphatebuffered saline, and tissue samples were obtained for RNA purification by Qiagen column and protein extraction using Sigma tissue lysis buffer. To accommodate biologic variability, each RNA sample for array analysis was pooled from the livers of three littermates undergoing the same treatment.20 Unpooled RNA samples from each mouse liver were set aside for subsequent qPCR, to confirm differentially expressed targets found on the arrays. Quality of RNA samples was verified with an Agilent Bioanalyzer (Agilent Technologies, Palo Alto, CA). The MessageAmp II-Biotin Enhanced Amplification kit (Ambion Inc, Austin,TX) was used to label each pooled RNA preparation before array hybridization. Arrays on three pooled RNA samples were run for each of the three treatment groups (i.e., nine animals/group; 27 mice total).
We used the GLYCOv3 oligonucleotide array, a custom Affymetrix GeneChip designed for the Consortium for Functional Glycomics. A complete description is available at http://www.functionalglycomics.org/static/consortium/resources.shtml.20 Our inspection of the list of probe set identifiers indicated that only heparanase was missing, and at our suggestion it has been added to newer versions of the array. Hybridization and scanning to the GLYCOv3 chip were performed according to protocols recommended by Affymetrix,27 using the Affymetrix GeneChip Scanner 3000. Chips have a background of <50 intensity units and a GAPDH 3’/5’ ratio below 1.5.
Cell culture and analyses
McArdle 7777 rat hepatoma cells were grown as previously described.28 To examine regulatory effects of AGEs, adiponectin, and insulin, cells were switched to medium with 2% serum for 2 hours and then supplemented with these reagents. Media supplemented with AGEs or insulin contained 2% FBS, whereas for adiponectin supplementation, we used serum from adiponectin knock-out mice.29 For dose-response studies, cells were assessed after 24h of exposure. For time-course studies, all cells were plated simultaneously and then harvested simultaneously; AGEs, adiponectin, and insulin were added at different times before the end of the experiment. At the end of these treatments, cells were assessed for protein expression by immunoblots, mRNA quantification by qPCR, and catabolism of model remnant lipoproteins, following our previously published methods.13, 28, 30 Model remnant lipoproteins were prepared by adding lipoprotein lipase (LpL), a key protein on remnants recognized by HSPGs, to 125I-labeled human LDL that we had methylated to an extent that blocks its binding to LDL receptors (125I-mLDL), thereby mimicking apoB48.13, 30 In some experiments, we also examined cellular catabolism of 125I-labeled VLDL,31, 32 which we prepared by ultracentrifugation of fasting human plasma33 followed by radioiodination34. The concentration (25 μg VLDL protein/ml medium) was chosen to mimic the plasma triglyceride levels in our mice.
Regulatory effects of adiponectin and insulin in vivo
To assess regulatory effects of adiponectin in vivo, we peritoneally injected adiponectin knockout mice (C57BL6/J background) with full-length adiponectin, three times/day for four days. Four hours after the last injection, 100μl blood samples from each mouse were collected for adiponectin ELISAs, the mice were euthanized, and liver samples were obtained. To assess regulatory effects of insulin in vivo, we performed qPCR and immunoblots on pre-existing frozen liver samples from control rats and rats subjected to euglycemic-hyperinsulinemic clamps, as described.35 All animals received humane care according to the criteria outlined in the Guide for the Care and Use of Laboratory Animals prepared by the National Academy of Sciences and published by the National Institutes of Health (NIH publication 86-23 revised 1985).
Statistical analyses
Raw expression values from the microarrays were normalized using the Robust Multichip Average expression summary (http://rmaexpress.bmbolstad.com/).36 Differential expression was determined using the open-source, open-development Limma package37 in the R programming language for statistical computing, available under the terms of the Free Software Foundation’s GNU General Public License. Comparisons between two or more experimental conditions involved calculating the fold change in expression levels and the adjusted p-value. The adjusted p-value corrects for multiple testing using Benjamini and Hochberg’s method to control the false discovery rate.38 The lists of differentially expressed genes were filtered for expression ratios >1.3.
Quantitative data from our other experiments were analyzed using SigmaStat version 3 (SPSS Inc., Chicago, IL). Normally distributed data are reported as means±SEMs. For comparisons between a single experimental group and a control, the unpaired, two-tailed t-test was used. For comparisons involving several groups simultaneously, ANOVA was initially used, followed by pairwise comparisons using the Student-Newman-Keuls q statistic. Non-normally distributed data are displayed as medians with individual measurements. Comparisons were performed using ANOVA on ranks followed by the SNK post-hoc test. In some cases, we log-transformed non-normally distributed data. Relationships between selected parameters were tested by the Spearman rank correlation coefficient. Differences and correlations were considered to be significant for P≤0.01, which also holds for the adjusted P-values from the microarrays.
Results
Type 2 diabetes robustly induces hepatic overexpression of SULF2 in vivo, and caloric restriction corrects hepatic levels of this enzyme towards normal
Control db/m, ad lib-fed (AL) db/db, and pair-fed (PF) db/db mice continuously gained weight throughout the study. By 14 weeks, body weights and plasma concentrations of hemoglobin A1c, triglycerides, and LDL cholesterol were significantly higher in AL over control mice but improved towards normal or completely normalized in the PF group (Table 1). Consistent with these metabolic data, plasma adiponectin values were significantly lower in the AL group than in control or PF mice. The pattern of hemoglobin A1c and insulin levels indicate insulin resistance in the AL group that improved in the PF group (Table 1). Thus, induction of T2DM in the AL group was successful, as was caloric restriction of the PF group, similar to previous results.19
Table 1.
Characteristics of control db/m, ad lib-fed (AL) db/db, and pair-fed (PF) db/db mice at 14 weeks of age (n=9/group). Means±SEMs are displayed and were initially analyzed by ANOVA.
| Control db/m | AL db/db | PF db/db | P by ANOVA | |
|---|---|---|---|---|
| Body weights (g) | 28.5±0.3a | 47.6±1.2b | 42.0±1.2c | <0.001 |
| Plasma levels: | ||||
| Hemoglobin A1c (%) | 4.16±0.03a | 11.3±0.64b | 7.70±0.32c | <0.001 |
| Ln [Insulin (ng/ml)] (Antilog of the mean) | 0.128±0.183a (1.14 ng/ml) | 1.01±0.25b (2.75 ng/ml) | 1.10±0.20b (3.00 ng/ml) | <0.01 |
| Ln [Triglycerides (mg/dl)] (Antilog of the mean) | 4.24±0.06a (69.4 mg/dl) | 4.75±.10b (116 mg/dl) | 4.66±0.06b (106 mg/dl) | <0.001 |
| LDL cholesterol (mg/dl) | 73.2±1.8a | 111±7.6b | 71.9±5.4a | <0.001 |
| Adiponectin (ng/ml) | 876±31a | 547±30b | 742±37c | <0.001 |
For each parameter, numbers labeled with different lowercase letters are statistically different by the Student-Newman-Keuls test (P<0.01). Normally distributed data were analyzed without transformations; non-normally distributed data became normally distributed after logtransformation. For clarity, we have displayed the antilogs of the means of logtransformed data (in parentheses, with units).
Glycomic microarrays of hepatic RNA from these mice revealed three clusters of mRNA signals for proteins that directly affect HSPG structure (the entire dataset is publicly available under Core E request #928, http://www.functionalglycomics.org/glycomics/publicdata/microarray.jsp). The first cluster of mRNAs from the arrays comprises participants in HSPG assembly that were not significantly affected by T2DM. Examples include the heparan sulfate N-deacetylase/N-sulfotransferase (Ndst)-2 isoform; the C5-epimerase (Glce); Ext2, one of two elongase isoforms that transfer glucuronyl and N-acetylglucosaminyl residues onto the growing HS chain; and the core proteins perlecan, agrin, and syndecan-2. Hepatic mRNA levels for each of these differed by less than 25% between AL db/db mice vs. db/m controls. Of note, the arrays revealed no significant change in hepatic levels of Ndst1 mRNA, in contrast to our prior finding that it is suppressed in T1DM livers.28, 39 Thus, T1DM and T2DM induce different molecular derangements in hepatic HSPG assembly and disassembly.
The second cluster comprises transcripts from a limited subset of HSPG assembly genes that were paradoxically increased by T2DM. There were exactly three in this cluster: the HS 6-O-sulfotransferase-3 (6ost-3; adjusted P-value among the three groups = 0.0034); Ext1, which is the other HS elongase isoform (P = 0.0053); and the syndecan-1 core protein (Sdc1; P = 0.00014). An increase in syndecan-1 core protein mRNA had previously been reported in livers from obese Zucker rats.17 Based on our work on syndecan-1 regulation,40 we speculate that the increase in syndecan-1 mRNA might arise from elevated FXR expression in db/db mouse livers.41
The third cluster comprises any gene whose dysregulation by T2DM would disrupt normal HSPG structure. Surprisingly, the arrays revealed only one member in this cluster: the heparan sulfate glucosamine-6-O-endosulfatase-2 (Sulf2), which showed a highly significant induction in T2DM livers (adjusted P-value = 0.0081). In contrast, our statistical analyses showed no significant difference in Sulf2 or, in fact, in any murine mRNA signal on the entire glycogene microarray between calorically restricted and ad lib-fed db/db mice (PF vs. AL groups). We28 and others42 reported that several key HSPG-related enzymes undergo substantial post-transcriptional regulation, which therefore became a major focus of our current studies of T2DM and SULF2.
To confirm the array findings, our follow-up quantitative real-time reverse-transcriptase PCR (qPCR) demonstrated a remarkable 11-fold increase in hepatic Sulf2 mRNA levels in AL db/db mice vs. db/m controls (Figure 1A). Also confirmed was the absence of a statistically significant difference in hepatic Sulf2 mRNA levels between AL vs. PF db/db mice, with the PF livers showing an unexpected trend towards an increase (Figure 1A). To address post-transcriptional effects, we performed immunoblots to detect hepatic SULF2 protein in the experimental three groups. Consistent with the induction of Sulf2 mRNA that we found in T2DM, our immunnoblots revealed a large increase in SULF2 protein levels in livers from ad lib-fed T2DM db/db mice (Figure 1B, AL vs. control group). Importantly, pair-feeding substantially lowered SULF2 protein levels in db/db livers to nearly normal (Figure 1B, PF group), despite continued elevation of Sulf2 mRNA.
Figure 1.
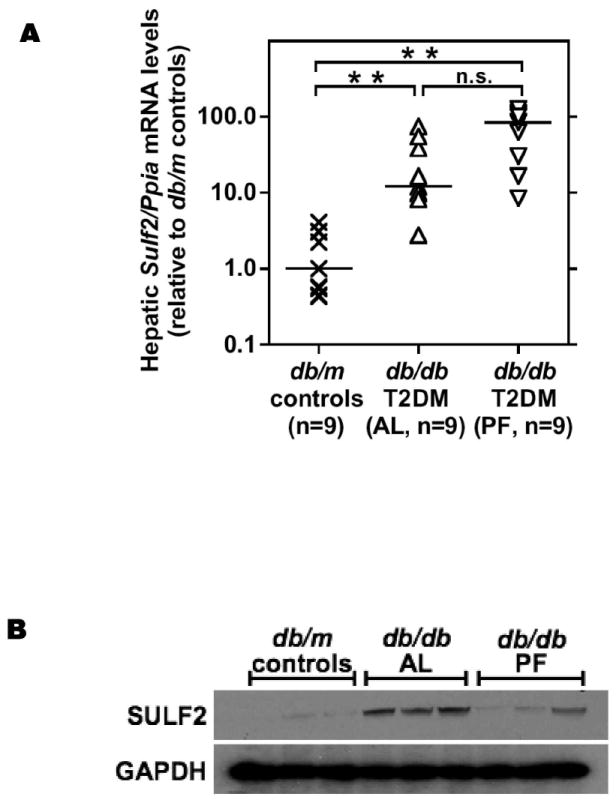
Type 2 diabetes robustly induces hepatic overexpression of the heparan sulfate glucosamine-6-O-endosulfatase-2 (SULF2) in association with hyperlipoproteinemia, and caloric restriction corrects hepatic levels of this enzyme towards normal.
RNA (panel A) and protein (panel B) were extracted from livers of 14-week old phenotypically lean db/m mice (controls), their obese, ad lib-fed T2DM db/db littermates (AL), and db/db mice that we pair-fed to match the intake of the db/m controls (PF). In Panel A, the y-axis displays individual Sulf2 mRNA levels assayed by qPCR, normalized to Ppia mRNA levels (ΔCt), and then expressed relative to the median control value (2-ΔΔCt). Median values are indicated by the short horizontal black lines, and individual values for all mice in each group are shown by X-symbols, upright triangles, and inverted triangles, respectively. P<0.001 by ANOVA on ranks; ** (P<0.01) or n.s. (not significant) for pairwise comparisons by SNK. Panel B displays immunoblots in triplicate for SULF2 and, as a loading control, glyceraldehyde-3-phosphate dehydrogenase (GAPDH). Each lane represents a sample from a different animal. Panel C: Plot of plasma triglyceride concentrations vs. hepatic Sulf2 mRNA levels for all control (X-symbols) and all T2DM AL (upright triangles) mice. Panel D: Plot of plasma LDL concentrations vs. hepatic Sulf2 mRNA levels from the same mice. Also displayed are calculated Spearman rank correlation coefficients (r) and their P-values.
To assess possible relationships between plasma lipid/lipoprotein concentrations and hepatic Sulf2 mRNA levels, we examined statistical correlations in control db/m and AL db/db mice (PF db/db mice were omitted from this analysis, because their Sulf2 mRNA levels in liver failed to track protein expression). A graph of plasma triglyceride concentrations vs. hepatic Sulf2 mRNA levels showed complete segregation of control mice, in the lower lefthand corner, from AL mice in the upper righthand sector (Figure 1C). A plot of plasma LDL concentrations vs. hepatic Sulf2 mRNA levels showed the same pattern (Figure 1D). In both cases, the calculated Spearman rank correlation coefficients were statistically significant.
Endogenous SULF2 strongly inhibits catabolism of model remnant lipoproteins by hepatic cells
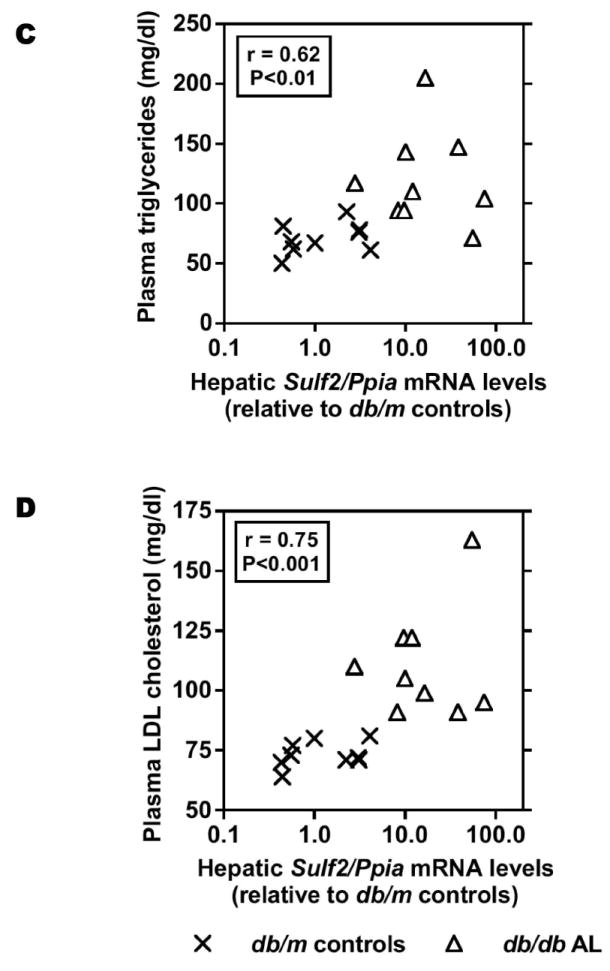
Removal of 6-O-sulfates by the SULF2 enzyme inhibits growth factor signaling,21 but by contrast, prior studies of LpL binding and remnant clearance emphasized the role of 2-O-sulfate groups.43, 44 To determine if endogenous SULF2 could affect HSPG-mediated uptake of model remnant lipoproteins, we used siRNA to partially knock it down in cultured rat McArdle 7777 hepatocytes. Knock-down of SULF2 significantly increased HSPG-mediated cell-surface binding, internalization, and degradation of model remnant lipoproteins by 70-90% (Figure 2A,B). Thus, endogenous SULF2 acts an inhibitor of remnant lipoprotein catabolism. Because the importance of heparan 6-O-linked sulfates in lipoprotein binding has been called into question,44 we sought an additional explanation for the clear inhibitory effect of SULF2 on the catabolism of remnants. Prior evidence suggests rapid substrate turn-over by SULF enzymes,45 yet our co-immunoprecipitations of McArdle cell homogenates revealed an unexpectedly persistent physical association of SULF2 with the syndecan-1 HSPG (Figure 2C), raising the possibility of non-enzymatic actions, such as ligand competition, independent of 6-O-sulfation. Knock-down of SULF2 depleted the amount associated with syndecan-1 to nearly undetectable levels (not shown).
Figure 2.
Endogenous SULF2 strongly inhibits the catabolism of model remnant lipoproteins by cultured liver cells.
McArdle hepatoma cells were pre-incubated for 24h with 100nM non-target (Control) or Sulf2 siRNA, as indicated, followed by an additional 44h at 37°C. Cells were then incubated for 4h at 37°C with model remnant lipoproteins that we prepared by combining 125I-labeled methylated LDL with lipoprotein lipase (LpL), a molecule that bridges between lipoproteins and HSPGs (background values were assessed in the absence of LpL). Panel A: Immunoblots of cellular homogenates, using anti-SULF2 antibodies or, as a loading control, anti-ß-actin antibodies. Panel B: LpL-dependent cellular catabolism of model remnant lipoproteins, shown as surface binding (Surf), internalization (Inter), and degradation (Degr), normalized to control values from cells treated with the nontarget siRNA (means±SEMs, n=3; the non-normalized control values were 194±2.9, 605±20.6, and 112±4.3 ng/mg, respectively). **, P<0.01 by the two-tailed Student’s t-test. Displayed are data from a representative experiment from a total of four independent knock-down studies. Panel C: Coimmunoprecipitation of SULF2 with the syndecan-1 HSPG. McArdle hepatocytes were extracted into NP-40 and subjected to immunoprecipitation with nonimmune IgG (IP: Mock) or anti-syndecan-1 IgG (IP: anti-SDC1), followed by electrophoretic separation. Displayed are immunoblots that were performed to detect SULF2 (IB: anti-SULF2), and then the same blots were stripped and reprobed to detect syndecan-1 (IB: anti-SDC1).
Regulation of SULF2 expression and remnant catabolism by metabolic factors in T2DM
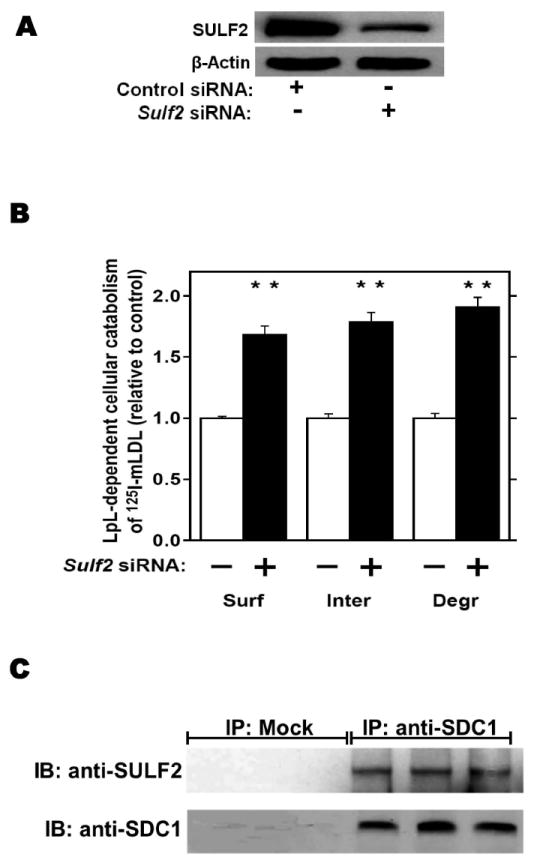
We investigated the effects of three key metabolic factors in T2DM, namely, advanced glycosylation end-products (AGEs), adiponectin, and insulin, on hepatocyte expression of SULF2 and on lipoprotein catabolism. Given our findings in T2DM in vivo (Figure 1), we were particularly interested in factors affecting SULF2 protein levels that did, or did not, also alter Sulf2 mRNA levels. Exposure of McArdle cells to AGEs caused a 10-fold induction of SULF2 protein, in a dose- and time-dependent manner (Figure 3A). Likewise, AGEs caused a 20-fold induction of Sulf2 mRNA (Figure 3B). Functionally, the exposure of McArdle cells to AGEs impaired catabolism of model remnant lipoproteins by ~50% (P <0.01), and this inhibitory effect was completely reversed by SULF2 knock-down (Figure 3C). The same effects were seen with catabolism of 125I-labeled VLDL (Figure 3D). Thus, AGEs substantially induce SULF2 protein and mRNA and impair catabolism of remnant lipoproteins and VLDL. Importantly, the entire ability of AGEs to alter catabolism of these lipoproteins by hepatocytes appears to be mediated through its induction of SULF2.
Figure 3.
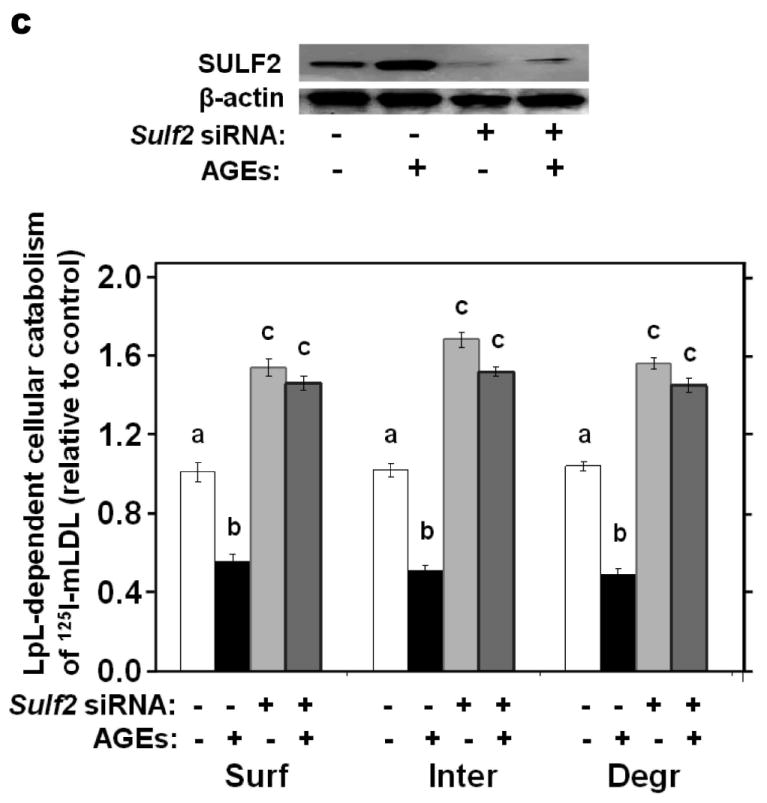
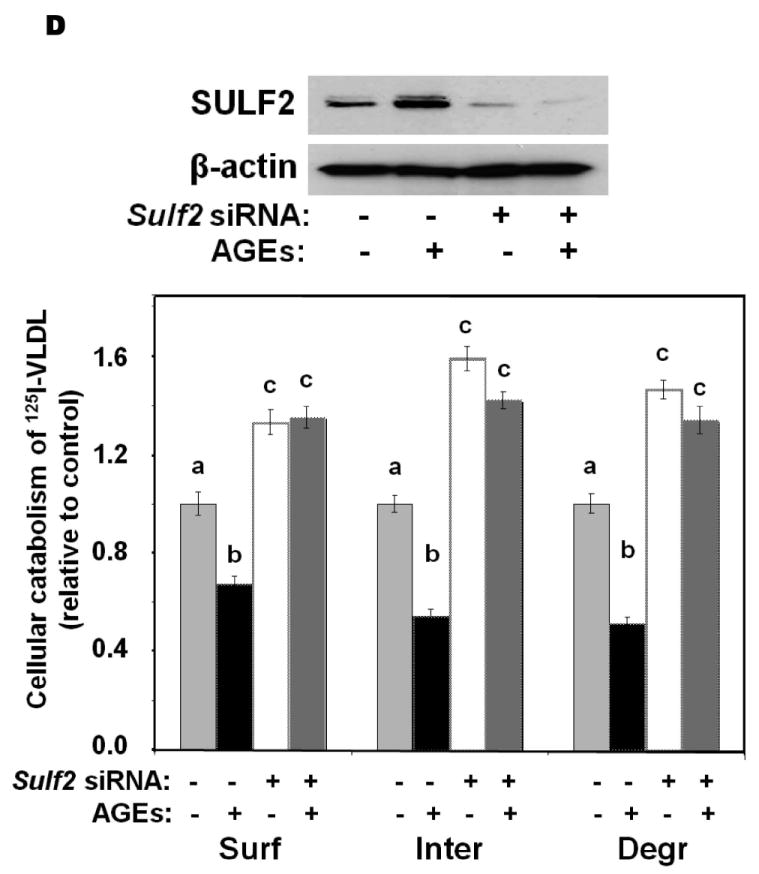
Advanced glycosylation end-products (AGEs) augment expression of SULF2 by cultured liver cells, thereby inhibiting catabolism of model remnant lipoproteins and VLDL.
Panel A: Dose-response (upper images) and time course (lower images) of SULF2 protein induction by AGEs. The dose-response involved a 24-h incubation of McArdle hepatoma cells with the indicated concentrations of AGEs, plus an amount of BSA to bring the total supplemented protein in each well to 400 μg/ml. As described in the Methods, cells in each time course of SULF2 regulation in vitro were harvested simultaneously. Here, 200 μg AGEs/ml was added at the indicated times before harvest. Displayed are immunoblots of cellular homogenates, using anti-SULF2 or anti-ß-actin antibodies. Panel B: Time course of Sulf2 mRNA induction by AGEs (200 μg/ml). Displayed are Sulf2 mRNA levels assayed by qPCR, normalized to Ppia mRNA levels, and then expressed relative to the unexposed control at 0 h (means±SEM, n=3). P<0.001 by ANOVA; **, P<0.01 compared to the unexposed control by the Student- Newman-Keuls test. Panels C and D: Effects of AGEs on catabolism of remnant lipoproteins (C) or VLDL (D) by cultured liver cells, without and with SULF2 knock-down. McArdle hepatoma cells were incubated for three consecutive 24-h periods at 37°C. The first 24-h period was with 100nM non-target siRNA or Sulf2 siRNA, as indicated by minus (−) and plus (+) Sulf2 siRNA, respectively. Cells were rinsed to remove the siRNAs, then incubated in serum-containing medium for a second 24-h period. During the final 24h, 200μg of either BSA or AGEs per ml were added, as indicated by minus and plus AGEs, respectively. Lipoprotein catabolism was examined during the last 4h of this final 24-h period. The upper images in these two panels show immunoblots of cellular homogenates. In panel C, the column graph displays LpL-dependent surface binding, internalization, and degradation of model remnant lipoproteins, normalized to control values from cells treated with the non-target siRNA and without AGEs (means±SEMs, n=3; the non-normalized control values were 242±3.4, 626±7.1, and 103±4.6ng/mg, respectively). In panel D, the column graph displays normalized values for surface binding, internalization, and degradation of labeled VLDL (means±SEMs, n=3; the non-normalized control values were 18.58±0.3, 78.86±0.9, and 59.89±0.35ng/mg, respectively). Within each of the three displayed groups of quantitative data, P<0.001 by ANOVA, and columns labeled with different lowercase letters are statistically different by the Student-Newman-Keuls test (P<0.01). Displayed are data from representative experiments from a total of four independent dose-response, time-course, and lipoprotein catabolism studies.
We next examined regulatory effects of adiponectin. Suppression of plasma adiponectin levels is a prominent feature of obesity and T2DM (reference46 and Table 1), but not of T1DM. Addition of physiologic concentrations of adiponectin to cultured McArdle hepatocytes suppressed SULF2 levels by ~90%, with essentially the entire effect apparent by 2h and persisting for at least 36h (Figure 4A). Physiologic concentrations of adiponectin also suppressed Sulf2 mRNA (Figure 4B). To determine the role of this adipokine in vivo, we found that livers from adiponectin knock-out mice29 exhibited substantially increased levels of SULF2 protein and mRNA, both of which were normalized by 4d of intraperitoneal adiponectin injections (Figure 4C,D). Similar to the effects of siRNA knock-down, addition of adiponectin to cultured McArdle hepatocytes suppressed SULF2 protein levels and enhanced surface binding, internalization, and lysosomal degradation of model remnant lipoproteins (Figure 4E).
Figure 4.

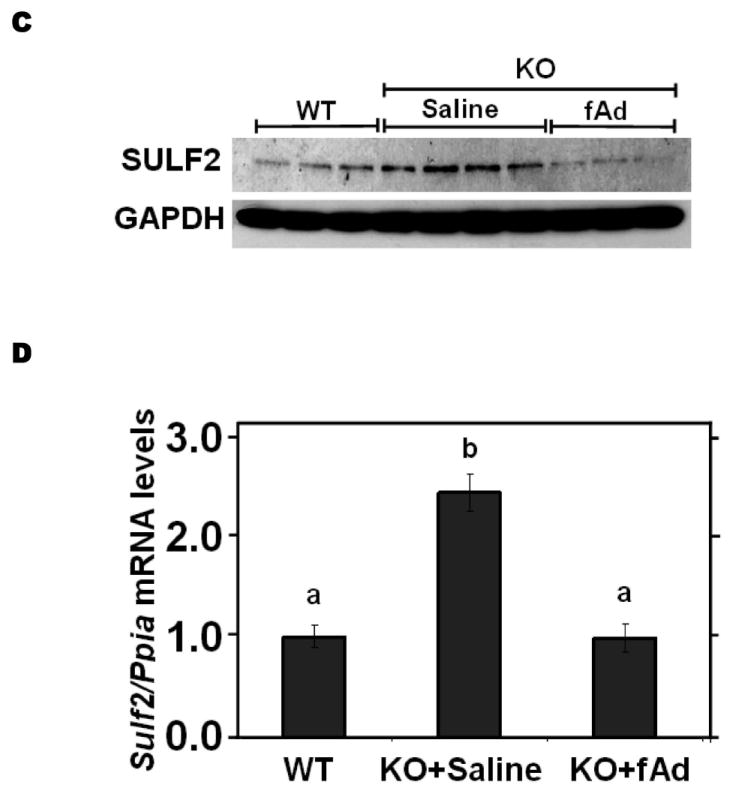
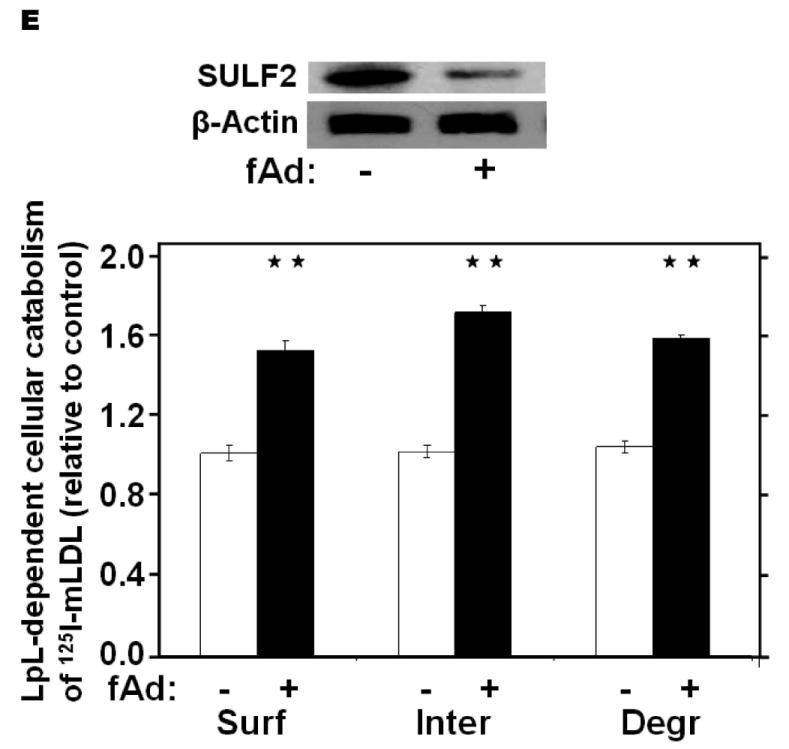
Adiponectin suppresses SULF2 expression by cultured liver cells and in murine livers in vivo, and enhances remnant lipoprotein catabolism in vitro. Panel A: Dose-response (upper images) and time course (lower images) of SULF2 protein suppression by adiponectin. The dose-response involved a 24-h incubation of McArdle hepatoma cells with the indicated concentrations of adiponectin, where zero indicates adiponectin-free medium. In the time course, 6 μg adiponectin/ml was added at the indicated times before harvest. Displayed are immunoblots of cellular homogenates. Panel B: Time course of Sulf2 mRNA suppression by a physiologic concentration of adiponectin (6 μg/ml). Displayed are Sulf2 mRNA levels, normalized to Ppia, and then expressed relative to the unexposed control at 0 h (means±SEM, n=3). P<0.001 by ANOVA; **, P<0.01 compared to the unexposed control by the Student-Newman-Keuls test. Panel C: Regulation of hepatic SULF2 protein levels by adiponectin in vivo. Protein was extracted from livers of wild-type C57BL/6J mice (WT, n=3) and adiponectinknockout mice that had been injected with either saline (KO+Saline, n=4) or fulllength adiponectin (KO+fAd, n=3, 25μg/mouse, three times/day for four days). Plasma adiponectin concentrations in these mice 4h after the last injection were 20.86±1.23, 0.41±0.013, and 6.16±1.08 μg/ml, respectively. Displayed are immunoblots for SULF2 and GAPDH. Panel D: Regulation of hepatic Sulf2 mRNA levels by adiponectin in vivo. RNA was extracted from the same livers as in Panel C. Levels of Sulf2 mRNA level were assessed by qPCR, normalized to Ppia, and then expressed relative to wild-type (means±SEM, n=3-4), P<0.001 by ANOVA. Columns labeled with different lowercase letters are statistically different by the Student-Newman-Keuls test (P<0.01). Panel E: Effects of adiponectin on remnant lipoprotein catabolism by cultured liver cells. McArdle hepatoma cells were incubated for 24h in adiponectin-free medium (minus symbols and open columns) or medium supplemented with 6 μg adiponectin/ml (plus symbols and black columns). The upper images show immunoblots of cellular homogenates. The column graph displays LpL-dependent surface binding, internalization, and degradation of model remnant lipoproteins, normalized to control values from cells incubated without adiponectin (means±SEMs, n=3; the non-normalized control values were 179±3.5, 618±43.4, and 37±1.1ng/mg, respectively). **, P<0.01 by the two-tailed Student’s t-test.
Insulin resistance is the hallmark of T2DM. Exposure of McArdle hepatoma cells to physiologic concentrations of insulin for 24h suppressed cellular SULF2 protein levels by ~80% (3 & 10 nM insulin, Figure 5A). In contrast to the rapidity of insulin-induced signaling, which takes seconds to minutes, suppression of SULF2 by insulin took 4-8h to become apparent and lasted at least 32h (Figure 5A). This delay in onset may reflect the need to degrade pre-existing SULF2 protein, to lower cellular levels. Unlike AGEs or adiponectin, but like caloric restriction, insulin altered SULF2 protein levels without significantly affecting Sulf2 mRNA levels (Figure 5B). To examine regulation in vivo, we found that a 4-h normoglycemic, hyperinsulinemic clamp suppressed SULF2 protein in rat livers to nearly undetectable levels while producing a non-significant increase in hepatic Sulf2 mRNA (Figure 5C,D). Consistent with a key role for SULF2 in the regulation of remnant lipoprotein catabolism, the addition of insulin to suppress SULF2 expression by cultured hepatoma cells significantly enhanced their catabolism of model remnant lipoproteins (Figure 5E).
Figure 5.
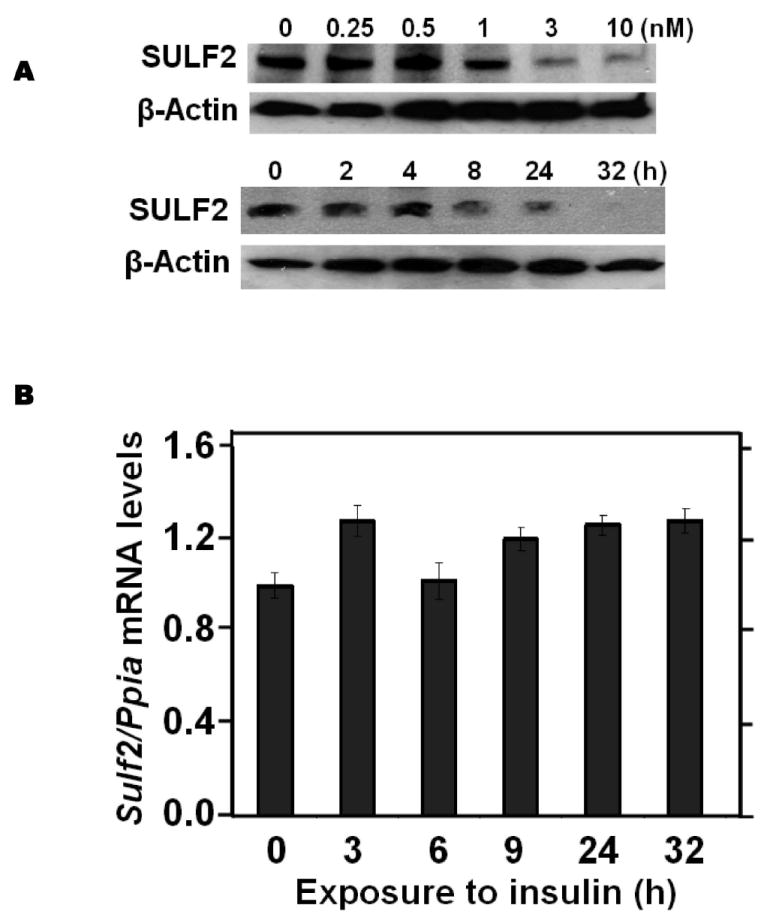
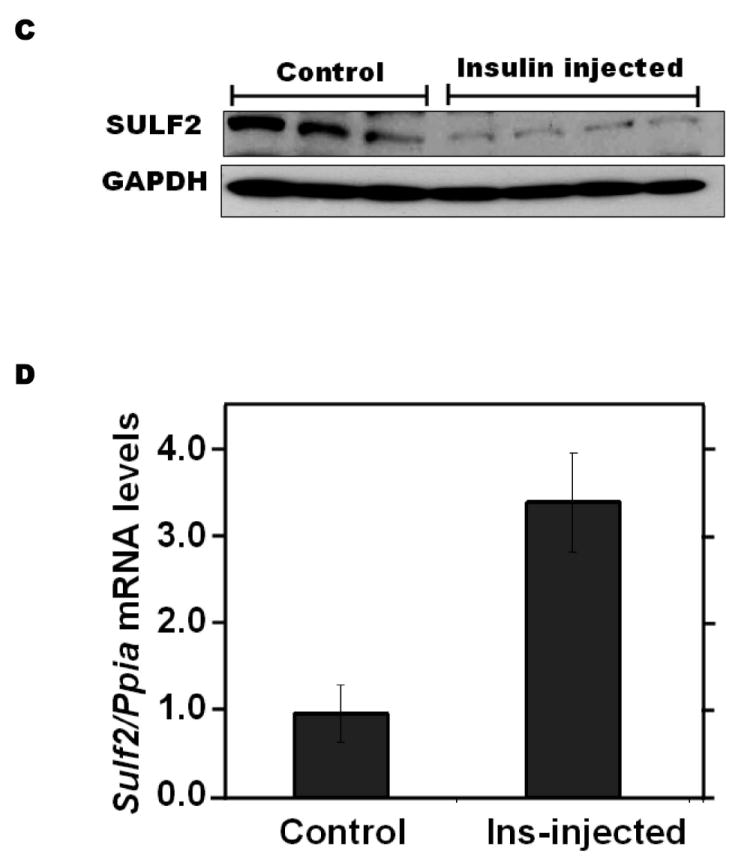

Insulin suppresses SULF2 protein, but not mRNA, in cultured liver cells and in murine livers in vivo, and enhances remnant lipoprotein catabolism in vitro.
Panel A: Dose-response (upper images) and time course (lower images) of SULF2 protein suppression by insulin. The dose-response involved a 24-h incubation of McArdle hepatoma cells with the indicated concentrations of insulin. In the time course, 3 nM insulin was added at the indicated times before harvest. Displayed are immunoblots of cellular homogenates. Panel B: Time course of Sulf2 mRNA levels during exposure to a physiologic concentration of insulin (3 nM). Displayed are Sulf2 mRNA levels, normalized to Ppia, and then expressed relative to the unexposed control at 0 h (means±SEM, n=3; N.S. by ANOVA). Panel C: Regulation of hepatic SULF2 protein levels by insulin in vivo. Sprague-Dawley rats were subjected to euglycemic-hyperinsulinemic clamps (4.8 mU insulin/kg/min) for four hours (Insulin injected); control rats received saline/glycerol. Protein was extracted from frozen liver samples. Displayed are immunoblots for SULF2 and GAPDH. Panel D: Hepatic Sulf2 mRNA levels after insulin injections in vivo. RNA was extracted from the same livers as in Panel C. Levels of Sulf2 mRNA were measured by qPCR, normalized to Ppia, and then expressed relative to control (means±SEM, n=3-4; N.S. by ANOVA). Panel E: Effects of insulin on remnant lipoprotein catabolism by cultured liver cells. McArdle hepatoma cells were incubated for 24h without (minus symbols and open columns) or with 10 nM insulin (plus symbols and black columns). The upper images show immunoblots of cellular homogenates. The column graph displays LpL-dependent surface binding, internalization, and degradation of model remnant lipoproteins, normalized to control values from cells incubated without insulin (means±SEMs, n=3; this experiment was performed simultaneously with the one displayed in Figure 4E). **, P<0.01 by the two-tailed Student’s t-test.
Discussion
In the current study, we identified an unexpected participant in lipoprotein clearance, namely, the heparan sulfate 6-O-endosulfatase-2 (SULF2), which exhibits a striking induction in the livers of obese, T2DM mice and robustly inhibits the catabolism of model remnant lipoproteins and VLDL by cultured liver cells. Moreover, despite the existence of roughly 50 genes involved in hepatic HSPG assembly and disassembly, our results so far indicate dysregulation of only a few of them in diabetes. The Sulf2 mRNA was the sole transcript identified on the GLYCOv3 arrays that was affected by T2DM in a way that would impair HSPG structure and hence HSPG function as remnant lipoprotein receptors.
Several groups have advocated an atherogenic role for postprandial particles, which carry substantial amounts of cholesterol.47-51 Like LDL, postprandial apoB-lipoproteins penetrate into the arterial wall and become retained there.50, 52, 53 Importantly, postprandial dyslipoproteinemia has been linked to the development of arterial lesions49 and cardiovascular events.50, 54, 55 Regarding reversibility, moderate caloric restriction of obese, T2DM mice corrects their defect in remnant lipoprotein clearance,19 and similar effects occur in human diabetic subjects after short-term weight loss.56 The improvements in hepatic clearance of remnant lipoproteins upon weight loss had remained completely uncharacterized on a molecular level.5, 6 Our current results indicate a role for induction of SULF2 by T2DM and then suppression of SULF2 by caloric restriction (Figure 1B). Notably, regulation of SULF2 under these conditions occurs at both the level of mRNA (in the AL group) and post-transcriptionally (in the PF group), consistent with a role for insulin resistance as well as other factors.
The identification of SULF2 may considerably simplify this therapeutic problem in T2DM. It is generally easier to inhibit or suppress a protein than it is to boost it. Our results could convert the challenge of impaired remnant receptor function into the far more tractable pharmacologic problem of one overproduced protein. Thus, SULF2 should now become an attractive target for inhibition or suppression, to correct postprandial dyslipoproteinemia. Moreover, if SULF2 is overexpressed in other tissues in T2DM, such as skin, local inhibition of excess enzyme might improve growth factor function and hence wound healing.
Taken together, our work provides a compelling pathophysiologic model, in which AGEs, hypoadiponectinemia, and insulin resistance in T2DM induce abnormal upregulation of SULF2 in the liver and thereby impair syndecan-1 HSPG function in remnant clearance. Hepatic overexpression of SULF2 provides a novel molecular mechanism that contributes to postprandial dyslipoproteinemia and hence arterial harm in T2DM and related disorders.
Acknowledgments
We thank Dr. Lawrence Chan of Baylor College of Medicine for his generous gift of adiponectin knock-out mice.
Financial support: This work was supported by NIH-USA grants HL73898, HL93321, HL94277, DK43396 (KJW), and GM62116 (LS); the Ruth and Yonatan Ben-Avraham Fund; and the Louise A. Havens Foundation for Diabetes Research and Treatment.
List of abbreviations
- AL
ad-libitum
- AGEs
advanced glycosylation end-products
- apoB
apolipoprotein-B
- fAd
full-length adiponectin
- SULF2
the heparan sulfate glucosamine-6-O-endosulfatase-2
- NDST
heparan sulfate N-deacetylase/N-sulfotransferase
- HSPGs
heparan sulfate proteoglycans
- PF
pair-fed
- qPCR
quantitative real-time reverse-transcriptase PCR
- SDC1
syndecan-1
- T1DM
type 1 diabetes mellitus
- T2DM
type 2 diabetes
Contributor Information
Keyang Chen, Email: kary99@temple.edu.
Ming-Lin Liu, Email: mlliu@temple.edu.
Lana Schaffer, Email: schaffer@scripps.edu.
Mingzhen Li, Email: bestlmz@temple.edu.
Guenther Boden, Email: Guenther.Boden@tuhs.temple.edu.
Xiangdong Wu, Email: xiangdong.wu@temple.edu.
Kevin Jon Williams, Email: kjwilliams@temple.edu.
References
- 1.Buse JB, Ginsberg HN, Bakris GL, Clark NG, Costa F, Eckel R, Fonseca V, et al. Primary prevention of cardiovascular diseases in people with diabetes mellitus: A scientific statement from the American Heart Association and the American Diabetes Association. Diabetes Care. 2007;30:162–172. doi: 10.2337/dc07-9917. [DOI] [PubMed] [Google Scholar]
- 2.Williams KJ, Tabas I. The response-to-retention hypothesis of early atherogenesis. Arterioscler Thromb Vasc Biol. 1995;15:551–561. doi: 10.1161/01.atv.15.5.551. [DOI] [PMC free article] [PubMed] [Google Scholar]
- 3.Dane-Stewart CA, Watts GF, Barrett PH, Stuckey BG, Mamo JC, Martins IJ, Redgrave TG. Chylomicron remnant metabolism studied with a new breath test in postmenopausal women with and without type 2 diabetes mellitus. Clin Endocrinol (Oxf) 2003;58:415–420. doi: 10.1046/j.1365-2265.2003.01731.x. [DOI] [PubMed] [Google Scholar]
- 4.Hogue JC, Lamarche B, Tremblay AJ, Bergeron J, Gagne C, Couture P. Evidence of increased secretion of apolipoprotein B-48-containing lipoproteins in subjects with type 2 diabetes. J Lipid Res. 2007;48:1336–1342. doi: 10.1194/jlr.M600548-JLR200. [DOI] [PubMed] [Google Scholar]
- 5.Williams KJ. Molecular processes that handle - and mishandle - dietary lipids. J Clin Invest. 2008;118:3247–3259. doi: 10.1172/JCI35206. [DOI] [PMC free article] [PubMed] [Google Scholar]
- 6.Williams KJ, Chen K. Recent insights into factors affecting remnant lipoprotein uptake. Curr Opin Lipidol. 2010;21:218–228. doi: 10.1097/MOL.0b013e328338cabc. [DOI] [PubMed] [Google Scholar]
- 7.Kita T, Goldstein JL, Brown MS, Watanabe Y, Hornick CA, Havel RJ. Hepatic uptake of chylomicron remnants in WHHL rabbits: a mechanism genetically distinct from the low density lipoprotein receptor. Proc Natl Acad Sci USA. 1982;79:3623–3627. doi: 10.1073/pnas.79.11.3623. [DOI] [PMC free article] [PubMed] [Google Scholar]
- 8.Williams KJ, Fless GM, Petrie KA, Snyder ML, Brocia RW, Swenson TL. Mechanisms by which lipoprotein lipase alters cellular metabolism of lipoprotein(a), low density lipoprotein, and nascent lipoproteins. Roles for low density lipoprotein receptors and heparan sulfate proteoglycans. J Biol Chem. 1992;267:13284–13292. [PubMed] [Google Scholar]
- 9.Ji ZS, Fazio S, Mahley RW. Variable heparan sulfate proteoglycan binding of apolipoprotein E variants may modulate the expression of type III hyperlipoproteinemia. J Biol Chem. 1994;269:13421–13428. [PubMed] [Google Scholar]
- 10.Mann WA, Meyer N, Weber W, Meyer S, Greten H, Beisiegel U. Apolipoprotein E isoforms and rare mutations: parallel reduction in binding to cells and to heparin reflects severity of associated type III hyperlipoproteinemia. J Lipid Res. 1995;36:517–525. [PubMed] [Google Scholar]
- 11.Ebara T, Conde K, Kako Y, Liu YZ, Xu Y, Ramakrishnan R, Goldberg IJ, et al. Delayed catabolism of apoB-48 lipoproteins due to decreased heparan sulfate proteoglycan production in diabetic mice. J Clin Invest. 2000;105:1807–1818. doi: 10.1172/JCI8283. [DOI] [PMC free article] [PubMed] [Google Scholar]
- 12.MacArthur JM, Bishop JR, Stanford KI, Wang L, Bensadoun A, Witztum JL, Esko JD. Liver heparan sulfate proteoglycans mediate clearance of triglyceride-rich lipoproteins independently of LDL receptor family members. J Clin Invest. 2007;117:153–164. doi: 10.1172/JCI29154. [DOI] [PMC free article] [PubMed] [Google Scholar]
- 13.Fuki IV, Kuhn KM, Lomazov IR, Rothman VL, Tuszynski GP, Iozzo RV, Swenson TL, et al. The syndecan family of proteoglycans: novel receptors mediating internalization of atherogenic lipoproteins in vitro. J Clin Invest. 1997;100:1611–1622. doi: 10.1172/JCI119685. [DOI] [PMC free article] [PubMed] [Google Scholar]
- 14.Williams KJ, Fuki IV. Cell-surface heparan sulfate proteoglycans: dynamic molecules mediating ligand catabolism. Curr Opin Lipidol. 1997;8:253–262. doi: 10.1097/00041433-199710000-00003. [DOI] [PubMed] [Google Scholar]
- 15.Fuki IV, Meyer ME, Williams KJ. Transmembrane and cytoplasmic domains of syndecan mediate a multi-step endocytic pathway involving detergentinsoluble membrane rafts. Biochem J. 2000;351:607–612. [PMC free article] [PubMed] [Google Scholar]
- 16.Stanford KI, Bishop JR, Foley EM, Gonzales JC, Niesman IR, Witztum JL, Esko JD. Syndecan-1 is the primary heparan sulfate proteoglycan mediating hepatic clearance of triglyceride-rich lipoproteins in mice. J Clin Invest. 2009;119:3236–3245. doi: 10.1172/JCI38251. [DOI] [PMC free article] [PubMed] [Google Scholar]
- 17.Olsson U, Egnell AC, Lee MR, Lunden GO, Lorentzon M, Salmivirta M, Bondjers G, et al. Changes in matrix proteoglycans induced by insulin and fatty acids in hepatic cells may contribute to dyslipidemia of insulin resistance. Diabetes. 2001;50:2126–2132. doi: 10.2337/diabetes.50.9.2126. [DOI] [PubMed] [Google Scholar]
- 18.Rohrbach DH, Hassell JR, Kleinman HK, Martin GR. Alterations in the basement membrane (heparan sulfate) proteoglycan in diabetic mice. Diabetes. 1982;31:185–188. doi: 10.2337/diab.31.2.185. [DOI] [PubMed] [Google Scholar]
- 19.Martins IJ, Tran JM, Redgrave TG. Food restriction normalizes chylomicron remnant metabolism in murine models of obesity as assessed by a novel stable isotope breath test. J Nutr. 2002;132:176–181. doi: 10.1093/jn/132.2.176. [DOI] [PubMed] [Google Scholar]
- 20.Comelli EM, Head SR, Gilmartin T, Whisenant T, Haslam SM, North SJ, Wong NK, et al. A focused microarray approach to functional glycomics: transcriptional regulation of the glycome. Glycobiology. 2006;16:117–131. doi: 10.1093/glycob/cwj048. [DOI] [PubMed] [Google Scholar]
- 21.Uchimura K, Morimoto-Tomita M, Rosen SD. Measuring the activities of the Sulfs: two novel heparin/heparan sulfate endosulfatases. Methods Enzymol. 2006;416:243–253. doi: 10.1016/S0076-6879(06)16015-2. [DOI] [PubMed] [Google Scholar]
- 22.Lai JP, Sandhu DS, Yu C, Han T, Moser CD, Jackson KK, Guerrero RB, et al. Sulfatase 2 up-regulates glypican 3, promotes fibroblast growth factor signaling, and decreases survival in hepatocellular carcinoma. Hepatology. 2008;47:1211–1222. doi: 10.1002/hep.22202. [DOI] [PMC free article] [PubMed] [Google Scholar]
- 23.Chen K, Liu M-L, Schaffer L, Li M, Williams KJ. Type 2 diabetes strongly induces hepatic overexpression of Sulf2, a novel factor that suppresses uptake of remnant lipoproteins [Abstract] Atheroscler Suppl. 2009;10(2):e280. [Google Scholar]
- 24.Chen K, Liu M-L, Li M, Boden G, Wu X, Williams KJ. Metabolic factors in type 2 diabetes augment hepatocyte expression of SULF2, a novel suppressor of remnant lipoprotein uptake [Abstract] Circulation. 2009;120(suppl.):S1175. [Google Scholar]
- 25.Chung WK, Belfi K, Chua M, Wiley J, Mackintosh R, Nicolson M, Boozer CN, et al. Heterozygosity for Lepob or Leprdb affects body composition and leptin homeostasis in adult mice. Am J Physiol. 1998;274:R985–990. doi: 10.1152/ajpregu.1998.274.4.R985. [DOI] [PubMed] [Google Scholar]
- 26.Yamashita H, Shao J, Ishizuka T, Klepcyk PJ, Muhlenkamp P, Qiao L, Hoggard N, et al. Leptin administration prevents spontaneous gestational diabetes in heterozygous Leprdb/+ mice: effects on placental leptin and fetal growth. Endocrinology. 2001;142:2888–2897. doi: 10.1210/endo.142.7.8227. [DOI] [PubMed] [Google Scholar]
- 27.Lockhart DJ, Dong H, Byrne MC, Follettie MT, Gallo MV, Chee MS, Mittmann M, et al. Expression monitoring by hybridization to high-density oligonucleotide arrays. Nat Biotechnol. 1996;14:1675–1680. doi: 10.1038/nbt1296-1675. [DOI] [PubMed] [Google Scholar]
- 28.Williams KJ, Liu M-L, Zhu Y, Xu X, Davidson WR, McCue P, Sharma K. Loss of heparan N-sulfotransferase in diabetic liver: role of angiotensin II. Diabetes. 2005;54:1116–1122. doi: 10.2337/diabetes.54.4.1116. [DOI] [PubMed] [Google Scholar]
- 29.Ma K, Cabrero A, Saha PK, Kojima H, Li L, Chang BH, Paul A, et al. Increased beta-oxidation but no insulin resistance or glucose intolerance in mice lacking adiponectin. J Biol Chem. 2002;277:34658–34661. doi: 10.1074/jbc.C200362200. [DOI] [PubMed] [Google Scholar]
- 30.Williams KJ. Interactions of lipoproteins with proteoglycans. Methods Mol Biol. 2001;171:457–477. doi: 10.1385/1-59259-209-0:457. [DOI] [PubMed] [Google Scholar]
- 31.Bierman EL, Stein O, Stein Y. Lipoprotein uptake and metabolism by rat aortic smooth muscle cells in tissue culture. Circ Res. 1974;35:136–150. doi: 10.1161/01.res.35.1.136. [DOI] [PubMed] [Google Scholar]
- 32.Goldstein JL, Basu SK, Brown MS. Receptor-mediated endocytosis of lowdensity lipoprotein in cultured cells. Methods Enzymol. 1983;98:241–260. doi: 10.1016/0076-6879(83)98152-1. [DOI] [PubMed] [Google Scholar]
- 33.Havel RJ, Eder HA, Bragdon JH. The distribution and chemical composition of ultracentrifually separated lipoproteins in human serum. J Clin Invest. 1955;34:1345–1353. doi: 10.1172/JCI103182. [DOI] [PMC free article] [PubMed] [Google Scholar]
- 34.Bilheimer DW, Eisenberg S, Levy RI. The metabolism of very low density lipoprotein proteins. I. Preliminary in vitro and in vivo observations. Biochim Biophys Acta. 1972;260:212–221. doi: 10.1016/0005-2760(72)90034-3. [DOI] [PubMed] [Google Scholar]
- 35.Boden G, Song W, Pashko L, Kresge K. In vivo effects of insulin and free fatty acids on matrix metalloproteinases in rat aorta. Diabetes. 2008;57:476–483. doi: 10.2337/db07-1261. [DOI] [PubMed] [Google Scholar]
- 36.Irizarry RA, Bolstad BM, Collin F, Cope LM, Hobbs B, Speed TP. Summaries of Affymetrix GeneChip probe level data. Nucleic Acids Res. 2003;31:e15. doi: 10.1093/nar/gng015. [DOI] [PMC free article] [PubMed] [Google Scholar]
- 37.Smyth GK. Linear models and empirical bayes methods for assessing differential expression in microarray experiments. Stat Appl Genet Mol Biol. 2004;3 doi: 10.2202/1544-6115.1027. Article3. [DOI] [PubMed] [Google Scholar]
- 38.Benjamini Y, Hochberg Y. Controlling the false discovery rate: a practical and powerful approach to multiple testing. J R Stat Soc Series B Stat Methodol. 1995;57:289–300. [Google Scholar]
- 39.Goldberg IJ, Hu Y, Noh HL, Wei J, Huggins LA, Rackmill MG, Hamai H, et al. Decreased lipoprotein clearance is responsible for increased cholesterol in LDL receptor knockout mice with streptozotocin-induced diabetes. Diabetes. 2008;57:1674–1682. doi: 10.2337/db08-0083. [DOI] [PubMed] [Google Scholar]
- 40.Anisfeld AM, Kast-Woelbern HR, Meyer ME, Jones SA, Zhang Y, Williams KJ, Willson T, et al. Syndecan-1 expression is regulated in an isoformspecific manner by the farnesoid-X receptor. J Biol Chem. 2003;278:20420–20428. doi: 10.1074/jbc.M302505200. [DOI] [PubMed] [Google Scholar]
- 41.Zhang Y, Lee FY, Barrera G, Lee H, Vales C, Gonzalez FJ, Willson TM, et al. Activation of the nuclear receptor FXR improves hyperglycemia and hyperlipidemia in diabetic mice. Proc Natl Acad Sci USA. 2006;103:1006–1011. doi: 10.1073/pnas.0506982103. [DOI] [PMC free article] [PubMed] [Google Scholar]
- 42.Grobe K, Esko JD. Regulated translation of heparan sulfate N-acetylglucosamine N-deacetylase/N-sulfotransferase isozymes by structured 5’-untranslated regions and internal ribosome entry sites. J Biol Chem. 2002;277:30699–30706. doi: 10.1074/jbc.M111904200. [DOI] [PubMed] [Google Scholar]
- 43.Parthasarathy N, Goldberg IJ, Sivaram P, Wagner WD. Isolation of heparin-derived oligosaccharides containing 2-O-sulfated hexuronic acids, by lipoprotein lipase affinity chromatography. J Biochem Biophys Methods. 1996;32:27–32. doi: 10.1016/0165-022x(95)00045-s. [DOI] [PubMed] [Google Scholar]
- 44.Stanford KI, Wang L, Castagnola J, Song D, Bishop JR, Brown JR, Lawrence R, et al. Heparan sulfate 2-O-sulfotransferase is required for triglyceride-rich lipoprotein clearance. J Biol Chem. 2010;285:286–294. doi: 10.1074/jbc.M109.063701. [DOI] [PMC free article] [PubMed] [Google Scholar]
- 45.Frese MA, Milz F, Dick M, Lamanna WC, Dierks T. Characterization of the human sulfatase Sulf1 and its high affinity heparin/heparan sulfate interaction domain. J Biol Chem. 2009;284:28033–28044. doi: 10.1074/jbc.M109.035808. [DOI] [PMC free article] [PubMed] [Google Scholar]
- 46.Hotta K, Funahashi T, Arita Y, Takahashi M, Matsuda M, Okamoto Y, Iwahashi H, et al. Plasma concentrations of a novel, adipose-specific protein, adiponectin, in type 2 diabetic patients. Arterioscler Thromb Vasc Biol. 2000;20:1595–1599. doi: 10.1161/01.atv.20.6.1595. [DOI] [PubMed] [Google Scholar]
- 47.Moreton JR. Atherosclerosis and alimentary hyperlipemia. Science. 1947;106:190–191. doi: 10.1126/science.106.2748.190. [DOI] [PubMed] [Google Scholar]
- 48.Zilversmit DB. Atherogenesis: A postprandial phenomenon. Circulation. 1979;60:473–485. doi: 10.1161/01.cir.60.3.473. [DOI] [PubMed] [Google Scholar]
- 49.Karpe F, Boquist S, Tang R, Bond GM, de Faire U, Hamsten A. Remnant lipoproteins are related to intima-media thickness of the carotid artery independently of LDL cholesterol and plasma triglycerides. J Lipid Res. 2001;42:17–21. [PubMed] [Google Scholar]
- 50.Nordestgaard BG, Benn M, Schnohr P, Tybjaerg-Hansen A. Nonfasting triglycerides and risk of myocardial infarction, ischemic heart disease, and death in men and women. JAMA. 2007;298:299–308. doi: 10.1001/jama.298.3.299. [DOI] [PubMed] [Google Scholar]
- 51.Kannel WB, Vasan RS. Triglycerides as vascular risk factors: new epidemiologic insights. Curr Opin Cardiol. 2009;24:345–350. doi: 10.1097/HCO.0b013e32832c1284. [DOI] [PMC free article] [PubMed] [Google Scholar]
- 52.Proctor SD, Vine DF, Mamo JC. Arterial retention of apolipoprotein B48- and B100-containing lipoproteins in atherogenesis. Curr Opin Lipidol. 2002;13:461–470. doi: 10.1097/00041433-200210000-00001. [DOI] [PubMed] [Google Scholar]
- 53.Williams KJ, Tabas I. Lipoprotein retention–and clues for atheroma regression. Arterioscler Thromb Vasc Biol. 2005;25:1536–1540. doi: 10.1161/01.ATV.0000174795.62387.d3. [DOI] [PubMed] [Google Scholar]
- 54.Bansal S, Buring JE, Rifai N, Mora S, Sacks FM, Ridker PM. Fasting compared with nonfasting triglycerides and risk of cardiovascular events in women. JAMA. 2007;298:309–316. doi: 10.1001/jama.298.3.309. [DOI] [PubMed] [Google Scholar]
- 55.Freiberg JJ, Tybjaerg-Hansen A, Jensen JS, Nordestgaard BG. Nonfasting triglycerides and risk of ischemic stroke in the general population. JAMA. 2008;300:2142–2152. doi: 10.1001/jama.2008.621. [DOI] [PubMed] [Google Scholar]
- 56.Ybarra J, James RW, Makoundou V, Bioletto S, Golay A. Effects of short-term modest weight loss on fasting and post-prandial lipoprotein subfractions in type 2 diabetes mellitus patients. Diabetes Metab. 2001;27:701–708. [PubMed] [Google Scholar]