

Abstract
We examined the effect of chronic CCL3 treatment on the properties of cultured rat hippocampal neurons to gain an understanding of the neuronal effects of CCL3 during neuroinflammatory disorders. Western blot assays showed that chronic exposure to CCL3 altered the level of specific neuronal and glial proteins and that CCL3 had no effect on neuronal survival. CCL3 treatment also altered intracellular Ca2+ dynamics and increased Ca2+ levels in hippocampal neurons, measured by fura-2 imaging techniques. Additionally, chronic CCL3 increased NMDA-evoked Ca2+ signals in the hippocampal neurons and increased NMDA receptor levels. These CCL3-induced neuroadaptive changes could play an important role in the CNS dysfunction associated with CNS disorders with a neuroinflammatory component.
Keywords: neuroinflammation, epilepsy, NMDA receptor, synaptic transmission, Ca2+
1. Introduction
Emerging research indicates that chemokines are important signaling molecules in the central nervous system (CNS) (Adler et al., 2005; Miller et al., 2008). Chemokines belong to a family of small proteins initially identified for their role in the immune system as inflammatory and chemoattractive factors (Wells et al., 1998). Microglia and astrocytes are prominent sources of chemokines within the CNS, but some neurons also produce chemokines (Biber et al., 2006). The biological effects of chemokines are produced through activities of cognate G-protein coupled receptors and several downstream signal transduction pathways including inhibition of adenylate cyclase, activation of MAP kinase and activation of phospholipase C (PLC) (Bajetto et al., 2002; Maghazachi, 2000). To date, approximately 50 chemokines and 20 chemokine receptors have been identified, many of which are expressed in the CNS (Adler and Rogers, 2005).
Chemokine levels in the CNS are generally low under normal conditions, but increased expression is induced by adverse conditions such brain injury or disease and provide an important signal for the inflammatory cell recruitment to the CNS in the host defense response (Tran and Miller, 2003). For example, the chemokine CCL3 (chemokine 3; also known as MIP-1 or macrophage inflammatory protein-1) a 7.8 kDa protein and other components of the innate immune system are highly up regulated in the hippocampus of temporal lobe epilepsy (TLE) patients (Lee et al., 2007; van Gassen et al., 2008). Increased levels of CCL3 also occur during epileptogenesis in animal models of temporal lobe epilepsy, suggesting a role for CCL3 in this condition (Gorter et al., 2006; Lukasiuk et al., 2006). Studies also implicate a role for CCL3 in experimental autoimmune encephalomyelitis (EAE), a demyelinating disease model of the CNS that is a model for multiple sclerosis (Glabinski et al., 1998). During the course of EAE, CNS levels of CCL3 mRNA and protein are up regulated and correlate with the severity of the clinical episode (Karpus et al., 1995). Other conditions associated with increased levels of CCL3 in the CNS include closed head injury (Israelsson et al., 2009), ischemia (Cowell et al., 2002), Wallerian degeneration (Perrin et al., 2005), Alzheimer’s disease (Tripathy et al., 2007) and HIV infection (Letendre et al., 1999).
Neuronal expression of mRNA and protein for CCR3, a cognate receptor for CCL3, has been demonstrated in several CNS regions, consistent with the ability of neurons to respond to CCL3. For example, studies show that CCR3 immunopositive neurons are present in the hippocampus, cerebral cortex, brain stem, cerebellum and spinal cord (Ishizuka et al., 1997; van der Meer et al., 2000; Xia et al., 1998; Xu et al., 2009). These results raise the possibility that the functional properties of CNS neurons could be altered by CCL3 when elevated levels of CCL3 are present in the CNS, as occurs during CNS neuroinflammation. Few studies have investigated this possibility, which could have important implications relative to the effects of neuroinflammation on cognitive function. To provide information on this issue, we have investigated the effects of CCL3 on hippocampal neurons using a culture model system.
2. Materials and Methods
2.1. Cell cultures
Hippocampal cultures were prepared from embryonic day 20 rat (Sprague-Dawley, Charles River) hippocampus as previously described (Vereyken et al., 2007). Under sterile condition hippocampi were dissected, minced and triturated without enzymatic treatment. The suspension was plated on Matrigel (BD Biosciences, Bedford, MA, USA) coated tissue culture dishes for immunoblotting or on Matrigel and poly-lysine-D coated glass bottom culture dishes (MatTek Corp, Ashland, MA, USA) for Ca2+ imaging. Approximately two hippocampi were added to a culture dish used for Western blotting and one hippocampus was added to a culture dish for Ca2+ imaging. The culture medium used for plating was Minimum Essential Medium (MEM) with Earle’s salts and L-glutamine (Gibco-Invitrogen, Carlsbad, CA, USA) supplemented with D-glucose (final concentration, 5.0 g/L) and 5% heat-inactivated fetal calf serum and 10% horse serum (Gibco-Invitrogen). The culture medium was exchanged twice weekly with a medium of the same composition but without fetal calf serum. Cultures were maintained at 37°C in a humidified atmosphere of 95% air/5% CO2. On the second day in vitro (DIV), the anti-mitotic agent 5-fluorodeoxyuridine (20 μg/μL; three day treatment) was added to limit the number of non-neuronal cells. Antibiotics were not used. Unless otherwise stated, in all studies chemicals were obtained from Sigma-Aldrich (St Louis, MO, USA). The animal procedures were performed in accordance with the National Institutes of Health Guideline for the Care and Use of Laboratory Animals. Animal facilities and experimental protocols were in accordance with the Association for the Assessment and Accreditation of Laboratory Animal Care.
2.2. Chronic CCL3 treatment
Cultures from each dissection were divided into control and chronic CCL3 treatment groups. Recombinant rat CCL3 (BSA-free, PeproTech, Rocky Hill, NJ, USA) was reconstituted in 0.1% bovine serum albumin (BSA; fatty acid free) to a final concentration of 50 μM. At 9 DIV, CCL3 was added to the cultures during the media change. No CCL3 was added to the control cultures. In studies of lymphocytes, CCL3 induced chemotaxis at a concentration range of ~1–100 nM, with a maximum response at 10 nM (Loetscher et al., 1994). Kd values for CCL3 at its preferred receptor CCR1 are reported to be in the low nM range (~1–5 nM) (Neote et al., 1993). Therefore, in the hippocampal cultures CCL3 was used at final concentration ranging from 20 to 200 nM to model neuroinflammatory conditions in which CCL3 levels are elevated.
2.3. Immunoblotting
Hippocampal cultures (12 DIV) were prepared for Western blot analysis of protein levels as previously described (Vereyken et al., 2007). Cultures were rinsed with ice-cold PBS and cells lysed with buffer containing 10 mM Tris-HCl (pH 7.5), 150 mM NaCl, 2 mM EDTA, 4.5 mM sodium pyrophosphate, 10 mM β-glycerophosphate, 1 mM NaF, 1 mM Na3VO4, 1% Triton X-100, 0.5% NP-40, and protease inhibitor cocktail (Boehringer, Indianapolis, IN, USA) for 30 min at 4°C. Cell lysates were centrifuged at 14,000 rpm for 30 min and protein concentrations in the supernatant determined using a BioRad Dc protein assay kit (BioRad, Hercules, CA, USA). Samples (20 μg of protein) were separated by NuPAGE 4–12% Bis-Tris gels (Invitrogen, Carlsbad, CA, USA) and transferred onto Immobilon-P membranes (Millipore, Billerica, MA, USA). After washing, membranes were blocked with casein (Pierce Biotechnology, Rockford, IL, USA) in PBS or Tris-buffered saline (TBS) containing 0.1% Tween-20 and incubated at room temperature with primary antibody. After washing, membranes were incubated with horseradish peroxidase-conjugated secondary antibody, washed and visualized using the ECL system (Pierce Biotechnology, Rockford, IL, USA) and Kodak Biomax ML films (Kodak, Rochester, NY, USA). Working concentrations of the primary and secondary antibodies were selected to allow detection under linear conditions. Membranes were stripped, washed and reprobed with β-actin to assess variability in loading. Samples of CCL3-treated and control cultures (both in duplicate) were run on the same gel. Relative densitometry was performed using NIH Image software (http://rsb.info.nih.gov/nih-image). The density of each band was quantified and normalized against the corresponding density of β-actin in the same lane. Normalized data from CCL3-treated cultures were then normalized to normalized values from control cultures to determine differences resulting from CCL3 treatment.
The following primary antibodies were used for Western blotting: a mouse monoclonal antibody raised against neuron specific enolase (1:5000, Chemicon International, Temecula, CA, USA); a mouse monoclonal antibody raised against glial fibrillary acidic protein (GFAP, 1:5000, Chemicon International); a mouse monoclonal antibody raised against β-actin (1:10000, Sigma, St. Louis, MO, USA); a rabbit polyclonal antibody raised against glutamate decarboxylase (GAD65/67, 1:5000, Chemicon International); a mouse monoclonal antibody raised against glutamate decarboxylase (GAD65, 1:1000, BD Biosciences)a goat polyclonal antibody raised against the NR1 subunit of the NMDA receptor (NMDAR1, 1:1000, Santa Cruz Biotechnology, Santa Cruz, CA, USA); a rabbit polyclonal antibody raised against the NR2A/B subunit of the NMDA receptor (NMDAR2A/B, 1:500, Chemicon International), a goat polyclonal antibody raised against the NR2A subunit of the NMDA receptor (NMDAR2A, 1:500, Santa Cruz); a rabbit polyclonal antibody raised against synapsin 1 (1:10000, Molecular Probes); a rabbit polyclonal antibody raised against the alpha subunit of metabotropic glutamate receptor 5 (1:500, Chemicon International) and a rabbit polyclonal antibody raised against subunit 2 (GluR2) of the AMPA receptor (1:500, Chemicon International). A goat anti-rabbit, goat anti-mouse or rabbit anti-goat secondary antibodies were used for Western blotting (1:10000, Southern Biotech, Birmingham, AL, USA).
2.4. Immunohistochemistry
Immunocytochemical staining of the hippocampal cultures was performed at 11–13 DIV as described previously (Vereyken et al., 2007) using the same antibodies as for the Western blotting (listed above). In brief, cultures were rinsed with serum-free MEM, fixed with 4% paraformaldehyde in phosphate-buffered saline (PBS, 100 mM, pH 7.3) for 15 min, and permeablized with 0.05% Triton X-100 in PBS for 30 min. The cultures were incubated overnight (4 °C) in PBS containing the primary antibody in dilutions 1: 500 and 0.05% BSA as a blocking agent. Immunoreactivity was detected with the Vectastain Elite ABC kit (Vector Laboratories, Burlingame, CA, USA).
2.5. Cell survival
Cell survival was assessed in 12 DIV cultures using the MTT assay (3-[4,5-dimethylthiazol-2-yl]-2,5-diphenyltetrazolium bromide) to measure mitochondrial activity (Ankarcrona et al., 1995). In healthy neurons, mitochondrial enzymes have the ability to transform MTT tetrazolium salt (yellow) into the purple colored formazan. The number of healthy cells is directly proportional to the amount of formazan produced (Mosmann, 1983). For the cell survival assay, culture medium was removed and MTT (0.5 mg/ml) was added to the cells. After 2 h incubation at 37 °C, MTT was removed and isopropanol was added to dissolve the converted dye. After 1 h incubation at room temperature, absorbance of the dye was measured at 570 nm. Data from MTT assays of CCL3-treated cultures were normalized to the values measured in the control cultures.
2.6. Calcium imaging
The effects of CCL3 treatment on intracellular Ca2+ levels were determined using standard microscopic fura-2 digital Ca2+ imaging techniques (Grynkiewicz et al., 1985) as described previously (Vereyken et al., 2007). Briefly, at 12–16 DIV, hippocampal cultures were incubated for 30 min with the Ca2+-sensitive dye fura-2/AM (Molecular Probes) at 3μM in physiological saline containing 0.02% pluronic F-127 (Molecular Probes) for 30 minutes at room temperature. The composition of the physiological saline was (in mM): 140 NaCl, 3.5 KCl, 0.4 KH2PO4, 1.25 Na2HPO4, 2.2 CaCl2, 2 MgSO4, 10 glucose and 10 HEPES. After removal of the fura-2, the cultures were incubated in dye-free saline for at least 45 minutes to allow for the de-esterification of the fura-2AM.
Live fluorescence images of neurons in a microscopic field were acquired at excitation wavelengths of 340 and 380 nm using a SIT-66 video camera (DAGE-MTI, Dage, Michigan City, IN) and digitized for real-time display using the MCID imaging software (Imaging Research, St. Catharines, Ontario, Canada). Neurons were identified by their size and morphology. Data were collected at 0.8 s intervals (4 frames per wavelength were averaged for each time point). Measurements of fluorescence levels were made in individual neurons and intracellular Ca2+ levels were calculated by converting the fluorescence ratios (340/380 nm) to intracellular Ca2+ concentrations. The following formula was used for this conversion: [Ca2+]i = Kd(R − Rmin)/(Rmax − R)*Fo/Fs, where R is the ratio value, Rmin is the ratio for a Ca2+ free solution, Rmax is the ratio for a saturated Ca2+ solution, Kd is 225 (the dissociation constant for fura-2), Fo is the intensity of a Ca2+ free solution at 380 nm and Fs is the intensity of a saturated Ca2+ solution at 380 nm. Calibration was performed using fura-2 salt solutions with known Ca2+ concentrations (Molecular Probes calibration kit). Typical Rmax, Rmin, and Fo/Fs values were 0.40, 1.19 and 1.82, respectively. The low level of background fluorescence and adjustment of the black level of the SIT camera eliminated the need for background subtraction methods. All experiments were performed at room temperature.
On each experimental day, Ca2+ levels were recorded in control and CCL3-treated cultures from the same culture set. To measure Ca2+ levels in resting neurons, 100 nM Tetrodotoxin (TTX, Calbiochem, San Diego, CA, USA) was used to block spontaneous synaptic activity in the cultures. To measure intracellular Ca2+ signals in response to a brief application of NMDA, NMDA (20 μM) was dissolved in Mg2+-free physiological saline supplemented with the co-agonist glycine (5 μM) and acutely applied by a brief pressure (0.5 s) ejection from a glass micropipette. A dye (fast green) was included in the solution to monitor neuronal NMDA exposure. Mg2+-free physiological saline supplemented with the co-agonist glycine (5 μM) was used in the bath for these experiments. Ca2+ responses produced by NMDA were quantified by the peak amplitude (peak minus baseline), time to peak (seconds after NMDA exposure) and duration of the peak (measured at half-maximum peak amplitude). For spontaneous Ca2+ oscillations, AxoGraph software (Axon Instruments, Foster City, CA) was used to measure average Ca2+ levels and peak amplitudes of the Ca2+ oscillations during standardized recording period. For each experimental day, mean values for average Ca2+ levels and peak amplitudes were calculated for the population of control neurons studied and then measurements from each cell in control and CCL3 treatment groups were normalized to the respective mean control value.
2.6. Electrophysiological recording
In some studies electrophysiological recordings were performed simultaneously with Ca2+ imaging experiments to confirm that Ca2+ oscillations were driven by synaptic network activity. The protocol followed that described previously (Nelson and Gruol, 2004). Briefly, perforated-patch whole-cell current-clamp recordings were made in the somatic region of fura-2 loaded hippocampal neurons undergoing Ca2+ imaging. The patch pipette solution contained (in mM): 6 NaCl, 140 K+-methylsulfate, 2 MgCl2, 0.5 CaCl2, 10 HEPES-KOH, and 10 glucose. Tips of patch pipettes (4–5 MΩ) were filled first with antibiotic-free solution and the pipettes were back-filled with the same solution only containing the pore-forming antibiotics nystatin or amphotericin B (200 μg/ml; Calbiochem). The bath saline was physiological saline or reduced Mg2+ (30 μM) physiological saline. Recordings were performed using the Axopatch-1C amplifier, and digitized (1 kHz) using the Digidata 1322A interface and pCLAMP v.8.0 software (all from Axon Instruments). All recordings were made at room temperature (23–25°C). In some studies antagonists were added to the recording solution including bicuculline methiodide, 6,7-Dinitroquinoxaline-2,3-dione (DNQX)(RBI, Natick, MA), and D-(−)-2-amino-5-phosphonopentanoic acid (D-AP5)(Tocris, Ellisville, Missouri) to block GABA and glutamate receptors, respectively, that mediate synaptic transmission in the hippocampal cultures.
2.7. Statistical analysis
Statistical significance (P ≤ 0.05) was determined using the one-group Student’s t-test (normalized data; control =1) or unpaired Student’s t-test. Data are reported as means ± standard error of the mean (SEM). n= number of cultures or neurons studied. All studies involved at 2–7 different culture sets.
3. Results
3.2. Characteristics of hippocampal cultures after chronic CCL3 exposure
Well-developed hippocampal cultures used for these studies are composed of excitatory and inhibitory neurons, astrocytes and some microglia (Fig. 1). The astrocytes form the substratum upon which the neurons grow (Fig. 1). Microglia are scattered throughout the cultures. The excitatory and inhibitory neurons form synaptic networks in culture that are spontaneously active (Fig. 1B). The spontaneously network activity consists of synaptic responses and action potentials. The synaptic responses are mediated primarily by AMPA, NMDA and GABA-A receptors (Fig. 1B).
Figure 1.

Hippocampal cultures. A. Digitized images of immunostained cultures showing cell types in the hippocampal cultures. The phase contrast images show all cells in the field while the Hoffman optics images show the immunostained cells. The well-developed hippocampal cultures contain excitatory and inhibitory neurons and glial cells, thus reflecting the hippocampus in vivo. The neurons can be identified by their distinct morphological characteristics and by immunostaining for specific proteins. The majority of hippocampal neurons express NMDAR1. Inhibitory neurons can be identified by immunostaining with an antibody to glutamic acid decarboxylase (GAD65), the synthetic enzyme for gamma amino butryic acid (GABA) the transmitter used by the inhibitory neurons. In the phase contrast image, arrows point to some neurons that are unstained for GAD65. These neurons are presumably excitatory neurons that use glutamate as a transmitter. The primary glial cell type in culture is the astrocyte, which can be identified by immunostaining for the astrocyte specific protein GFAP. In the phase contrast image, the arrow points to a neuron, which is unstained for GFAP. Some microglia are also present in culture and can be identified by immunostaining for the microglial marker CD11b. Arrow in the Hoffman optics image points to a microglia; arrow head points to immunostained processes from another microglia. B. Patch clamp recordings from a cultured hippocampal neuron showing the spontaneous synaptic network activity. The activity consists of synaptic potentials that evoke action potentials. The contribution of inhibitory (GABA-mediated) and excitatory (glutamate-mediated) synaptic events to the activity can be shown by application of GABA and glutamate receptor antagonists. The recordings were made in physiological saline with reduced Mg2+ levels (30 μM) to remove Mg2+ block of NMDARs. In the reduced Mg2+ saline, NMDAR-mediated synaptic responses can be observed at resting membrane potential. Changes in the spontaneous network activity with various receptor antagonists show that GABA-A, AMPA and NMDA receptors play a central role in generating the synaptic network activity. Bicuculline blocked the GABA-A receptors that mediate inhibitory synaptic responses, whereas AMPA and NMDA receptor-mediated excitatory synaptic responses were blocked by DNQX and D-AP5, respectively.
The hippocampal cultures were exposed to CCL3 (20–200 nM) starting at 9 DIV and CCL3 exposure was maintained for three days to simulate a neuroinflammatory condition. The morphological features of the cultures and cell types were not noticeably affected by CCL3 treatment at any of the concentrations of CCL3 tested. Measurement of total protein content and Western blot analysis of the level β-actin, a housekeeping protein, showed no difference between control and CCL3-treated cultures (Fig. 2A,B). Measurement of cell survival using the MTT assay also showed no difference between control and CCL3-treated cultures (Fig. 2C). However, Western blot analysis of the cultures showed that the levels of certain neuronal and glial proteins were significantly altered by CCL3 treatment depending on the CCL3 concentration. The level of the glial specific protein GFAP was significantly increased by treatment with 20 nM CCL3, an effect that was not observed at the higher concentrations of CCL3 (Fig. 2D). The level of the neuron specific protein enolase was significantly increased by treatment with 20 nM and 50 nM CCL3 but not by treatment with 200 nM CCL3 (Fig. 2E). The level of GAD65/67, the synthetic enzyme for the transmitter GABA, and synapsin I a,b (Syn I), a protein localized to presynaptic terminals of neurons, were also increased by treatment with 20 nM CCL3 and this effect was not observed at higher CCL3 concentrations (Fig. 2F,G). Taken together, these results show that cell survival in hippocampal cultures is not altered by exposure to CCL3, but CCL3 can affect the level of expression of specific neuronal and glial proteins depending on the CCL3 concentration.
Figure 2.

Culture characteristics after chronic CCL3 treatment. A,B. Total protein and β-actin levels in control and CCL3-treated cultures. C. Cell survival (measured by MTT assay) in control and CCL3-treated cultures. D–G. Levels of GFAP, enolase, GAD65/67 and synapsin 1 a,b in control and CCL3-treated cultures. H. Representative Western blots. All graphs show mean values ± SEM for CCL3-treated cultures relative to control cultures (normalized data). In all graphs, dashed lines represent control levels. Numbers in boxes represent number of cultures used for the experiment. * Statistically significant (p<0.05) compared to control.
3.2. CCL3 exposure alters intracellular Ca2+ oscillations in neurons of hippocampal cultures
The ability of CCL3 treatment to alter the level of neuronal proteins including proteins involved in synaptic transmission raised the possibility that synaptic function could be altered by CCL3 treatment. To address this possibility, we compared spontaneous synaptic network activity in control and CCL3-treated hippocampal cultures. Previous studies showed that spontaneous synaptic network activity is a prominent characteristic of well-developed hippocampal cultures and that this activity is comprised of spontaneous synaptic potentials and action potentials (Bacci et al., 1999; Przewlocki et al., 1999)(Fig. 3A,D). Ca2+ oscillations are associated with the network activity and result from Ca2+ influx through NMDA receptors (NMDAR) and voltage gated Ca2+ channels (VGCCs), which play a prominent role in the generation of the spontaneous network activity (Bacci et al., 1999; Przewlocki et al., 1999).
Figure 3.

Chronic CCL3 treatment alters Ca2+ signaling in hippocampal neurons. A. Combined Ca2+ imaging and electrophysiological recording showing synaptic network activity in the recorded neuron and associated Ca2+ signals in the recorded neuron and other synaptically connected neurons in the field. B. Representative recordings of spontaneous Ca2+ signals in control and chronic CCL3-treated hippocampal neurons in microscopic fields under study. C. Addition of TTX to hippocampal cultures blocks all spontaneous activity. D. Phase contrast micrograph showing live hippocampal neurons used for Ca2+ imaging studies. The neurons are growing on top of an astrocyte layer. E. Average Ca2+ levels in spontaneously active control and chronic CCL3-treated hippocampal neurons. F. Number of spontaneous Ca2+ signals in control and chronic CCL3-treated hippocampal neurons during a 150 s recording period. G. Average peak amplitude of spontaneous Ca2+ signals in control and chronic CCL3-treated neurons. H. Effect of chronic CCL3 treatment on resting (TTX-treated) Ca2+ levels in control and chronic CCL3-treated hippocampal neurons. All graphs show mean values ± SEM. In E,G and H, measurements for CCL3-treated and control neurons were normalized to the mean value for control neurons in sibling cultures (normalized data). Dashed lines represent control levels. Numbers in boxes are the number of neurons studied. * Statistically significant (p<0.05) compared to control.
To determine if CCL3 treatment affected synaptic network activity, we measured the Ca2+ signals generated by the network activity in the hippocampal cultures using Ca2+ imaging techniques. Neurons chronically treated with CCL3 at 20 or 100 nM and sibling control neurons were examined. Robust spontaneous Ca2+ oscillations were observed in both control and CCL3-treated neurons and were often synchronized among neurons in a microscopic field (Fig. 3B). The Ca2+ oscillations were quantified by measurement of the average Ca2+ level, peak amplitude of the Ca2+ oscillations (minus resting Ca2+ level) and the number of oscillations in individual neurons during a standardized recording period of 150 s.
The average Ca2+ level and the number of Ca2+ peaks were significantly larger in neurons treated with CCL3 compared with control neurons (Fig. 3E,F). The increase was similar for 20 and 100 nM CCL3. The peak amplitude of the Ca2+ oscillations was also increased by CCL3 treatment, with a significant increase of about 40% (controls 24 ± 1 nM; n=418) in neurons treated with 100 nM CCL3 (Fig. 3G).
To determine if CCL3 treatment altered resting Ca2+ levels, an effect that could contribute to the increased average Ca2+ levels observed in CCL3-treated neurons, resting Ca2+ levels were measured after applying TTX to the recording saline to block the synaptic network activity. In the presence of TTX, which blocked all spontaneous network activity (Fig 3C), mean resting Ca2+ levels in control neurons (129 ± 3 nM; n=331) and in neurons treated with 20 nM CCL3 were comparable, whereas in the presence of TTX treatment with 100 nM CCL3 produced a small decrease (15%) in resting Ca2+ levels (Fig. 3H). These results indicate that a change in resting Ca2+ levels does not contribute to the increase in average Ca2+ levels observed in the CCL3-treated neurons. However, the CCL3-induced decrease in resting Ca2+ levels observed with 100 nM CCL3 could be a contributing factor in the apparent lack of concentration dependency for the increase in average Ca2+ levels observed in cultures treated with 20 vs. 100 nM CCL3 (Fig. 3C).
3.3. Chronic CCL3 treatment enhances NMDA-evoked Ca2+ signals
Studies have shown that Ca2+ influx through NMDARs is an important contributor to the intracellular Ca2+ signals associated with synaptic network activity in hippocampal cultures (Bacci et al., 1999; Leinekugel et al., 1997; Przewlocki et al., 1999). Therefore, one target of CCL3 action in the hippocampal cultures could be NMDARs. To determine if chronic CCL3 altered Ca2+ flux through NMDARs, we measured Ca2+ signals produced by exogenous application of NMDA (20 μM) to control and CCL3-treated neurons. NMDA was applied by brief (1 s) micropressure ejection from a NMDA-containing micropipette during. Responses to NMDA were quantified by measurement of peak amplitude, time to peak and peak duration.
NMDA application resulted in a prominent Ca2+ signal in both control and CCL3-treated neurons (Fig. 4A). The peak amplitude of the Ca2+ signal evoked by NMDA in control neurons was 246 ± 10 nM (n=331) and was increased in a concentration-dependent manner in cultures treated with 20 and 100 nM CCL3 (30% and 100%, respectively) (Fig. 4B). The time to peak amplitude was significantly decreased in neurons treated with 100 nM CCL3 (Fig. 4C) and the peak duration was significantly increased (Fig. 4D) compared to Ca2+ signals evoked by NMDA in control neurons, consistent with the larger Ca2+ responses evoked by NMDA in the CCL3-treated neurons.
Figure 4.
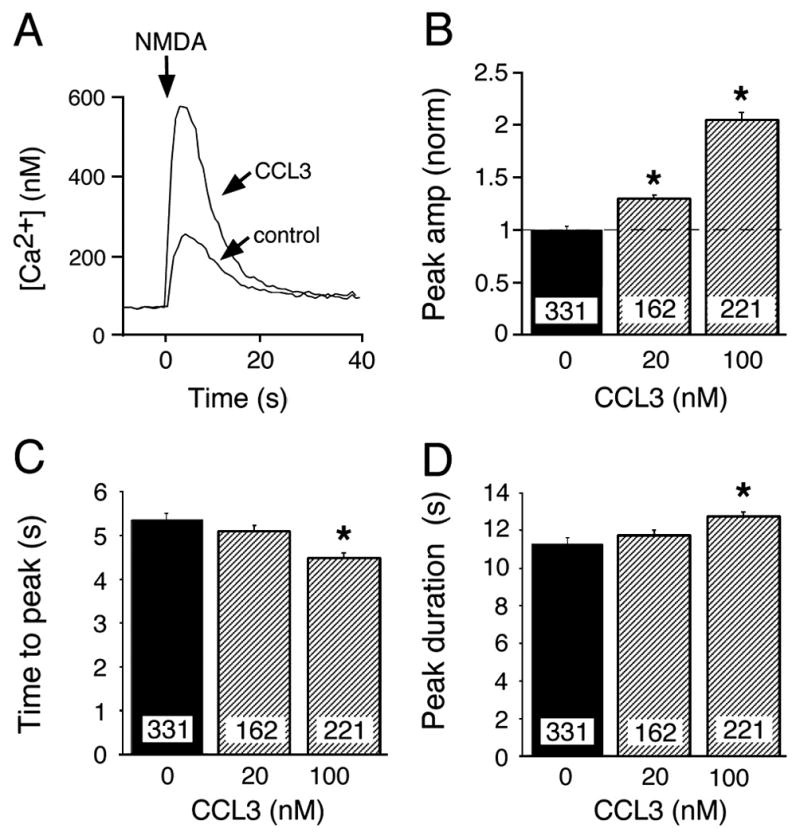
NMDA-evoked Ca2+ responses in cultured hippocampal neurons. A. Representative traces of an NMDA-evoked Ca2+ signal in a control and chronic CCL3-treated (100 nM) neuron. B–D. Effect of chronic CCL3 treatment on peak amplitude (B), time to peak (C), and peak duration (D) of the NMDA-induced Ca2+ signal. All graphs show mean values ± SEM. Numbers in boxes are the number of neurons studied. In B, measurements for CCL3-treated and control neurons were normalized to the mean value for control neurons in sibling cultures (normalized data). Dashed lines represent control levels. * Statistically significant (p<0.05) compared to control.
3.4. Chronic CCL3 exposure increases the level of NMDAR subunit expression
The increase in the magnitude of the Ca2+ signal produced by NMDA application in the CCL3-treated neurons could occur through a variety of mechanisms. One possible mechanism is through increased levels of NMDAR. To evaluate this possibility, the effect of CCL3 treatment on expression of NMDAR subunits was examined by immunoblotting. Cultures were chronically treated with CCL3 (0, 20, 50 or 200 nM) and blots were probed with specific NR1 and NR2A/B antibodies to determine relative level of subunit protein. Chronic CCL3 treatment increased the level of NR1 at 20 and 50 nM and NR2A/B at 50 nM CCL3. However, no increase was observed at 200 nM (Fig. 5A,B,D). In contrast, the level of protein for the alpha subunit of metabotropic glutamate receptor 5 (mGluR5α) and the GluR2 subunit of the AMPA receptor were not significantly altered (Fig. 5D–F). These results indicate that CCL3 exposure can selectively increase the level of NMDAR subunits depending on concentration.
Figure 5.

Immunoblot analysis of glutamate receptor subunits. A–E. Relative levels of NMDAR1, NMDAR2A/B, mGluR5α and GluR2 in CCL3-treated cultures. Graphs show mean values ± SEM for CCL3-treated cultures relative to control cultures (normalized data). Dashed lines represent control levels. Numbers in boxes are number of cultures used for the experiment. C,F. Representative immunoblots. * Statistically significant (p<0.05) compared to control.
4. Discussion
Our results show that the chemokine CCL3 can produce neuroadaptive changes in cultured rat hippocampal neurons when the neurons are subjected to prolonged exposure to CCL3. The neuroadaptive changes involved concentration-dependent alterations in the level of specific neuronal proteins including proteins involved in synaptic transmission. Cell viability and morphology were not altered by the CCL3 exposure indicating that the neuroadaptive changes were not the result of non-specific effects on the general health of the cultures. Importantly, the neuroadaptive changes in protein levels also resulted in functional alterations, as evidenced by increased synaptic network activity and Ca2+ responses evoked by exogenous application of NMDA to the hippocampal neurons. Taken together, these results provide evidence that actions of CCL3 on CNS neurons could play an important role in the changes in CNS function associated with disorders of the CNS that have a neuroinflammatory component.
The levels of several neuronal proteins were altered by CCL3 exposure including neuron specific enolase, GAD 65/67, Syn 1 and NMDAR subunits. The level of the glial protein GFAP was also altered in the CCL3-treated cultures. For all of these proteins, the levels were increased when the cultures were exposed to 20 nM CCL3 but were not increased by exposure to 200 nm CCL3. This negative concentration-dependency may reflect desensitization of the receptor due to prolonged exposure to high concentrations of ligand, which is know to occur for G-protein coupled receptors (Ferguson, 2001), or additional effects of CCL3 that are called into play at high concentrations. In previous studies, we observed a similar type of concentration dependency for CCL2 actions in cerebellar Purkinje neurons (van Gassen et al., 2005). Future studies will be required to resolve this issue. The level of total protein in the cultures and the housekeeping protein β-actin were not altered by the 20–200 nM CCL3 treatment, indicating that the effects of CCL3 were selective for certain proteins and not due to a general effect on cell growth.
The levels of protein for both NR1 and NR2A/B subunits of NMDAR, the principle NMDAR subunits expressed in the hippocampus (Goebel and Poosch, 1999; Rigby et al., 1996), were increased by CCL3. However, the level of protein for subunits of two other glutamate receptors, GluR2 and mGluR5α, were not altered by the CCL3-treatment. Thus, NMDAR appears to be a selective target of CCL3 actions. NMDAR is an ionotropic glutamate receptor that plays a crucial role in activity-dependent synaptic plasticity in the hippocampus (Bliss and Collingridge, 1993). NMDAR is permeable to Ca2+ and a prominent Ca2+ signal is produced when NMDAR is activated. Both control and CCL3-treated neurons showed prominent Ca2+ signals when NMDARs were activated by exogenous application of NMDA to the cultured neurons. The Ca2+ signals were significantly larger in neurons treated with CCL3 (20 and 100 nM) compared with the untreated control neurons. This result is consistent with the increased levels of NMDAR protein observed in the Western blot analyses of the CCL3-treated cultures and implicates increased levels of NMDAR protein as a contributing factor to the larger Ca2+ signals produced by NMDA application to the CCL3-treated neurons. At the highest concentration tested (200 nM) CCL3 treatment did not increase the level of NMDAR protein. Cultures treated with 200 nM CCL3 were not examined in the Ca2+ imaging studies of NMDA-evoked Ca2+ responses. Therefore, it is unknown if chronic exposure to 200 nM CCL3 will reduce Ca2+ responses to NMDA, as would be predicted from the Western blot results. Future studies will be necessary to test this possibility.
Ca2+ signals produced by synaptic network activity were also increased in the CCL3-treated (20 and 100 nM) neurons compared with control neurons. Previous studies showed that in hippocampal cultures, synaptic network activity results from spontaneous synaptic potentials and spike activity and that the associated Ca2+ signals are primarily due to Ca2+ influx through NMDARs and L-type VGCCs (Bacci et al., 1999; Przewlocki et al., 1999). Thus, the increased levels of NMDAR subunits could be an important contributing factor to the enhanced Ca2+ signals associated with the spontaneous network activity in the CCL3-treated cultures. The concentration-dependency for the effect of CCL3 on the peak amplitude of the Ca2+ signals produced by network activity and the concentration-dependency for the effect of CCL3 on the Ca2+ signal produced by exogenous application of NMDA were similar, consistent with this possibility (Fig. 2,3). In addition to NMDAR subunits, the level of synapsin I, a presynaptic protein involved in transmitter release, and GAD65/67, the synthetic enzyme for GABA, the inhibitory transmitter used by the inhibitory interneurons, were also altered by chronic CCL3 treatment in a manner similar to NMDARs. CCL3 effects on the level of these proteins are likely to influence synaptic activity and consequently the amplitude of Ca2+ signals associated with synaptic activity. Moreover, voltage-gated Ca2+ channels, which contribute to Ca2+ influx during the spontaneous network activity, could also be affected by CCL3, a possibility that was not examined in the current study. Thus, CCL3-induced changes in multiple factors are likely to play a contributing role in the enhanced Ca2+ signals associated with synaptic network activity in the CCL3-treated cultures.
Although up regulation of NMDAR levels could result in excitotoxicity (Ndountse and Chan, 2008), no direct effects of chronic CCL3 on cell survival was detected based on culture characteristics, protein analysis and MTT assay. However, the increased levels of NMDAR could have important consequences in CNS injury or disease under conditions associated with increased glutamate levels in the CNS. For example, the increased levels of CCL3 reported to occur in patients with temporal lobe epilepsy (van Gassen et al., 2008) and in epilepsy syndrome in which the immune system has been implicated (Vezzani and Granata, 2005) could lead to increased levels of NMDAR. The increased levels of NMDAR and their role in synaptic transmission could then lead to increased excitatory neurotransmission and contribute to the development of epileptic seizures and excitotoxicity. NMDAR activation and altered Ca2+ levels have been implicated in epileptogenesis and in the development of epileptiform discharges (Croucher et al., 1997; Delorenzo et al., 2005; Rice and DeLorenzo, 1998). NMDARs have also been implicated as an important player in other CNS diseases where increased CNS levels of CCL3 occur including multiple sclerosis (Bolton and Paul, 2006), Alzheimer’s disease (Kotermanski and Johnson, 2009) and viral infection (Mattson et al., 2005). Therefore, effects of CCL3 on the level of expression of NMDAR and other neuronal proteins could play an important role in the altered CNS function observed in these disorders and CCL3 signaling may be an interesting target to consider in the development of new therapeutic strategies.
Acknowledgments
This study was sponsored by the Epilepsy fund of The Netherlands (grant 03-12), by the Dr. Saal van Zwanenbergstichting and by NIH grants AA019261 and P30 MH62261. We thank Floriska Chizer for administrative support and Christine Hao for carrying out some of the Western blot studies. We also thank Dr. Tom Nelson for performing the combined Ca2+ imaging and electrophysiological recordings.
Footnotes
Publisher's Disclaimer: This is a PDF file of an unedited manuscript that has been accepted for publication. As a service to our customers we are providing this early version of the manuscript. The manuscript will undergo copyediting, typesetting, and review of the resulting proof before it is published in its final citable form. Please note that during the production process errors may be discovered which could affect the content, and all legal disclaimers that apply to the journal pertain.
References
- Adler MW, Geller EB, Chen X, Rogers TJ. Viewing chemokines as a third major system of communication in the brain. AAPS J. 2005;7:E865–E870. doi: 10.1208/aapsj070484. [DOI] [PMC free article] [PubMed] [Google Scholar]
- Adler MW, Rogers TJ. Are chemokines the third major system in the brain? J Leukoc Biol. 2005;78:1204–1209. doi: 10.1189/jlb.0405222. [DOI] [PubMed] [Google Scholar]
- Ankarcrona M, Dypbukt JM, Bonfoco E, Zhivotovsky B, Orrenius S, Lipton SA, Nicotera P. Glutamate-induced neuronal death: a succession of necrosis or apoptosis depending on mitochondrial function. Neuron. 1995;15:961–973. doi: 10.1016/0896-6273(95)90186-8. [DOI] [PubMed] [Google Scholar]
- Bacci A, Verderio C, Pravettoni E, Matteoli M. Synaptic and intrinsic mechanisms shape synchronous oscillations in hippocampal neurons in culture. Eur J Neurosci. 1999;11:389–397. doi: 10.1046/j.1460-9568.1999.00440.x. [DOI] [PubMed] [Google Scholar]
- Bajetto A, Bonavia R, Barbero S, Schettini G. Characterization of chemokines and their receptors in the central nervous system: physiopathological implications. J Neurochem. 2002;82:1311–1329. doi: 10.1046/j.1471-4159.2002.01091.x. [DOI] [PubMed] [Google Scholar]
- Biber K, de Jong EK, van Weering HR, Boddeke HW. Chemokines and their receptors in central nervous system disease. Curr Drug Targets. 2006;7:29–46. doi: 10.2174/138945006775270196. [DOI] [PubMed] [Google Scholar]
- Bliss TV, Collingridge GL. A synaptic model of memory: long-term potentiation in the hippocampus. Nature. 1993;361:31–39. doi: 10.1038/361031a0. [DOI] [PubMed] [Google Scholar]
- Bolton C, Paul C. Glutamate receptors in neuroinflammatory demyelinating disease. Mediators Inflamm. 2006;2006:93684. doi: 10.1155/MI/2006/93684. [DOI] [PMC free article] [PubMed] [Google Scholar]
- Cowell RM, Xu H, Galasso JM, Silverstein FS. Hypoxic-ischemic injury induces macrophage inflammatory protein-1alpha expression in immature rat brain. Stroke. 2002;33:795–801. doi: 10.1161/hs0302.103740. [DOI] [PubMed] [Google Scholar]
- Croucher MJ, Ruffle KL, Bradford HF. The effects of focal N-methyl-D-aspartate pretreatment on the parameters of amygdaloid electrical kindling. Eur J Pharmacol. 1997;319:207–213. doi: 10.1016/s0014-2999(96)00868-0. [DOI] [PubMed] [Google Scholar]
- Delorenzo RJ, Sun DA, Deshpande LS. Cellular mechanisms underlying acquired epilepsy: the calcium hypothesis of the induction and maintainance of epilepsy. Pharmacol Ther. 2005;105:229–266. doi: 10.1016/j.pharmthera.2004.10.004. [DOI] [PMC free article] [PubMed] [Google Scholar]
- Ferguson SS. Evolving concepts in G protein-coupled receptor endocytosis: the role in receptor desensitization and signaling. Pharmacol Rev. 2001;53:1–24. [PubMed] [Google Scholar]
- Glabinski AR, Tuohy VK, Ransohoff RM. Expression of chemokines RANTES, MIP-1alpha and GRO-alpha correlates with inflammation in acute experimental autoimmune encephalomyelitis. Neuroimmunomodulation. 1998;5:166–171. doi: 10.1159/000026333. [DOI] [PubMed] [Google Scholar]
- Goebel DJ, Poosch MS. NMDA receptor subunit gene expression in the rat brain: a quantitative analysis of endogenous mRNA levels of NR1Com, NR2A, NR2B, NR2C, NR2D and NR3A. Brain Res Mol Brain Res. 1999;69:164–170. doi: 10.1016/s0169-328x(99)00100-x. [DOI] [PubMed] [Google Scholar]
- Gorter JA, van Vliet EA, Aronica E, Breit T, Rauwerda H, Lopes da Silva FH, Wadman WJ. Potential new antiepileptogenic targets indicated by microarray analysis in a rat model for temporal lobe epilepsy. J Neurosci. 2006;26:11083–11110. doi: 10.1523/JNEUROSCI.2766-06.2006. [DOI] [PMC free article] [PubMed] [Google Scholar]
- Grynkiewicz G, Poenie M, Tsien RY. A new generation of Ca2+ indicators with greatly improved fluorescence properties. J Biol Chem. 1985;260:3440–3450. [PubMed] [Google Scholar]
- Ishizuka K, Igata-Yi R, Kimura T, Hieshima K, Kukita T, Kin Y, Misumi Y, Yamamoto M, Nomiyama H, Miura R, Takamatsu J, Katsuragi S, Miyakawa T. Expression and distribution of CC chemokine macrophage inflammatory protein-1 alpha/LD78 in the human brain. Neuroreport. 1997;8:1215–1218. doi: 10.1097/00001756-199703240-00031. [DOI] [PubMed] [Google Scholar]
- Israelsson C, Wang Y, Kylberg A, Pick CG, Hoffer B, Ebendal T. Closed head injury in a mouse model results in molecular changes indicating inflammatory responses. J Neurotrauma. 2009 doi: 10.1089/neu.2008.0676. [DOI] [PMC free article] [PubMed] [Google Scholar]
- Karpus WJ, Lukacs NW, McRae BL, Strieter RM, Kunkel SL, Miller SD. An important role for the chemokine macrophage inflammatory protein-1 alpha in the pathogenesis of the T cell-mediated autoimmune disease, experimental autoimmune encephalomyelitis. J Immunol. 1995;155:5003–5010. [PubMed] [Google Scholar]
- Kotermanski SE, Johnson JW. Mg2+ imparts NMDA receptor subtype selectivity to the Alzheimer’s drug memantine. J Neurosci. 2009;29:2774–2779. doi: 10.1523/JNEUROSCI.3703-08.2009. [DOI] [PMC free article] [PubMed] [Google Scholar]
- Lee TS, Mane S, Eid T, Zhao H, Lin A, Guan Z, Kim JH, Schweitzer J, King-Stevens D, Weber P, Spencer SS, Spencer DD, de Lanerolle NC. Gene expression in temporal lobe epilepsy is consistent with increased release of glutamate by astrocytes. Mol Med. 2007;13:1–13. doi: 10.2119/2006-00079.Lee. [DOI] [PMC free article] [PubMed] [Google Scholar]
- Leinekugel X, Medina I, Khalilov I, Ben-Ari Y, Khazipov R. Ca2+ oscillations mediated by the synergistic excitatory actions of GABA(A) and NMDA receptors in the neonatal hippocampus. Neuron. 1997;18:243–255. doi: 10.1016/s0896-6273(00)80265-2. [DOI] [PubMed] [Google Scholar]
- Letendre SL, Lanier ER, McCutchan JA. Cerebrospinal fluid beta chemokine concentrations in neurocognitively impaired individuals infected with human immunodeficiency virus type 1. J Infect Dis. 1999;180:310–319. doi: 10.1086/314866. [DOI] [PubMed] [Google Scholar]
- Loetscher P, Seitz M, Clark-Lewis I, Baggiolini M, Moser B. Monocyte chemotactic proteins MCP-1, MCP-2, and MCP-3 are major attractants for human CD4+ and CD8+ T lymphocytes. Faseb J. 1994;8:1055–1060. doi: 10.1096/fasebj.8.13.7926371. [DOI] [PubMed] [Google Scholar]
- Lukasiuk K, Dabrowski M, Adach A, Pitkanen A. Epileptogenesis-related genes revisited. Prog Brain Res. 2006;158:223–241. doi: 10.1016/S0079-6123(06)58011-2. [DOI] [PubMed] [Google Scholar]
- Maghazachi AA. Intracellular signaling events at the leading edge of migrating cells. Int J Biochem Cell Biol. 2000;32:931–943. doi: 10.1016/s1357-2725(00)00035-2. [DOI] [PubMed] [Google Scholar]
- Mattson MP, Haughey NJ, Nath A. Cell death in HIV dementia. Cell Death Differ. 2005;12(Suppl 1):893–904. doi: 10.1038/sj.cdd.4401577. [DOI] [PubMed] [Google Scholar]
- Miller RJ, Rostene W, Apartis E, Banisadr G, Biber K, Milligan ED, White FA, Zhang J. Chemokine action in the nervous system. J Neurosci. 2008;28:11792–11795. doi: 10.1523/JNEUROSCI.3588-08.2008. [DOI] [PMC free article] [PubMed] [Google Scholar]
- Mosmann T. Rapid colorimetric assay for cellular growth and survival: application to proliferation and cytotoxicity assays. J Immunol Methods. 1983;65:55–63. doi: 10.1016/0022-1759(83)90303-4. [DOI] [PubMed] [Google Scholar]
- Ndountse LT, Chan HM. Methylmercury increases N-methyl-D-aspartate receptors on human SH-SY 5Y neuroblastoma cells leading to neurotoxicity. Toxicology. 2008;249:251–255. doi: 10.1016/j.tox.2008.05.011. [DOI] [PubMed] [Google Scholar]
- Nelson TE, Gruol DL. The chemokine CXCL10 modulates excitatory activity and intracellular calcium signaling in cultured hippocampal neurons. J Neuroimmunol. 2004;156:74–87. doi: 10.1016/j.jneuroim.2004.07.009. [DOI] [PubMed] [Google Scholar]
- Neote K, DiGregorio D, Mak JY, Horuk R, Schall TJ. Molecular cloning, functional expression, and signaling characteristics of a C-C chemokine receptor. Cell. 1993;72:415–425. doi: 10.1016/0092-8674(93)90118-a. [DOI] [PubMed] [Google Scholar]
- Perrin FE, Lacroix S, Aviles-Trigueros M, David S. Involvement of monocyte chemoattractant protein-1, macrophage inflammatory protein-1alpha and interleukin-1beta in Wallerian degeneration. Brain. 2005;128:854–866. doi: 10.1093/brain/awh407. [DOI] [PubMed] [Google Scholar]
- Przewlocki R, Parsons KL, Sweeney DD, Trotter C, Netzeband JG, Siggins GR, Gruol DL. Opioid enhancement of calcium oscillations and burst events involving NMDA receptors and L-type calcium channels in cultured hippocampal neurons. J Neurosci. 1999;19:9705–9715. doi: 10.1523/JNEUROSCI.19-22-09705.1999. [DOI] [PMC free article] [PubMed] [Google Scholar]
- Rice AC, DeLorenzo RJ. NMDA receptor activation during status epilepticus is required for the development of epilepsy. Brain Res. 1998;782:240–247. doi: 10.1016/s0006-8993(97)01285-7. [DOI] [PubMed] [Google Scholar]
- Rigby M, Le Bourdelles B, Heavens RP, Kelly S, Smith D, Butler A, Hammans R, Hills R, Xuereb JH, Hill RG, Whiting PJ, Sirinathsinghji DJ. The messenger RNAs for the N-methyl-D-aspartate receptor subunits show region-specific expression of different subunit composition in the human brain. Neuroscience. 1996;73:429–447. doi: 10.1016/0306-4522(96)00089-9. [DOI] [PubMed] [Google Scholar]
- Tran PB, Miller RJ. Chemokine receptors in the brain: a developing story. J Comp Neurol. 2003;457:1–6. doi: 10.1002/cne.10546. [DOI] [PubMed] [Google Scholar]
- Tripathy D, Thirumangalakudi L, Grammas P. Expression of macrophage inflammatory protein 1-alpha is elevated in Alzheimer’s vessels and is regulated by oxidative stress. J Alzheimers Dis. 2007;11:447–455. doi: 10.3233/jad-2007-11405. [DOI] [PubMed] [Google Scholar]
- van der Meer P, Ulrich AM, Gonzalez-Scarano F, Lavi E. Immunohistochemical analysis of CCR2, CCR3, CCR5, and CXCR4 in the human brain: potential mechanisms for HIV dementia. Exp Mol Pathol. 2000;69:192–201. doi: 10.1006/exmp.2000.2336. [DOI] [PubMed] [Google Scholar]
- van Gassen KL, de Wit M, Koerkamp MJ, Rensen MG, van Rijen PC, Holstege FC, Lindhout D, de Graan PN. Possible role of the innate immunity in temporal lobe epilepsy. Epilepsia. 2008;49:1055–1065. doi: 10.1111/j.1528-1167.2007.01470.x. [DOI] [PubMed] [Google Scholar]
- van Gassen KL, Netzeband JG, de Graan PN, Gruol DL. The chemokine CCL2 modulates Ca2+ dynamics and electrophysiological properties of cultured cerebellar Purkinje neurons. Eur J Neurosci. 2005;21:2949–2957. doi: 10.1111/j.1460-9568.2005.04113.x. [DOI] [PubMed] [Google Scholar]
- Vereyken EJ, Bajova H, Chow S, de Graan PN, Gruol DL. Chronic interleukin-6 alters the level of synaptic proteins in hippocampus in culture and in vivo. Eur J Neurosci. 2007;25:3605–3616. doi: 10.1111/j.1460-9568.2007.05615.x. [DOI] [PubMed] [Google Scholar]
- Vezzani A, Granata T. Brain inflammation in epilepsy: experimental and clinical evidence. Epilepsia. 2005;46:1724–1743. doi: 10.1111/j.1528-1167.2005.00298.x. [DOI] [PubMed] [Google Scholar]
- Wells TN, Power CA, Proudfoot AE. Definition, function and pathophysiological significance of chemokine receptors. Trends Pharmacol Sci. 1998;19:376–380. doi: 10.1016/s0165-6147(98)01247-4. [DOI] [PubMed] [Google Scholar]
- Xia MQ, Qin SX, Wu LJ, Mackay CR, Hyman BT. Immunohistochemical study of the beta-chemokine receptors CCR3 and CCR5 and their ligands in normal and Alzheimer’s disease brains. Am J Pathol. 1998;153:31–37. doi: 10.1016/s0002-9440(10)65542-3. [DOI] [PMC free article] [PubMed] [Google Scholar]
- Xu JH, Long L, Tang YC, Zhang JT, Hut HT, Tang FR. CCR3, CCR2A and macrophage inflammatory protein (MIP)-1a, monocyte chemotactic protein-1 (MCP-1) in the mouse hippocampus during and after pilocarpine-induced status epilepticus (PISE) Neuropathol Appl Neurobiol. 2009;35:496–514. doi: 10.1111/j.1365-2990.2009.01022.x. [DOI] [PubMed] [Google Scholar]