



Abstract
Chromosomal aberrations are associated with increased cancer risk in adults. Previously, we demonstrated that stable aberrations involving chromosomes 1-6 in cord blood are associated with prenatal exposure to polycyclic aromatic hydrocarbons (PAHs) measured in air and are disproportionate to genomic content. We now examine whether the association with air PAHs is chromosome-specific and extends to smaller chromosomes.
Using Whole Chromosome Paints for chromosomes 1-6, 11,12,14,19, and a 6q sub-telomere specific probe, we scored 48 cord bloods (1500 metaphases per sample) from newborns monitored prenatally for airborne PAH exposure in the Columbia Center for Children’s Environmental Health cohort. Frequencies of stable aberrations were calculated as incident aberrations per 100 Cell Equivalents scored, and examined for association with airborne PAHs.
Aberrations in chromosome 6 occurred more frequently than predicted by genomic content (p<0.008). Levels of both prenatal airborne PAHs and stable aberration frequency in chromosomes 1-6 decreased to half the levels reported previously in the same cohort (mean PAH decreased from 3.6 to 1.8 ng/m3; mean stable aberration frequency from 0.56 to 0.24, SD=0.19). The mean stable aberration frequency was 0.45 (SD=0.15) in chromosomes 11-19. After adjusting for gender, ethnicity, and household smokers, the mean stable aberration frequency increased with increasing PAH exposure: with a doubling of prenatal PAH exposure, the mean stable aberration frequency for the chromosome1-6 group increased by a factor of 1.49 (95%CI: 0.84, 2.66; p=0.17); for chromosomes 11-19 mean stable aberration frequency increased by 2.00 (95%CI:1.11, 3.62; p=0.02); for chromosome 6 alone, it increased by 3.16 (95%CI: 0.93,10.77; p= 0.06); there was no increase for chromosomes1-5 (p>0.8). Aberrations in chromosomes 11,12,14,19 and 6 were associated with prenatal exposure to PAHs in air, even at lower levels of PAH in air. The observed chromosome-specific effects of prenatal airborne PAHs raise concern about potential cancer risk.
Keywords: Chromosomal aberrations, Polycyclic aromatic hydrocarbons, Cohort study, Prenatal
1. Introduction
Chromosomal aberrations in peripheral blood lymphocytes are recognized as biomarkers that are predictive of cancer risk in adults and have been associated with environmental exposures occurring in utero or in childhood [1-9]. In a subset of neonates from the Columbia Center for Children’s Environmental Health (CCCEH) cohort we have previously shown that occurrence of stable aberrations was neither random nor proportional to the genomic content of any given chromosome, and that the frequency of stable chromosomal aberrations, detectable by FISH using Whole Chromosome Probes (WCP) for chromosomes 1-6 in cord blood, was positively associated with increasing levels of PAHs measured in maternal prenatal air samples [9, 10]. To confirm and expand upon these observations we have scored aberrations using FISH WCP for chromosomes 1-6, chromosome 6 separately, and chromosomes, 11, 12, 14 &19 in cord blood obtained from an additional sample of 48 neonates participating in the CCCEH cohort. Our goal was to confirm whether the occurrence of stable aberrations is non-random when examining a larger number of chromosomes including smaller ones and whether incidence is disproportional to the genomic content of any given chromosome, particularly chromosome 6.
2. Material and Methods
2.1 Study Population
Analysis quantifying the presence of chromosomal aberrations was performed on a subset of 48 newborns whose mothers enrolled in the longitudinal birth cohort of urban African American and Dominican mothers and newborns conducted by the CCCEH and delivered between the years 2005-2006. All available cord blood samples collected from cohort participants born between April 2005 and April 2006 were included. All participating mothers signed an approved consent in accordance with the Institutional Review Board of the Columbia University Medical Center. As previously described, this population excluded mothers who smoked during pregnancy [10]. Newborns in our subset did not differ from the remainder of the overall cohort with respect to gender, presence of household smokers, and ethnicity; however, our present subset had a lower proportion of mothers completing high school and had lower levels of air PAH in personal air monitor samples (see below). Exposure to environmental tobacco smoke (ETS) was defined by presence or absence of a smoker in the home [11].
2.2 Air PAH measurements
PAH levels were measured prenatally as previously described[10]. In brief, mothers wore or kept with them personal air monitors for 48 consecutive hours during their third trimester of pregnancy. Air PAH levels were analyzed at the Southwest Research Institute (Dr. D. Camann’s laboratory). For our analysis, as for other analyses involving data on levels of PAH from the personal air monitors in the CCCEH cohort, a composite PAH variable (called “total PAH”) was derived from the summation of all 8 potentially carcinogenic PAHs measured (benz[a]anthracene, chrysene, benzo[b]fluroanthene, benzo[k]fluroanthene, B[a]P, indeno[1,2,3-cd] pyrene, disbenz[a,h]anthracene and benzo[g,h,i]perylene [10]. As in prior studies[10], samples not meeting quality control criteria were excluded from analysis.
2.3 Cytogenetic Laboratory Methods
We collected, cultured and hybridized our samples using the procedures described previously [9]. Briefly, cord blood was collected into a heparinized tube immediately after the delivery of each child. Whole blood (0.8 milliliters) was then cultured for 72 hours in PBmax Complete Media (Invitrogen, Carlsbad, Ca.) at 37°C using standard techniques. Colcemid was added for 20 minutes prior to harvesting. Lymphocytes were then treated with hypotonic KCl and fixed in 3:1 methanol acetic acid before being prepared in metaphase spreads. Replicate cultures were performed for each cord blood when possible. In order to increase the yield of scoreable metaphases per slide, we utilized commercially available individual WCP (Cytocell, UK) for chromosomes 1,2,4,12,19 in red and chromosomes 3,5,6,11,14 in green. The colors for the chromosomes were chosen based on morphology in order to facilitate distinguishing individual chromosomes by combined contrasting colors and morphology. For each case, chromosomes 1-6 were hybridized on one set of slides and chromosomes 11,12,14,19 were hybridized on a separate set of slides, using DAPI counter stain (Cytocell, UK). A 6q sub-telomere specific probe (RP11-307K1 and RP11-292F10) was incorporated in order to detect chromosome 6-specific aberrations and to definitively differentiate chromosomes 5 and 6.
Chromosomes were selected based on the possibility of identifying them with WCP and morphology and based on the frequency of involvement in translocations found in pediatric Acute Lymphoblastic Leukemia (ALL): chromosome 11 (present in the t(4;11) and t(11;19) translocations and involved in 25.6 % of detectable translocations and 9.3% of additions/deletions in pediatric ALL), chromosome 12 (involved in the TEL-AML1, t(12; 21) and involved in 5.8% of detectable translocations and 10.1% of additions/ deletions/duplications in pediatric ALL); chromosome 14 (involved in the t(8;14) and t(11;14) translocations and in 12.8% of detectable translocations and 2.3% additions/deletions in pediatric ALL), and chromosome 19 (involved in t(11;19) and t(1:19) and in 9.84 % of detectable translocations and 1.8% of additions/deletions/duplications in pediatric ALL). Chromosomes 1-6 were selected for comparability with prior studies.
The 6q sub-telomere specific probe (RP11-307K1 and RP11-292F10) was generated by one of our study cytogeneticists (VJ). Single BAC colonies were inoculated in LB/chloramphenicol and the PAC colonies were inoculated in LB/kanamycin and cultured overnight, followed by DNA preparation using the Templiphi 100 Amplification Kit (Amersham Biosciences, GE Healthcare; Piscattaway, NJ). One microgram of amplified DNA was labeled using Spectrum Red dUTP by a nick translation labeling kit (Vysis, Downer’s Grove, IL). One microliter of the resulting red 6qtel probe was applied to each slide at the time of applying the WCP mixture for chromosomes 1-6. Hybridization and washing procedures were performed as described previously[9]. Visualization of FISH signals was performed on a fluorescence microscope (Olympus Bx-UCB, Olympus, Japan) equipped with appropriate filters (FITC, TRITC, and DAPI) and Cytovision software (Genetix, New Milton,UK).
Scoring was performing by trained clinical cytogenetic technicians who were blinded to identification or exposures. Inclusion criteria for counting metaphases included good spread, absence of broken metaphases, readable color signal intensity and complete visualization of 12 chromosomes in the chromosomes 1-6 and 8 chromosomes in the chromosomes 11,12,14,19 and visualization of each centromere. Metaphases containing aneuploidy were not scored for aberrations, however the aneuploidy was recorded separately as either chromosomal gain or loss. All the abnormalities found were recorded with their given coordinates and recorded as photographs utilizing the CytoVision Platform Software (Genetix, UK). Questionable aberrations were confirmed using the inverse DAPI feature of CytoVision. All potential chromosomal aberrations were independently reviewed by the principal study cytogeneticist (DW) who was also blinded to exposure data and subject identity.
Chromosomal aberrations were classified according to the following morphology in accordance with the ISCN 2009 classification system [12]: “additions” were unbalanced translocations, i.e. chromosomes containing an extra piece of chromosome that appeared a different color with hybridization; “translocations” were balanced translocations, i.e. chromosomes containing an additional piece of chromosome with a corresponding change in a second painted chromosome; “deletions” had a missing portion of a chromosome; “duplications” were chromosomes with an attached extra piece of a chromosome that hybridized with the same color; “broken chromosomes” were chromosomes that were in 2 or more pieces without appreciable loss of genetic material. Other abnormalities were reported including: fragments ( an acentric chromosome, painted but of unknown origin), and rings. Translocations were documented using both the “classical” (one break per balanced translocation) and the PAINT system (two breaks are noted for each balanced translocation) [13]. As noted above aneuploidies were noted but not as part of the scoring of aberrations and those metaphases containing aneuploidy were excluded from the total count of metaphases scored. All cells with aneuploidy were not included in those scored for stable aberrations and thus did not go into the calculation of aberration frequency or genome equivalence. Aneuploidy was noted and all cells with aneuploidy were photographed and reviewed by our senior cytogeneticist (DW). However any other aberrations occurring in these cells (concurrent aneuploidy with stable aberrations were seen only in 3 metaphases of all those scored for the 48 cases) were not recorded and those cells did not contribute to the aberration frequency or total aberrations for that case.
Unidentified red chromosomes were presumed to represent either chromosomes 1, 2, 4, or 12 or 19 depending on the probes utilized, and unidentified green chromosomes were presumed to be composed of either 3, 5, or 6p, or 11 or 14. Aberrations containing clearly visible centromeres were considered stable aberrations (able to persist in subsequent cell divisions) and were counted in subsequent analyses. Fragments without centromeres and aneuploidies were not considered stable aberrations and were excluded from subsequent analyses. For each cord blood sample, 1,000 whole genome equivalents, or 1500 metaphases were scored and samples were considered “completely scored” when approximately 750 metaphases were scored on slides hybridized with a given set of probes (either 1-6, or 11-19). For chromosomes 1-6, an average of 2.87 (SD 1.95) slides were scored and for chromosomes 11,12,14 and 19, an average of 2.66 (1.64) slides were scored.
The results of the scoring of the WCP FISH were entered into a Microsoft® Access database according to a unique identification code indicating sample time-point, participant ID number, and slide number. WCP FISH scoring results were noted by study staff and entered along with chromosome location, slide quadrant and aberration type. The aberration and translocation frequencies were calculated from the number of stable aberrations per number of cells (metaphases) analyzed, adjusted for 100 cell equivalents (CE) using the correction factors calculated from the proportion of the genome painted simultaneously in a given slide using the formula for 2 color paints by Lucas [14]. The correction factors were therefore calculated separately for chromosomes 1-6, and for 11,12,14,19. Ascribed genetic content was based on the Human Genome Project base-pair (bp) delineation: Chromosome 1: 246 mega bp (Mbp), 2: 243 Mbp, 3: 199 Mbp, 4: 191 Mbp, 5: 181 Mbp, and 6: 170 Mbp (Total of 1230 Mbp in chrom 1-6); chromosome 11: 134 M bp, 12: 132 Mbp, 14: 105 Mbp, and 19: 63 Mbp (Total of 434 Mbp in chromosomes 11,12,14,19 together) [15].
2.5 Statistical Analysis
Summary statistics were calculated to describe sample characteristics. The Chi square test was used to detect the discrepancies between observed and expected (based on the percent of genetic content for each chromosome within each set of chromosomes that were simultaneously painted) occurrence of stable aberrations for each specific chromosome. To compare group differences in continuous variables,T-test was used when variables had approximate normal distributions; otherwise, Wilcoxon rank sum test was used. Group differences in dichotomous variables were compared using Fisher’s exact test. Spearman correlation coefficient was used for bi-variate associations between quantitative variables. Because we noted that the variance of both translocations and stable aberrations increased with their means, we used negative binomial regression models to examine the association between chromosomal aberration and translocation frequencies in cord blood and prenatal air PAHs, with and without control for child’s sex, ethnicity (Dominican vs. African-American) and smoking status at home[16]. Prenatal airborne PAH levels had a skewed distribution and were logarithmically transformed in order to meet assumptions for T-tests and to reduce the impact of extreme values when used as the main predictor in the models for predicting chromosomal aberration frequency. To aid interpretation, we used model parameters to derive the ratio of the mean frequencies of chromosome aberrations associated with a doubling of airborne PAHs, along with the corresponding 95% confidence interval (CI). Kruskal Wallis test was used to detect differences in frequencies of chromosomal aberrations and translocations among PAH groups categorized by tertiles of PAH levels. Statistical significance level of the tests was set at .05 and statistical analysis was performed with SAS 9.3.1 and SPSS 17.
3. RESULTS
3.1 Distribution of Chromosomal Aberrations
Among the 48 cord blood samples scored, 38 (79%) had at least one detectable stable aberration in the 1500 metaphases scored in their cord blood. Stable aberrations were found in all 10 chromosomes examined. Additionally, unstable ring formations were noted involving chromosomes 3, 6, 11 and 12. The chromosome specific comparison of observed versus expected aberrations is shown in Table 3.
Table 3.
Comparison of stable aberrations detected on painted chromosomes, shown by occurrence on individual chromosomes in 48 cord blood samples
| Slide set | ||||
|---|---|---|---|---|
| Chromosomes 1-6 | % painted DNA in slide set |
Obser ved |
Expected | Observed/ Expected |
| Chromosome 1 | 20.0 | 3† | 9.2 | 0.33 |
| Chromosome 2 | 19.4 | 9 | 8.924 | 1.01 |
| Chromosome 3 | 16.3 | 6 | 7.498 | 0.80 |
| Chromosome 4 | 15.5 | 10 | 7.13 | 1.40 |
| Chromosome 5 | 14.8 | 5 | 6.808 | 0.73 |
| Chromosome 6 | 14.0 | 16*** | 6.44 | 2.48 |
| Total, Chromosomes 1- 6 |
100 | 53** | 46 | 1.15 |
|
Chromosomes
11,12,14,19 |
||||
| Chromosome 11 | 31.1 | 5* | 12.75 | 0.39 |
| Chromosome 12 | 30.9 | 10 | 12.67 | 0.79 |
| Chromosome 14 | 23.5 | 15 | 9.64 | 1.56 |
| Chromosome 19 | 14.5 | 12* | 5.95 | 2.02 |
| Total, Chromosomes 11,12,14,19 |
100 | 46** | 41 | 1.12 |
Yates’ chi square for overall difference in chromosomal distribution of aberrations between Observed and Expected for cord blood: 17.4 (df=5); 7 for Chrom1-6; 12.12 (df=3) for Chrom 11,12,14,19
p<0.0005
p<0.007
p<0.05
p=0.06.
aberrations involving more than one painted chromosome (translocations) were noted for each chromosome involved
In our prior study [17], we demonstrated that the distribution of aberrations in chromosomes 1-6 was not consistent with a distribution based on DNA content (p<0.007). In the present study (Table 1) chromosomes 1-5 exhibited generally fewer stable aberrations than predicted based on DNA content while chromosome 6 showed a significantly greater incidence (p<0.0005). Among our second set of chromosomes (11,12,14,19), aberration incidence in chromosome 19 was also higher than expected based on genomic content (p < 0.05). The aberration incidence in chromosome 14 was also somewhat higher than that expected based on genomic content; however T cells are known to be prone to aberrations in chromosomes 7 and 14, the sites of T cell receptors.
Table 1.
Comparison of demographic features and aberration frequency between all infants whose cord blood was scored, and those for whom PAH measurements were available
| All Children (N=48)* |
Children with PAH measures (N=35) |
||
|---|---|---|---|
| Smoker in home* | Yes | 16 | 10 |
| No | 32 | 25 | |
| Gender* | Male | 25 | 20 |
| Female | 23 | 15 | |
| Ethnicity* | Dominican American | 33 | 25 |
| African American | 15 | 10 | |
| Metaphases scored, Chromosomes 1-6 * |
Mean (SD) | 832 (135) | 846 (158) |
| Metaphases scored Chromosomes 11,12,14,19 * |
Mean (SD) | 854 (128) | 868 (139) |
| Total prenatal air PAH ng/m3 | Mean (SD) | 1.81 (1.25) | |
| Birthweight (grams)* | Mean (SD) | 3393.92 (402.56) | 3351.90 (387.58) |
| Chrom. 1-6 translocation frequency per 100CE* |
Mean (SD) | 0.12 (0.30) | 0.154 (0.345) |
| Chrom. 1-6 stable aberration frequency per100CE* |
Mean (SD) | 0.24 (0.35) | 0.272 (.392) |
| Chrom. 6 stable aberration frequency per100CE* |
Mean (SD) | 0.07 (0.20) | 0.081 (0.216) |
| Chrom. 11,12,14,19 Stable Aberr Frequency per100CE* |
Mean (SD) | .45 (.63) | .55 (.69) |
| Chrom. 11,12,14,19 translocation frequency per100CE* |
Mean (SD) | .25 (.33) | .29 (.34) |
differences are not significant between children with (35) and without (13) PAH measures (N=35) using Fisher’s exact test and Mann Whitney.
4.2 Aberration Types and Frequency
4.2.1 Aberration types
Stable aberrations in our population were predominantly deletions and translocations: additions, which accounted for a large proportion of the aberrations we detected, are unbalanced translocations. Translocations were quantified using both the classical and PAINT systems though only the PAINT system was used to calculate the frequency of translocations. The distribution of aberrations noted in our population is shown in Table 2. Aberration frequency was calculated using total number of stable aberrations observed in a minimum of 750 metaphases divided by the total number of metaphases counted within the sample and adjusted for 100 Cell Equivalents using the correction factor calculated from the formula from Lucas [18] using the proportion of the genome painted for the set of either chromosomes 1-6 or 11,12,14,19. The raw mean aberration frequency in our 48 samples was 0.137 per 100 metaphases in chromosomes 1-6, and 0.114 in chromosome 11, 12, 14, 19 and did not differ between the two sets of chromosomes (p =0.19 for paired samples t-test). Adjusted for the whole genome equivalent correction factor, the mean aberration frequency in our 48 cord blood samples for chromosomes 1-6 is 0.24 (per 100 CE) and for chromosomes 11-19 it is 0.45 per 100CE. The translocation frequency in our 48 cord blood samples was 0.12 per 100 CE for chromosomes 1-6, and 0.25 per 100 CE for chromosomes 11,12,14,19. Given that our aberrations are not distributed proportionate to the DNA content of the chromosomes, we use the whole genome equivalent adjustment here for the purpose of facilitating comparison with other reports in the literature including our prior reported frequency of 0.56 [9, 19]. Our current mean stable aberration frequency in the set of chromosomes 1-6 is significantly decreased from that reported in our pilot study (p<0.001),however our whole genome equivalent corrected aberration frequency in chromosomes 11,12,14,19 is comparable with our prior reported aberration frequency in chromosomes 1-6. Overall, our aberration frequencies are consistent with those seen in other newborn populations. We suspect that much of the decrease in the chromosome 1-6 aberration frequency is related to decreased PAH exposure over time in the study area as discussed below. Aberration frequencies did not differ by ethnicity or gender in either set of chromosomes, consistent with findings in a recent meta-analysis [20]. The mean aberration frequencies in cord samples by chromosome set suggested equal frequency in chromosomes 1-6 compared to chromosomes 11, 12, 14 & 19, despite differences in their genetic content. The combined DNA content of chromosomes 1-6 (1232 Mbp) is approximately 2.83 times that of chromosomes 11,12,14,19 combined (435 Mbp) [15]. We excluded aneuploidy from our classification of stable aberrations because of the concern that artifact could contribute to its detection in the cells scored. In addition, in our prior work, we had excluded aneuploidy and thus wanted our present results to be comparable to those prior. However, recent mouse model work has shown the tumorigenic role of aneuploidy when present as the loss or gain of one or a few chromosomes, as a marker of “moderate genomic instability” [21]. In the metaphases in which we were able to detect aneuploidy, this was present in only a few chromosomes thus it might be relevant as a measure of genomic instability. When we compared the prenatal PAH levels, as well as non-aneuploidy stable aberration frequency, and translocation frequency between cord bloods with or without aneuploidy affecting at least 1 chromosome, these did not differ. We did consider that chromosomal gains are likely real and not secondary to artifact. However, the majority of aneuploidy we detected was due to chromosomal loss, not gains: in chromosomes 1-6, 16 cord samples had aneuploidy, but only 2 cord samples had chromosomal gains; in chromosomes 11,12,14,19, 14 cord samples had aneuploidy, and 6 of these had chromosomal gains. The 8 children with gain of at least one chromosome also did not differ from other children in prenatal PAH or in any measure of stable (non-aneuploidy) aberration or translocation frequency.
Table 2.
Distribution of aberration subtypes in Chromosomes 1-6 and in chromosomes 11,12,14,19
| Type of Aberration | Aberrations noted in chromosomes 1-6 |
Number of aberrations noted in chromosomes 11,12,14,19 |
|---|---|---|
| Fragments,‡ | 18 | 6 |
| aneuploidy‡ | 27 | 19 |
| deletion | 15 | 13 |
| duplication | 1 | 2 |
| inversion ‡ | 1 | 0 |
| ring | 5 | 3 |
| broken‡ | 5 | 1 |
| Translocations by PAINT definition |
16 | 4* |
| additions (unbalanced translocation) |
10 | 19 |
| insertion | 2 | 4 |
| Translocations, classical definition, balanced |
9 | 3* |
one is dicentric
not counted as a stable aberration
4.2.2 PAH Exposure and Chromosomal Aberrations
Prenatal air exposure data meeting quality control criteria were available for 35 newborns with aberration frequencies scored in both sets of chromosomes. The airborne PAH level ranged between 0.47 and 5.557 with median=1.38, mean=1.81 and SD=1.25. This sample included 20 boys and 15 girls; 10 African-Americans and 25 Dominicans. For 10 of the 35 newborns, there had been a smoker living in the home during the pregnancy. Air PAH level did not differ by child’s sex, ethnicity or smoking status at home. Increasing prenatal PAH air levels were appeared to be associated with increased total stable aberration frequency in chromosome 6 alone (p =0.054-0.066) with and without adjusting for gender, ethnicity and prenatal ETS exposure. Prenatal PAH exposure was related to aberration frequency in the set of chromosomes 11-19 when adjusting for the three control variables (p=0.02). For chromosomes 1-6 (combined), the trend in increasing aberration frequency with increasing PAH level was not statistically significant (p=0.17).
The increase of aberration frequencies for a doubling of air PAH levels was derived from the negative binomial regression model parameter to aid interpretation. The relationship between chromosomal aberration frequency and PAHs, with and without adjusting for gender, ethnicity (Dominican vs. African-American) and presence of a smoker at home, is summarized in Table 4. In particular, for the set with chromosomes 1-6, the mean aberration frequency increased by a factor of 1.49 (95% CI: 0.84, 2.66; p=0.17) with a doubling of prenatal PAH levels; for chromosomes 11, 12, 14, and 19, the mean aberration frequency increased by a factor of 2.00, (95%CI:1.11, 3.62; p=0.02). Interestingly, the mean aberration frequency in chromosome 6 increased by a factor of 3.16 (95%CI: 0.93, 10.77; p=0.066) with a doubling of PAH exposure, while for chromosomes 1-5, the mean aberration frequency did not differ by the level of PAH exposure. Table 5 presents the mean aberration and translocation frequencies by the three PAH groups categorized with tertiles of PAH levels. There is a trend of increasing translocation frequency with increasing PAH levels, though not statistically significant. In the upper tertile of PAH exposure, frequencies of both stable aberrations and translocations appear higher in both sets of chromosomes painted, although the trend is statistically significant only in chromosomes 11,12,14,19 .
Table 4.
Mean ratio of frequency in specific set of chromosomes for doubling air PAH (ln transformed)
| Aberration | Unadjusted | Covariate adjusted* | ||
|---|---|---|---|---|
| Chromosomes | Mean ratio (95% Cl) | p- value |
Mean ratio (95% Cl) | p- value |
| 1,2,3,4,5,6 | 1.49 (0.78, 2.83) | 0.23 | 1.49 (.84, 2.66) | 0.17 |
| 1,2,3,4,5 | 1.08 (0.53, 2.22) | 0.83 | 1.14 (.615, 2.14) | 0.69 |
| 6 | 3.66 (0.98, 13.71) | 0.05 | 3.16 (0.93, 10.77) | 0.06 |
| 11, 12, 14, 19 | 1.705 (0.892, 3.261) | 0.11 | 2.00(1.11, 3.62) | 0.02 |
adjusting for gender, ethnicity (Dominican vs. African-American) and presence of a smoker at home.
Table 5.
Frequencies of chromosome aberrations and translocation by PAH category (tertiles)
| Tertiles of PAH | PAH 0.47-0.94 | PAH 1.029-1.996 | PAH 2-5.557 | |
|---|---|---|---|---|
| Location of Aberrations or Translocations * |
PAH<1 N=10 Mean freq (SD) |
PAH 1-1.99 N=14 Mean freq (SD) |
PAH 2-6 N=11 Mean freq (SD) |
Kruskal- Wallis Test p-value |
| Stable Aberrations in Chromosomes 1-6 |
.2117 (.2859) | .2151 (.1757) | .3783 (.6137) | .35 |
| Stable aberrations in Chromosome 6 |
.0185 (.0586) | .0738 (.1036) | .1481 (.3634) | .82 |
| Translocation in Chromosomes 1-6 |
.1238 (.2264) | .0932 (.1460) | .2601 (.5579) | .93 |
| Stable Aberrations in Ch11,12,14,19 |
.2177 (.2820) | .7932 (1.0143) | .9999 (.9308) | .036 |
| Translocation in Chromosomes 11,12,14,19 |
.2177 (.2820) | .3554 (.4014) | .5104 (.5332) | .27 |
includes both balanced and unbalanced translocations, quantified using PAINT system
Together our data suggest that the association between prenatal PAH exposure and aberration frequency in the set of chromosomes 1-6 is dominated by the association between PAHs and aberration frequencies in chromosome 6. In contrast, prenatal airborne PAH exposure was significantly associated with the total aberration frequency in the set with chromosomes 11,12,14,19, but did not appear to be dominated by the aberration frequency in any individual chromosome of that set.
ETS has been associated with genetic damage and incidence of chromosomal aberrations in other studies [22]. In the CCCEH cohort, ETS has been highly correlated with prenatal cotinine level and has been shown to be a valid indicator for tobacco exposure [11]. We examined the relationship between presence of ETS (measured by maternal report of whether a smoker was present in the home during pregnancy) and chromosomal aberrations but found no association. Although ETS alone did not predict aberration frequency in our current population inclusion of ETS in the final model did affect the parameter of the association between PAH and aberration frequency (Table 4).
In our prior study of chromosomes 1-6 in an earlier subset of CCCEH newborns, chromosome damage was not predicted by chromosome size nor was it randomly distributed based on DNA content (p<0.001). The breakpoint frequency appeared highest in the chromosome with the least DNA content of the chromosomes studied (chromosome 6) [17]. However, we could not definitively differentiate chromosome 6 from chromosomes 5 or 3 (3, 5 and 6 all fluoresce the same color). With the addition of the 6qtel probe, we have now been able to confirm that chromosome 6 is indeed at increased risk for aberrations and specifically at risk for developing aberrations in association with exposure to prenatal PAH exposure. Aberrations in chromosome 6 occurred more frequently in the larger q arm with 18/31 (58%) of aberrations clearly involving 6q and 3 others (rings) likely involving breaks in 6q as well. Aberrations involving 6q have been reported in multiple malignancies including ALL; and 6q contains a candidate tumor suppressor gene (LOT1)[23]. Figure 1 shows an observed translocation involving 6q.
Figure 1.
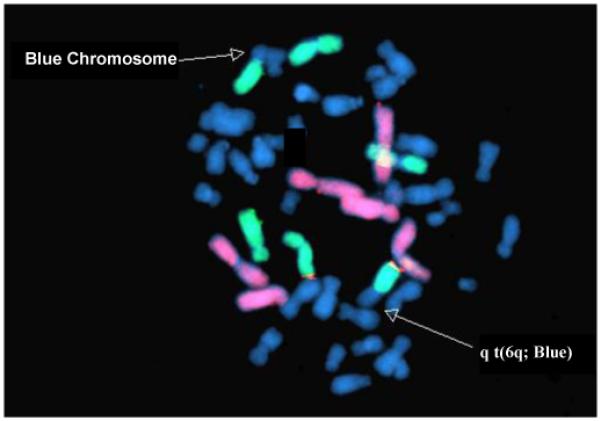
Photomicrograph demonstrating a translocation involving 6q with an unstained chromosome. Chromosomes 1,2,4, are in red and chromosomes 3,5,6 are in green. All remaining chromosomes stain blue.
Total prenatal airborne PAH levels in the CCCEH cohort have declined steadily and significantly over time, such that mean levels of PAHs in 2006 were less than half that in 1999 [24]. A series of policy changes involving use of cleaner fossil fuels for mass transit vehicles contributed to decreasing fuel emissions in New York City after 2000. PAH levels in the cohort decreased with later years of birth in the cohort. ETS, and other household sources of inhaled PAHs such as candles and incense did not affect personal air PAH levels [24]. Participants included in our earlier report were CCCEH cohort newborns from whom at least 30 ml of cord blood was collected at birth during the period from 1999 to 2002 [9]. In the present study, participants were born between the spring of 2005 and the spring of 2006. The current report includes all cohort participants born between March 2005 and April 2006. Among those subjects included in our earlier study, the mean prenatal total PAH level was 3.69 ng/m3 (SD 3.15); in the current study the mean total PAH level was significantly lower (mean: 1.81 ng/m3; SD: 1.25) (p < 0.005). However, even at these lower levels of PAHs, we have shown here that the level of prenatal PAH exposure predicts presence of chromosomal aberrations overall and specifically in certain chromosomes in cord blood samples.
5. DISCUSSION
Our data demonstrate a significant association between elevated prenatal PAH exposure and increased levels of chromosomal aberrations in cord blood samples from an urban cohort, even at PAH levels that are significantly decreased from our prior report [9]. Further, we have demonstrated that the effects of PAHs appear to be partially chromosome-specific and extend beyond chromosomes 1-6 to smaller chromosomes such as 11,12,14, and 19. Importantly, our study is the first to identify chromosome 6 as particularly susceptible to the effects of PAHs. The stable aberrations we have documented include a number of morphologies including ring formations, identified in other studies as significantly predictive of later development of cancer in adults [2].
Our examination of the presence of chromosomal aberrations in healthy newborns delivered during the end of the recruitment phase of the CCCEH cohort (2005-2006) has documented a decrease in stable aberration frequency in chromosomes 1-6 compared to the frequency observed in a subset of the cohort born earlier (1999-2002), consistent with the decrease in mean PAHlevels (from personal prenatal air monitoring) from 3.69 (1999-2002) to 1.81 ng/m3(2005-2006) [24]. This decrease in airborne PAH has resulted from deliberate policies to improve air quality in New York City [24]. Nevertheless, we have documented in this study that aberrations continue to be present even with lower levels of exposure and are associated with prenatal exposure to PAHs.
This work confirms our prior observation that occurrence of stable aberrations occurring in cord blood samples of healthy infants without known radiation exposure is non-random and is not proportional to the genomic content of a given chromosome. The data presented above demonstrate that stable aberrations in chromosomes 11,12,14 and 19 are also neither proportional to genomic content of a given chromosome nor random. Additionally, aberration incidence in chromosome 6 is significantly greater than expected. Chromosomal aberrations in both chromosome 6 and the smaller chromosomes examined were associated with exposure to prenatal PAH exposure. The chromosomal aberration frequency in our cord samples can therefore be considered a biomarker of genetic damage reflecting environmental exposure to air pollutants as suggested by our prior studies [9] and others [8, 22].
As noted, in our prior study chromosome damage was not predicted by chromosome size or DNA content, and breakpoint frequency appeared to be highest in chromosome 6 and lowest in chromosome 1 (10). However, in our prior study we did not have the ability to definitively differentiate chromosome 6 from chromosome 5 or 3. With the addition of the specific chromosome 6 telomere probe, we can now confirm that chromosome 6 is at increased risk for aberrations in association with exposure to prenatal PAH.
Our present findings differ from those of our earlier pilot study [9]. In that study of 60 subjects, the mean stable aberration frequency was 0.58 per 100 CE [9]. Even so, our present rates for stable aberrations in chromosomes 1-6 (0.24 per 100 CE) are substantially lower than previously reported by our group; this is likely attributable to the fact that PAH exposure was also significantly lower in our present study. The results suggest a beneficial effect from clean air policies.
Our frequency data are comparable to those of others who have examined rates of translocations in this age group. A pooled analysis of age-related variations in chromosome frequency included results for translocation frequencies in newborns in which chromosomes 1-6 were examined with WCP [19]. In our data, the stable aberration rate in chromosomes 1-6 was 0.24 per 100 CE and our translocation rate was 0.12 per 100 CE, which is more than 2 times higher than that reported for newborns from California and Cumbria, UK by Sigurdson et. al [19] though only half as high as that recently reported among African American newborns in Pittsburgh [16], suggesting that our population might be exposed to an intermediate level of PAH exposure.
Our observed association between stable chromosomal aberrations and PAHs is consistent with other studies that have found that chromosomal aberrations are associated with exposures to PAH-containing mixtures. Ramsey et. al demonstrated a 1.5 fold increase in newborn aberrations in children whose mothers smoked during pregnancy [25, 26]. Since tobacco smoke is a recognized source of PAHs, these findings are supportive of an association between prenatal PAH exposure and increasing chromosomal aberrations. Similarly, in adults occupationally exposed to ambient PAHs, rates of chromosomal aberrations were significantly predicted by levels of airborne PAHs [27].
Chromosome 6 appears to be particularly susceptible to development of chromosomal aberrations in this population as a result of prenatal PAH exposure. Our present data do not allow specific delineation of sites on chromosome 6 that may be especially susceptible to damage by PAHs. Nevertheless, it is intriguing to consider that many critical regulating genes including E2F3, and MYB (expressed predominantly in immature progenitor cells of all haemopoietic lineages) are present on 6q. The presence of rings in our healthy newborns is also unusual and deserves further examination particularly because, in a recent meta analysis examining the predictive nature of chromosomal aberrations for future development of adult cancer, the presence of ring chromosomes in peripheral lymphocytes was associated with a 2.2-fold significantly increased risk of later incidence of cancer [2]. Clearly these findings suggest the need for further investigation. Although we did not count aneuploidy as a stable aberration and did not score metaphases containing aneuploidy, we did note its occurrence in metaphases that were considered complete (unbroken). Cases in which aneuploidy was noted did not appear to differ in their stable aberration or translocation frequency or in their prenatal PAH exposure. Because there were relatively few cells with aneuploidy we do not believe that excluding those cells from scoring affected our calculations of aberration frequency, Although there is recent data suggesting that aneuploidy may be a predictor of tumorigenesis in mice, the model by Weaver and Cleveland suggests that the tumorigenic role of aneuploidy may be secondary to misregulated gene expression resulting from abnormal combinations of chromosomes [21]. WCPFISH may not be an appropriate model for documenting aneuploidy but a similar tumorigenic effect of misregulated gene expression could result from translocations which WCP FISH is able to detect when these occur between chromosomes painted in different colors.
Prenatal personal air monitor levels of airborne PAHs in the CCCEH cohort have been shown to reflect diverse combustion sources, notably traffic and heating [28]. Prenatal PAH exposure has been linked to a number of adverse outcomes in the CCCEH cohort including decreased head circumference and birth weight among infants born to African American women in the cohort [10], lower mental development index (using the Bayley developmental scales) at age 3 [29], and decreased full scale IQ at age five [30]. Here, we are expand upon our earlier report of a link between prenatal PAH exposure and a validated biomarker of potential cancer risk [1-7]. Although our dataset is small, and thus power to detect associations is limited, we have found association between PAH and the smaller previously unexamined chromosomes (11,12,14,19) as well as for chromosome 6. Our findings suggest the need for further investigation with larger sample sizes in order better examine these effects.
In summary, our data suggest that the effect of prenatal PAH exposure on incidence of chromosomal aberrations persists even at lower levels of PAH exposure and may be concentrated on specific chromosomes. Together these findings suggest that PAH exposure may have significant sub-clinical genetic effects at birth and suggest the need for a better understanding of potential pathways in the development of seemingly disparate effects of PAHs on the newborn. Further exploration to determine PAH-susceptible regions on chromosome 6 may provide insight into mechanisms of PAH related toxicity. Lastly, our work suggests that decreasing airborne PAH levels through effective public policies may ultimately contribute to decreasing cancer risk.
Acknowledgements
This study was supported by the National Institute of Environmental Health Sciences (grants 5P01ES09600, P50 ES015905, 5RO1ES08977, RO1ES111158, RO1ES012468, and ES09089), US Environmental Protection Agency (grants R827027, 8260901, and RR00645), and the New York Community Trust. The authors gratefully acknowledge Taknida Tubo, Patricia Eroglu, Denisa Miliku, and Sara Church for cytogenetic expertise and technical assistance; Lori Hoepner for critical assistance with exposure data; Ida Suen and Silvia Diaz Carreño for assistance in manuscript preparation; and Dr Robin Whyatt and the staff of the CCCEH for enabling this study and assuring appropriate sample collection.
Abbreviations
- airPAH
Ambient Polycyclic Aromatic Hydrovarbons
- ALL
Acute Lymphoblastic Leukemia
- CA
Chromosomal Aberrations
- CCCEH
Columbia Center for Children’s Environmental Health
- ETS
Environmental Tobacco Smoke
- FISH
Flourescent In Situ Hybridization
- Mbp
Mega base pair
- PAH
Polycyclic Aromatic Hydrocarbons
- WCP
Whole Chromosome Probe
Footnotes
Publisher's Disclaimer: This is a PDF file of an unedited manuscript that has been accepted for publication. As a service to our customers we are providing this early version of the manuscript. The manuscript will undergo copyediting, typesetting, and review of the resulting proof before it is published in its final citable form. Please note that during the production process errors may be discovered which could affect the content, and all legal disclaimers that apply to the journal pertain.
References
- 1.Bonassi S, Hagmar L, Stromberg U, Montagud AH, Tinnerberg H, Forni A, Heikkila P, Wanders S, Wilhardt P, Hansteen IL, Knudsen LE, Norppa H, European Study Group on Cytogenetic Biomarkers and Health Chromosomal aberrations in lymphocytes predict human cancer independently of exposure to carcinogens. Cancer Res. 2000;60:1619–25. [PubMed] [Google Scholar]
- 2.Bonassi S, Norppa H, Ceppi M, Stromberg U, Vermeulen R, Znaor A, Cebulska-Wasilewska A, Fabianova E, Fucic A, Gundy S, Hansteen IL, Knudsen LE, Lazutka J, Rossner P, Sram RJ, Boffetta P. Chromosomal aberration frequency in lymphocytes predicts the risk of cancer: results from a pooled cohort study of 22 358 subjects in 11 countries. Carcinogenesis. 2008;29:1178–83. doi: 10.1093/carcin/bgn075. [DOI] [PMC free article] [PubMed] [Google Scholar]
- 3.Bonassi S, Znaor A, Norppa H, Hagmar L. Chromosomal aberrations and risk of cancer in humans: an epidemiologic perspective. Cytogenetic and Genome Research. 2004;104:376–382. doi: 10.1159/000077519. [DOI] [PubMed] [Google Scholar]
- 4.Hagmar L, Bonassi S, Stromberg U, Brogger A, Knudsen LE, Norppa H, Reuterwall C. Chromosomal aberrations in lymphocytes predict human cancer: a report from the European Study Group on Cytogenetic Biomarkers and Health (ESCH) Cancer Res. 1998;58:4117–21. [PubMed] [Google Scholar]
- 5.Hagmar L, Stromberg U, Bonassi S, Hansteen IL, Knudsen LE, Lindholm C, Norppa H. Impact of types of lymphocyte chromosomal aberrations on human cancer risk: results from Nordic and Italian cohorts. Cancer Res. 2004;64:2258–63. doi: 10.1158/0008-5472.can-03-3360. [DOI] [PubMed] [Google Scholar]
- 6.Hagmar L, Stromberg U, Tinnerberg H, Mikoczy Z. Epidemiological evaluation of cytogenetic biomarkers as potential surrogate end-points for cancer. IARC Sci Publ. 2004:207–15. [PubMed] [Google Scholar]
- 7.Fucic A, Zeljezic D, Kasuba V, Kopjar N, Rozgaj R, Lasan R, Mijic A, Hitrec V, Lucas JN. Stable and unstable chromosome aberrations measured after occupational exposure to ionizing radiation and ultrasound. Croat Med J. 2007;48:371–7. [PMC free article] [PubMed] [Google Scholar]
- 8.Rossner P, Bavorova H, Ocadlikova D, Svandova E, Sram RJ. Chromosomal aberrations in peripheral lymphocytes of children as biomarkers of environmental exposure and life style. Toxicol Lett. 2002;134:79–85. doi: 10.1016/s0378-4274(02)00166-2. [DOI] [PubMed] [Google Scholar]
- 9.Bocskay KA, Tang D, Orjuela MA, Liu X, Warburton DP, Perera FP. Chromosomal aberrations in cord blood are associated with prenatal exposure to carcinogenic polycyclic aromatic hydrocarbons. Cancer Epidemiol Biomarkers Prev. 2005;14:506–11. doi: 10.1158/1055-9965.EPI-04-0566. [DOI] [PubMed] [Google Scholar]
- 10.Perera FP, Rauh V, Tsai WY, Kinney P, Camann D, Barr D, Bernert T, Garfinkel R, Tu YH, Diaz D, Dietrich J, Whyatt RM. Effects of transplacental exposure to environmental pollutants on birth outcomes in a multiethnic population. Environ Health Perspect. 2003;111:201–5. doi: 10.1289/ehp.5742. [DOI] [PMC free article] [PubMed] [Google Scholar]
- 11.Rauh VA, Garfinkel R, Perera FP, Andrews HF, Hoepner L, Barr DB, Whitehead R, Tang D, Whyatt RW. Impact of prenatal chlorpyrifos exposure on neurodevelopment in the first 3 years of life among inner-city children. Pediatrics. 2006;118:e1845–59. doi: 10.1542/peds.2006-0338. [DOI] [PMC free article] [PubMed] [Google Scholar]
- 12.Shaffer LG, Campbell LJ, Slovak ML, editors. ISCN 2009: An International System for Human Cytogenetic Nomenclature. Karger, S. Inc.; 2009. [Google Scholar]
- 13.Tucker JD, Morgan WF, Awa AA, Bauchinger M, Blakey D, Cornforth MN, Littlefield LG, Natarajan AT, Shasserre C. A proposed system for scoring structural aberrations detected by chromosome painting. Cytogenet Cell Genet. 1995;68:211–21. doi: 10.1159/000133916. [DOI] [PubMed] [Google Scholar]
- 14.Lucas JN, Awa A, Straume T, Poggensee M, Kodama Y, Nakano M, Ohtaki K, Weier HU, Pinkel D, Gray J, et al. Rapid translocation frequency analysis in humans decades after exposure to ionizing radiation. Int J Radiat Biol. 1992;62:53–63. doi: 10.1080/09553009214551821. [DOI] [PubMed] [Google Scholar]
- 15.Wyrick J, D C. Human Genome Landmarks 2009. U.S. Department of Energy Office of Science; Nov, 2006. Selected Traits and Disorders Mapped to Chromosomes. [Google Scholar]
- 16.Bennett LM, Wang Y, Ramsey MJ, Harger GF, Bigbee WL, Tucker JD. Cigarette smoking during pregnancy: Chromosome translocations and phenotypic susceptibility in mothers and newborns. Mutation Research/Genetic Toxicology and Environmental Mutagenesis. 2010;696:81–88. doi: 10.1016/j.mrgentox.2009.12.015. [DOI] [PMC free article] [PubMed] [Google Scholar]
- 17.Bocskay KA, Orjuela MA, Tang D, Liu X, Warburton D, Perera FP. Fluorescence in situ hybridization is necessary to detect an association between chromosome aberrations and polycyclic aromatic hydrocarbon exposure in utero and reveals nonrandom chromosome involvement. Environ Mol Mutagen. 2007;48:114–23. doi: 10.1002/em.20276. [DOI] [PMC free article] [PubMed] [Google Scholar]
- 18.Lucas JN, Tenjin T, Straume T, Pinkel D, Moore D, 2nd, Litt M, Gray JW. Rapid human chromosome aberration analysis using fluorescence in situ hybridization. Int J Radiat Biol. 1989;56:35–44. doi: 10.1080/09553008914551161. [DOI] [PubMed] [Google Scholar]
- 19.Sigurdson AJ, Ha M, Hauptmann M, Bhatti P, Sram RJ, Beskid O, Tawn EJ, Whitehouse CA, Lindholm C, Nakano M, Kodama Y, Nakamura N, Vorobtsova I, Oestreicher U, Stephan G, Yong LC, Bauchinger M, Schmid E, Chung HW, Darroudi F, Roy L, Voisin P, Barquinero JF, Livingston G, Blakey D, Hayata I, Zhang W, Wang C, Bennett LM, Littlefield LG, Edwards AA, Kleinerman RA, Tucker JD. International study of factors affecting human chromosome translocations. Mutat Res. 2008;652:112–21. doi: 10.1016/j.mrgentox.2008.01.005. [DOI] [PMC free article] [PubMed] [Google Scholar]
- 20.Merlo DF, Ceppi M, Stagi E, Bocchini V, Sram RJ, Rossner P. Baseline chromosome aberrations in children. Toxicol Lett. 2007;172:60–7. doi: 10.1016/j.toxlet.2007.05.016. [DOI] [PubMed] [Google Scholar]
- 21.Weaver BA, Cleveland DW. Aneuploidy: instigator and inhibitor of tumorigenesis. Cancer Res. 2007;67:10103–5. doi: 10.1158/0008-5472.CAN-07-2266. [DOI] [PMC free article] [PubMed] [Google Scholar]
- 22.Neri M, Ugolini D, Bonassi S, Fucic A, Holland N, Knudsen LE, Sram RJ, Ceppi M, Bocchini V, Merlo DF. Children’s exposure to environmental pollutants and biomarkers of genetic damage. II. Results of a comprehensive literature search and meta-analysis. Mutat Res. 2006;612:14–39. doi: 10.1016/j.mrrev.2005.04.003. [DOI] [PubMed] [Google Scholar]
- 23.Abdollahi A, Pisarcik D, Roberts D, Weinstein J, Cairns P, Hamilton TC. LOT1 (PLAGL1/ZAC1), the candidate tumor suppressor gene at chromosome 6q24-25, is epigenetically regulated in cancer. J Biol Chem. 2003;278:6041–9. doi: 10.1074/jbc.M210361200. [DOI] [PubMed] [Google Scholar]
- 24.Narvaez RF, Hoepner L, Chillrud SN, Yan B, Garfinkel R, Whyatt R, Camann D, Perera FP, Kinney PL, Miller RL. Spatial and temporal trends of polycyclic aromatic hydrocarbons and other traffic-related airborne pollutants in New York City. Environ Sci Technol. 2008;42:7330–5. doi: 10.1021/es801273h. [DOI] [PMC free article] [PubMed] [Google Scholar]
- 25.Ramsey MJ, Moore DH, 2nd, Briner JF, Lee DA, Olsen L, Senft JR, Tucker JD. The effects of age and lifestyle factors on the accumulation of cytogenetic damage as measured by chromosome painting. Mutat Res. 1995;338:95–106. doi: 10.1016/0921-8734(95)00015-x. [DOI] [PubMed] [Google Scholar]
- 26.Pluth JM, Ramsey MJ, Tucker JD. Role of maternal exposures and newborn genotypes on newborn chromosome aberration frequencies. Mutat Res. 2000;465:101–11. doi: 10.1016/s1383-5718(99)00217-x. [DOI] [PubMed] [Google Scholar]
- 27.Zidzik J, Kalina I, Salagovic J, Sram RJ, Rossner P, Popov T, Farmer PB. Influence of PAHs in ambient air on chromosomal aberrations in exposed subjects: international study - EXPAH. Mutat Res. 2007;620:41–8. doi: 10.1016/j.mrfmmm.2007.02.021. [DOI] [PubMed] [Google Scholar]
- 28.Tonne CC, Whyatt RM, Camann DE, Perera FP, Kinney PL. Predictors of personal polycyclic aromatic hydrocarbon exposures among pregnant minority women in New York City. Environ Health Perspect. 2004;112:754–9. doi: 10.1289/ehp.5955. [DOI] [PMC free article] [PubMed] [Google Scholar]
- 29.Perera FP, Rauh V, Whyatt RM, Tsai WY, Tang D, Diaz D, Hoepner L, Barr D, Tu YH, Camann D, Kinney P. Effect of prenatal exposure to airborne polycyclic aromatic hydrocarbons on neurodevelopment in the first 3 years of life among inner-city children. Environ Health Perspect. 2006;114:1287–92. doi: 10.1289/ehp.9084. [DOI] [PMC free article] [PubMed] [Google Scholar]
- 30.Perera FP, Li Z, Whyatt R, Hoepner L, Wang S, Camann D, Rauh V. Prenatal airborne polycyclic aromatic hydrocarbon exposure and child IQ at age 5 years. Pediatrics. 2009;124:e195–202. doi: 10.1542/peds.2008-3506. [DOI] [PMC free article] [PubMed] [Google Scholar]