Abstract
The pro-inflammatory effect of high-fat diet has been observed beyond the cardiovascular system, but there is little evidence to support its role in triggering inflammatory bowel disease. GPx1/2-double knockout (DKO) mice deficient in two intracellular glutathione peroxidases, GPx1 and GPx2, on a C57BL/6 (B6) background, have mild ileocolitis on a conventional chow. We fed B6 DKO mice two atherogenic diets to test the dietary effect on atherosclerosis and ileocolitis. Both atherogenic diets have high cholesterol, the Chol+/CA diet has cholic acid (CA) and the Chol+ diet has no CA. The Chol+/CA diet induced severe colitis, but not ileitis, in the DKO mice compared with Chol+ and a Chol- control diet. On the Chol+/CA diet, the wild-type (WT) mice had similar levels of aortic lesions and hypercholesterolemia as DKO mice did, but had no intestinal pathology. The diet-associated inflammatory responses in the DKO mice included increase of colonic pro-inflammatory serum amyloid A 3 expression, plasma lipopolysaccharide and TNF-α levels. The Chol+/CA diet has lowered the expression of unfolded protein response genes, ATF6, CHOP, unspliced XbpU and Grp78/Bip, in WT and DKO mice on the Chol- diet. Thus, we conclude that cholesterol diet weakens colon unfolded protein response, which can aggravate spontaneous colitis leading to gut barrier breakdown. GPx has no impact on atherosclerosis without ultra-hypercholesterolemia.
Keywords: Atherosclerosis, colitis, hypercholesterolemia, glutathione peroxidase, unfolded protein response
Introduction
It is well recognized that diet, like genetics, is an important factor in etiology of inflammatory bowel disease (IBD). Elemental diets cause remission in 90% of patients, and is considered as a first line in therapy for pediatric patients (1, 2). The high-fat diet enriched in cholesterol is a potential risk factor for triggering IBD (3). High-fat diets have recently been shown to enhance inflammation in extra-cardiovascular organs, such as the colon, liver and lung (4-6). The high-fat diets exacerbated dextran sulfate sodium (DSS)-induced acute colitis and lipopolysaccharide (LPS)-induced acute hepatitis in wild-type (WT) mice (4, 5). The pro-inflammatory activity of a high-fat diet in the lung was observed in ApoE-null mice, which had ultra-hypercholesterolemia (6). Considering the dietary impact on the etiology of IBD; it is important to determine whether high-fat diets have detrimental effect on spontaneous ileocolitis.
We previously reported that mice deficient in two glutathione peroxidases, the ubiquitous GPx1 and epithelium-predominant GPx2, GPx1/2-double knockout (DKO) mice, on a mixed B6 and 129Sv (B6;129) genetic background had early-onset spontaneous ileocolitis with a high risk for intestinal cancer (7). The extent of ileocolitis and cancer depended on the luminal microflora as well as genetic background (7, 8). Germ-free DKO mice did not have inflammation (7). Similar to other mouse IBD models, B6 DKO mice were resistant and 129 DKO were sensitive to ileocolitis (8)(unpublished observation). Since B6 DKO mice have very mild IBD, we sought to study the effect of high-fat diets on the spontaneous IBD in these mice.
Several lipid-enriched diets have been developed to study atherosclerotic lesions in mice. Among them, diets developed by Paigen et al. have been demonstrated to induce hypercholesterolemia and aortic lesions in B6 WT mice (9). A most studied atherogenic diet contains high fat, cholesterol (Chol), and cholic acid (CA), which is a primary bile acid included to increase cholesterol and other lipid absorption. GPx1 has been shown to alleviate aortic lesions in ApoE-null mice (10, 11). Since the ApoE-null mice were ultra-hyperlipidemic (14.7- to 19.8-fold higher than normal levels) (10), and apparent functional redundancy of GPx1 and GPx2 isoenzymes (12, 13), we also tested whether GPx1/2 DKO have increased aortic lesions than WT B6 mice do without ultra-hyperlipidemia.
Dietary cholesterol can affect ER signaling for gene activation. A well-known example is regulation of the sterol regulatory element-binding protein (SREBP) in the intestine and liver (14, 15). SREBPs migrate from ER to Golgi; embedded in Golgi membrane, they are digested by site 1 protease (S1P) and site 2 protease (S2P) to be released into nucleus to function as transcription factors to regulate cholesterol metabolism (16). Activating transcription factor (ATF)-6, another ER transmembrane protein, is also activated by the same S1P and S2P to respond to ER stress (16, 17). Whether dietary cholesterol can also affect ATF6-regulated gene expression has not been evaluated. Thus, we also explored the dietary effect on gene expression in the ATF6 pathway in the colon of DKO and WT mice in this study.
Here, we provide evidence on the detrimental effect of high-fat diets on the spontaneous colitis, but not ileitis, in GPx1/2-DKO mice. High-fat diets diminished gene expression involved in unfold-protein responses, which aggravated colitis in the DKO mice manifested with gut barrier breakdown. However, these two glutathione peroxidases have no impact on atherosclerosis in the absence of ultra-hypercholesterolemia.
Materials and methods
Mice and diets
B6 (≥N7; backcrossed to C57BL/6J for at least 7 generations) GPx1/2 DKO and B6 WT (Stratagene-Big Blue®, La Jolla, CA, C57BL/6N) mice were maintained in ventilated cages with free access to food and water. The colony was maintained on irradiated rodent chows, with breeders on a LabDiet containing 9.6% fat (LabDiet 5062, Purina Mills, Inc., Richmond, IN) (Table 1), and the pups on chow containing 5.5% fat (LabDiet 5061, Purina). The Institutional Animal Care and Use Committee approved all procedures done on mice.
Table 1.
Diet composition
| LabDiet1 low fat | LabDiet1 high fat | Chol+/CA | Chol+2 | Chol-2 | |
|---|---|---|---|---|---|
| Content | Atherogenic | ||||
| Protein (% wt) | Mixed (23.4) | Mixed (20.5) | Casein (20.0) | Casein (20.0) | Casein (20.0) |
| Fat (%) | Mixed (5.5) | Mixed (9.6) | Corn oil (1.0) | Corn oil (1.0) | Corn oil (1.0) |
| Cocoa butter | - | - | 15.0 | 15.0 | 15.0 |
| Cholesterol, % | 0.02 | 0.02 | 1.25 | 1.25 | - |
| Cholate (CA), % | - | - | 0.5 | - | - |
| Sucrose, % | 3.68 | 0.43 | 41.8 | 41.8 | 41.8 |
| Other carbohydrate3 (%) | Mixed (56) | Mixed (52.6) | - | - | - |
| KJ (approximate) | 3.3 | 3.8 | 4.3 | 4.3 | 4.3 |
Commercial rodent chows (http://www.testdiet.com). Low-fat LabDiet 5061 is an irradiated diet for maintenance of the mouse colony; high-fat LabDiet 5062 is an irradiated diet for breeders. Chows contain a mixture of whole organisms, thus are non-purified. LabDiets have slightly different amounts of vitamins and minerals from each other and from AIN-76A mixes (J. Nutr. 107: 1340-1348, 1977) and have trace amount (~0.003%) of butylated hydroxyanisole as antioxidant.
The 3 casein-based defined diets, Chol+/CA, Chol+ and Chol- diets, contain AIN-76A mineral mix and AIN-76 vitamin mix and use trace amount (~0.002%) ethoxyquin as antioxidant.
Starch from corn.
Weanling B6 DKO and WT mice (~17 d old) were placed on one of the 3 defined diets (Harlan Teklad, Madison, WI; Table 1) (9). For atherosclerosis studies, female B6 DKO and WT mice were put on Chol+/CA (TD.06135), Chol+ (TD.06527), and Chol-(TD.07390) diets to avoid potential gender bias in atherosclerosis (13, 18, 19). Both genders were used for all other studies. Mice were monitored daily for body weight and signs of ileocolitis including diarrhea and perianal ulceration. Moribund mice (showing loss of 15-20% body weight, or poor health including absence of growth, shivering, prolonged diarrhea or perianal ulceration) were euthanized and analyzed for ileocolitis.
Analysis of atherosclerotic lesions
B6 DKO and WT mice on the Chol+/CA, Chol+, and Chol- diets were analyzed for atherosclerotic lesions after 20 weeks on the diet. The heart and the aorta were processed as previously described (20). The aortic arch and partial heart were fixed in formalin (10%, several hours), and stored in 30% sucrose containing 0.1% sodium azide. Serial frozen sections (10 μm) were made from the left ventricular outflow tract through the aortic sinus, with a cryostat (Leica Microsystems, Wetzlar, Germany) after embedding tissues in OCT (Sakura Finetek USA, Inc., Torrance, CA). Every other section was collected and stained with Oil Red O (Sigma, St Louis, MO) counterstained with hematoxylin; atherosclerotic lesions were quantified utilizing a light microscope (Nikon Eclipse E400, 400X) containing an eyepiece grid. The lesion size from all (~20) sections was summed for each mouse.
Detection of steatosis and inflammation of the liver
Formalin-fixed liver sections were stained with hematoxylin and eosin (H&E) and evaluated for steatosis and steatohepatitis following the classification described by Brunt et al. (21). The severity of steatosis was graded 0-3 based on the percentage of hepatocytes affected: grade 0 (none), grade 1 (up to 33%), grade 2 (33-66%), and grade 3 (>66%). Steatohepatitis includes steatosis, fibrosis (Masson's trichrome staining), as well as lobular and portal inflammation. Liver fibrosis was scored as follows: stage 1 (zone 3 perivenular, perisinusoidal or pericellular fibrosis), stage 2 (additional focal or extensive periportal fibrosis), stage 3 (focal or extensive bridging fibrosis), and stage 4 (cirrhosis). Zone 3 is the most distal zone of the functional unit of the liver, i.e. hepatic acinus. Lobular and portal inflammation was scored at 200x magnification on a scale of 0-3 as follows: 0 (no inflammation foci), 1 (1 inflammatory focus per field), 2 (2-3 inflammatory foci per field) and 3 (>4 inflammatory foci per field).
Analysis of ileocolitis in the ileum and the colon
Pathology and inflammation were scored in a blinded fashion for mice on diets for 7 or 20 weeks. We used a 14-point system as previously described (7), which included: lymphocyte and neutrophil infiltration (0-3 points), ileal Paneth cell or colonic goblet cell degranulation (0-2 points), epithelium reactivity (such as crypt distortion, 0-3 points), inflammatory foci (0-3 points), and apoptotic figures (0-3 points).
Plasma cholesterol, lipopolysaccharide (LPS), tumor necrosis factor (TNF)-α and interleukin (IL)-6 levels
Blood was collected by cardiac puncture, heparinized and centrifuged (3,000 × g for 5 min) to recover the plasma fraction. Cholesterol was assayed utilizing a Cholesterol Assay Kit (Cayman Chemical, Ann Arbor, MI) to detect fluorescent resorufin. LPS was assayed with a ToxinSensor Chromogenic LAL Endotoxin Assay kit (GenScript, Piscataway, NJ) with lower detection limit of 0.005 EU. Mouse TNFα and IL-6 levels were measured with two types of AlphaLISA kit (PerkinElmer, Waltham, MA) with lower detection limit of 1.2 pg/ml and 3 pg/ml, respectively. Each sample was assayed in duplicate or triplicate.
Quantitative real-time PCR to detect expression of genes involved in ER stress and inflammation
Total RNA was isolated from mouse colon using the RNeasy kit (Qiagen, Valencia, CA). Quantitative real-time PCR (RT qPCR) was performed using Eva qPCR SuperMix kit detected with SYBR Green (BioChain Institute, Inc. Hayward, CA) using IQ5 (BioRad, Hercules, CA) instrument. The ratio of spliced Xbp1 (Xbp1s) and unspliced Xbp1 (Xbp1u) was used to determine ER stress. The primer set for the Xbp1s are forward primer 5’-GGTCTGCTGAGTCCGCAGCAGG-3’ and reverse primer 5’-AGGCTTGGTGTATACATGG-3’ (22). For Xbp1u (NM_013842.2), the forward primer is 5’-GGTCTGCTGAGTCCGCAGCACTC-3’ paired with the same reverse primer. For Atf6 (NM_1081304), the forward primer is 5’- AGCATACAGCCTGCGCCCAC-3’ and the reverse primer is 5’- CACCGGGCTGCTCACCACAG-3’. For Grp78/Bip (NM_022310.3), the forward primer is 5’-TGCAGCAGGACATCAAGTTC-3’ and the reverse primer is 5”- TACGCCTCAGCAGTCTCCTT-3’. The CHOP gene (encoding the C/EBP homologous protein-10, also known as GADD153) is another ER stress responsive gene (23). For CHOP (NM_007837), the forward primer is 5’-CACCACACCTGAAAGCAGAA-3’, and the reverse primer is 5’-CGTTTCCTGGGGATGAGATA-3’. Serum amyloid A (SAA) proteins are markers for inflammation, and SAA3 is expressed in mouse colon epithelial cells (24). The primer set for SAA3 are 5’-TGCCATCATTCTTTGCATCTTGA-3’ and 5’-CCGTGAACTTCTGAACAGCCT-3’ (24). The mRNA levels were normalized against β-actin, which was amplified with forward 5’-GCTCCTCCTGAGCGCAAGT-3’ and reverse 5’-TCATCGTACTCCTGCTTGCTGAT-3’ primers.
Fecal sample collection and analysis of fecal deoxycholic acid (DCA) levels by gas chromatography-mass spectrometry (GC/MS)
Fecal samples were collected from mice on different diets at week 2-3, 7, or 20, and freeze-dried and stored at -20°C. Fecal DCA levels were quantified using a procedure modified from Kasbo et al. (25). Fecal samples (0.2 g) were homogenized using a polytron in cold distilled water (1 ml), incubated (1 h, 37°C) and centrifuged (2,900 × g, 10 min). Bile acids were then extracted from the pellet following incubation (1h, 80°C) with ethanol (5 ml) containing NaOH (0.4 ml of 10 mM) and 5β-cholanic acid (100 μg, internal standard; Sigma, St. Louis, MO). Samples were then centrifuged (2,900 × g, 10 min), and the supernatant dried under vacuum. The residue was resuspended in water (1 ml) and then passed through a Bond-elute C18 cartridge for solid-phase extraction. Prior to sample loading, the C18 cartridge was reconditioned with successive elution (2 ml each) of chloroform-methanol 2:1 (v/v), methanol, and HPLC-grade water. After loading, the column was washed with HPCL-grade water and n-hexane (2 ml) and left for 10 min to remove excess solvents. Methanol (5 ml) was used to elute DCA, and the internal standard and the final eluent was dried under vacuum.
For GC/MS analysis, DCA and the internal standard were derivatized by methylation and silylation to increase their volatility. Samples were first methylated in HCl-methanol (Sigma, 400 μl of 1.25 M, 2 h, room temperature), vacuum dried, then silylated with N,O-bis (trimethylsilyl) trifluoroacetamide (BSTFA, Sigma, 330 μl, 55°C, 20 min), and centrifuged (18,400 × g, 2 min). The clear solution was then diluted with acetonitrile for GC/MS analysis.
A GC/MS (GC17A-QP5000, Shimadzu, Kyoto, Japan) connected to a capillary column (DB-5, 30 m; 0.25 mm; 0.25 μm) was used for DCA analysis. Samples (3 μl) were injected in split mode (275°C) and the oven temperature was then raised from 100°C to 300°C (2 min at 100°C; 30°C/min; 15 min at 300°C). The mass spectrometric detector employed the selected ion-monitoring mode (SIM). The selected ions were DCA (m/z 355, 370) and 5β-cholanic acid (m/z 217, 374). Data were quantified by using Lab Solutions software (GCMS Solution, version 1.20, Shimadzu, Kyoto, Japan).
Statistical analysis
The plasma cholesterol, LPS, TNF-α and IL-6 levels and colon Atf6, Grp78/Bip, CHOP, Xbp1U, ratio of Xbp1s to Xbp1U and SAA3 mRNA levels are presented in mean ± standard error of the mean (SEM). Kaplan-Meier curves were applied to each group of mice defining an event as the time when a mouse was determined to be moribund. The Chi-Square test was used to analyze mouse morbidity/mortality rates. For time-to-event endpoints, we used the log-rank test for comparing survival among diet groups. Student t-tests were used to compare plasma cholesterol, LPS, TNF-α and IL-6 levels, colon RNA levels and fecal deoxycholate levels. Pairwise Mann-Whitney U-tests were used to evaluate the difference of atherosclerotic lesion and scores of intestinal inflammation. P < 0.05 is considered statistically significant. Statistical analyses were executed either on Microsoft Excel, SPSS 12.0 or JMP 7.0 software.
Results
Chol+/CA diet was detrimental to B6 DKO mice
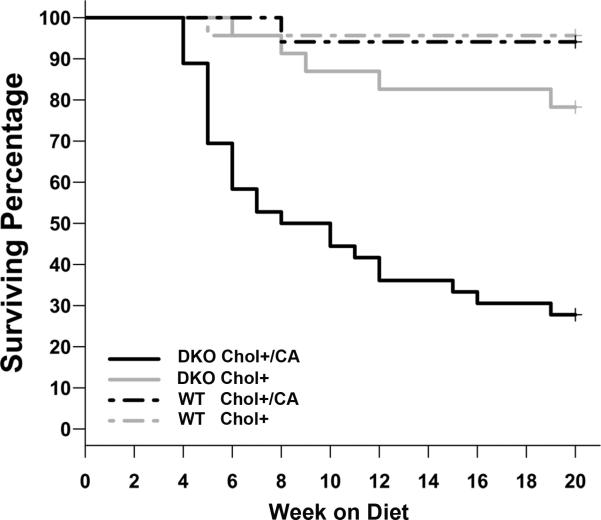
The Chol+/CA diet has been widely used to study atherosclerosis in B6 mice because of its reproducibility with little mortality (13, 26). Unexpectedly, the Chol+/CA diet caused significantly higher morbidity in the DKO mice than WT mice on the same diet. Twenty-six of 36 (72%) DKO mice on the Chol+/CA diet did not survive 20 weeks on this diet, with 2/3 of deaths occurring during the first 3-7 weeks (Figure 1). When on the Chol+ diet (without cholate), 5 of 23 (22%) DKO mice did not survive 20 weeks. In contrast, only one of 23 WT mice on the Chol+/CA diet, and one of 17 WT mice on the Chol+ diet died prematurely. Moribund mice had diarrhea, empty stomachs, and hypoglycemia resulting from cessation of ingestion. All of the 19 DKO mice on the Chol- control diet survived 20 weeks on the diet (data not shown).
Figure 1.
Kaplan-Meier plot of mice on the Chol+/CA and Chol+ diets to show DKO mice on the Chol+/CA diet have high morbidity. Data are expressed as the percentage of survival. Moribund mice were euthanized and counted as dead. The number of mice studied in each group is: 36 DKO and 26 WT mice on the Chol+/CA diet, as well as 23 DKO and 17 WT mice on the Chol+ diet. Comparison of survival after 20 weeks showed DKO mice were highly sensitive to the Chol+/CA diet compared to other groups (P<0.05).
GPx1/2-DKO mice did not have more atherosclerotic lesions than WT mice on the atherogenic diets
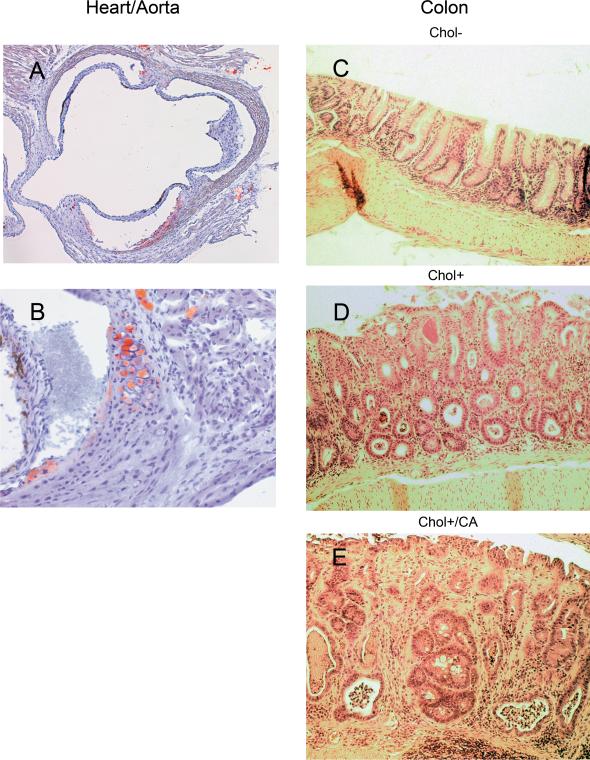
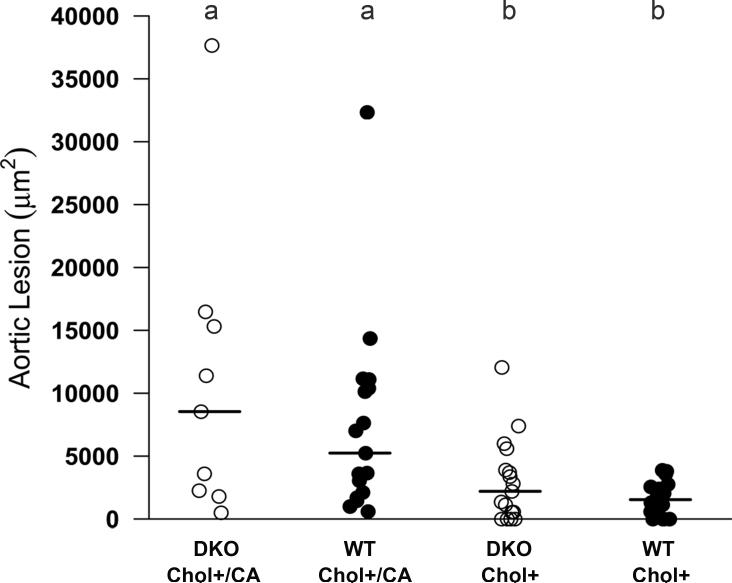
We have compared the lesion size in the heart-aorta sinus region of DKO and WT mice after 20 weeks on the Chol+ and Chol+/CA atherogenic diets (Figure 2 panels A and B, and Figure 3). Although all DKO and WT mice on the Chol+/CA diet and most of DKO and WT mice on the Chol+ diet had detectable lipid deposition in the aorta, there was no significant size difference between DKO and WT mice on the same diet (Figure 3). As expected, the Chol+/CA diet induced significantly larger lesions than the Chol+ diet. None of the 19 DKO mice on the Chol- control diet for 20 weeks had detectable aortic lesions (data not shown). Hence, we did not study the aortic lesions in the WT mice on the Chol- diet.
Figure 2. Histopathology of aortic lesions and colitis.
Panel A (40X) and B (100X) show fat-laden atherosclerotic lesions stained with Oil Red O from a DKO mouse fed a Chol+/CA diet. Panels C-E (100X) show colon histology of DKO mice on Chol-, Chol+, and Chol+/CA diets. H&E stained histology showing the characteristic pathology from each group.
Figure 3. Comparison of the size of aortic lesions (μm2) in DKO and WT mice on Chol+/CA and Chol+ diets.
Aortic lesions were analyzed in DKO and WT mice after 20 weeks on the Chol+/CA or Chol+ diets. Each symbol represents one mouse: 9 DKO and 17 WT mice on the Chol+/CA diet, 17 DKO and 16 WT mice on the Chol+ diet. The horizontal bars represent means from each group: the Chol+/CA DKO and WT groups had larger lesions, when the Chol+ DKO and WT groups had low levels of lesions. Means that differ are shown as a>b, P<0.05.
DKO mice did not have worse steatohepatitis than WT mice on the same diets
The atherogenic Chol+/CA diet is known to produce hepatic steatosis and steatohepatitis (27, 28). Both WT and DKO mice on the Chol+/CA diet and Chol+ diet for up to 20 weeks had pale livers (steatosis), and mice on the Chol+/CA diet had significantly higher steatosis, inflammation, and fibrosis (positive with Masson trichrome stain) than mice on the Chol- diet (data not shown). However, there was no significant difference in the extent of any of the liver pathology between DKO and WT mice on the Chol+/CA diet. The worst fibrosis observed was at stage 2, which is not life-threatening. On the Chol+ diet, the DKO mice had significantly lower level of liver pathology (steatosis, inflammation, and fibrosis) than the WT mice on the same diet (P<0.05). No liver pathology was observed in mice on the Chol- diet.
DKO mice had exacerbated colitis, but not ileitis, induced by Chol+ and Chol+/CA diets
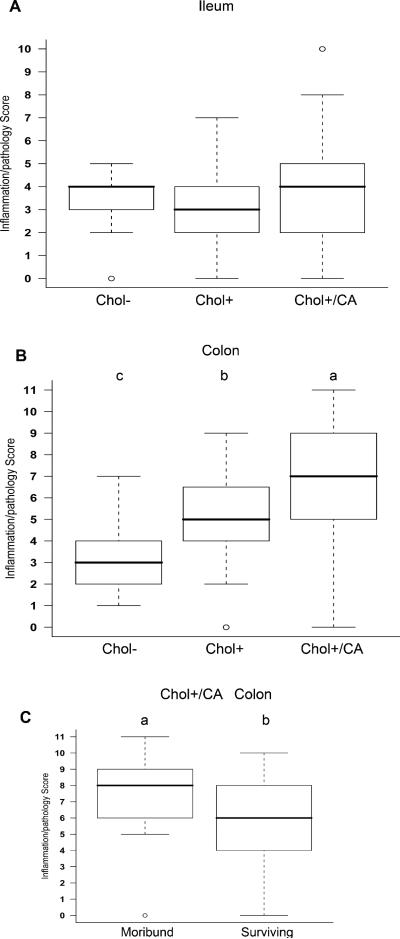
We compared intestinal pathology and inflammation among B6 DKO mice terminated after 20 weeks on the three defined diets, i.e. Chol+/CA, the Chol+ and Chol- diets. The diet did not alter ileitis in the DKO mice, but impacted colitis dramatically (Figure 2 panels C-E, and Figure 4). The Chol+/CA diet produced the most severe colitis, and Chol+ diet produced moderate colitis, which was worse than Chol-diet in the DKO mice. Furthermore, the moribund mice on the Chol+/CA diet had even higher pathology scores than the surviving DKO mice on the same diet (Figure 4B and 4C). None of these diets caused ileitis or colitis in the WT mice (with scores of 0-1 in both the ileum and the colon).
Figure 4. Box-and-whisker plots of ileal and colonic pathology/inflammation scores of DKO mice on atherogenic and control diets.
Inflammation scores are from DKO mice on Chol-, Chol+, and Chol+/CA diets when they became moribund or until termination of experiment. The box shows the lower quartile, median (the horizontal line in the box), and upper quartile; and the whiskers show the minimum and maximum of all the data. The circle indicates an extreme value. For ileum (Panel A) and colon (Panel B), inflammatory scores were determined from 10 mice on Chol- diet, 20 mice on Chol+ diet, and 45 mice on Chol+/CA diet. Panel C compares the colon scores in DKO mice on the Chol+/CA diet between moribund group (n=25) and those surviving (n=20) 7-20 weeks on the diet. Means that differ are shown as a>b>c, P<0.05.
Atherogenic diets increased plasma cholesterol, lipopolysaccharide (LPS) and TNF-α levels in DKO mice
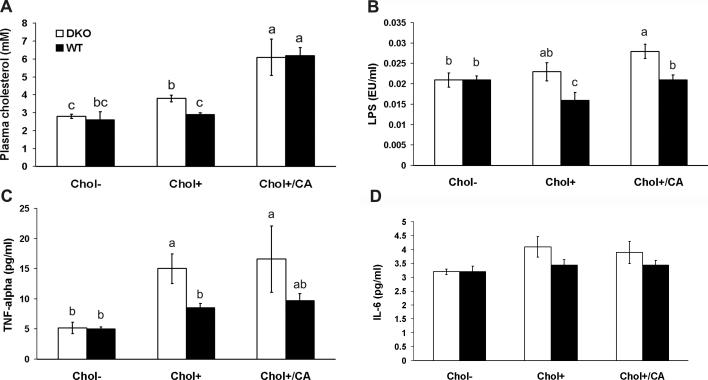
Atherogenic diets are known to increase plasma cholesterol levels, which cause atherosclerosis. Similar to others’ reports, the atherogenic Chol+/CA diet increased plasma cholesterol levels by 2.2-fold in mice on the Chol- diet (Figure 5, Panel A)(9, 13). Although WT mice on the Chol+ diet did not increase significantly the plasma cholesterol levels, DKO mice had significantly increased (1.4 fold) plasma cholesterol level on this Chol+ diet.
Figure 5. The effect of diet on plasma cholesterol, LPS, TNF-α and IL-6 levels of DKO and WT mice.
Panel A shows the total cholesterol levels measured from DKO and WT mice on Chol-, Chol+, or Chol+/CA diets for 7 and 20 weeks. The error bars represent standard error of the mean (SEM). Each group has 4-15 mice. The means that differ between different groups are shown as a>b>c, P<0.05. The group labeled bc is not statistically different from groups labeled with b and c. Panel B shows the LPS levels measured from DKO and WT mice on three diets for 7 and 20 weeks. The error bars are SEM from groups of 4-12 mice. The alphabet ranks the order of the mean of each group where a>b, and P<0.05. The group labeled ab is not different from the groups ranked either a or b. Panel C and D show TNF-α and IL-6 levels, respectively, measured from mice on three diets for 7 weeks. The error bars are SEM from groups of 3-7 mice. The alphabet ranks the order of the mean of each group where a>b, and P<0.05. The group labeled ab is not different from the groups labeled a or b.
Gut epithelial barrier dysfunction allows leakage of luminal antigens into the subepithelial tissues. To determine whether diet altered gut epithelial permeability, we measured plasma LPS levels using Limulus amebocyte lysate (Figure 5, Panel B). DKO mice on the Chol+/CA diet significantly elevated (1.3 fold) LPS level compared to all other groups.
TNF-α is a proinflammatory cytokine in IBD and its expression level is induced by high-fat diet in ApoE-null mouse plasma and DSS-treated WT mouse colon (4, 6). DKO mice on both Chol+ and Chol+/CA diets increased plasma TNF-α level 2.9- and 3.5-fold respectively compared with DKO mice on the Chol- diet (Figure 5, Panel C). However, IL-6, another proinflammatory cytokine, level was not elevated (Figure 5, Panel D).
Atherogenic diet altered gene expression in unfolded protein response and inflammation pathways in mouse colon
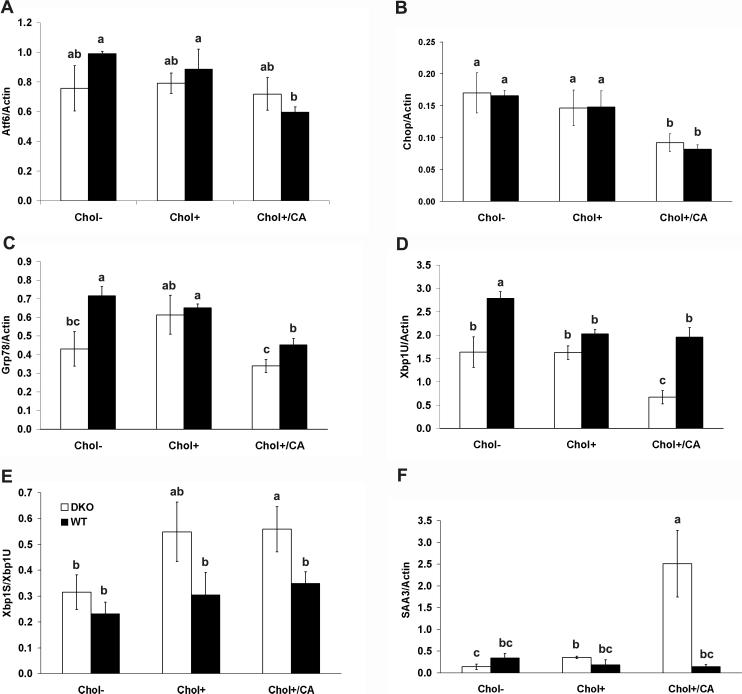
Cholesterol feeding affects transmembrane transcription factor, SREBP gene expression (14, 15). We studied the dietary effect on Atf6, another transmembrane transcription factor, gene expression and expression of Xbp1u, Chop, Grp78/Bip genes, which are regulated by Atf6 (29). The Chol+/CA diet significantly decreased the mRNA levels of Atf6 in the WT mice and its responding genes, Xbpu, Chop and Grp78/Bip, in both WT and DKO mice (Figure 6, Panels A-D).
Figure 6. Dietary effect on the expression of genes in unfolded-protein and inflammatory responses in the colon of DKO and WT mice.
Panels A-D show mRNA levels of Atf6, Chop, Grp78/Bip and unspliced Xbp1U, respectively, and normalized with β-actin mRNA level. Panel E shows the ratio of spliced to unspliced Xbp1. Panel F shows the level of SAA3 mRNA levels normalized with β-actin. Mice were on Chol-, Chol+, or Chol+/CA diet for 7 weeks. Each group had 4-5 mice. The error bar represents SEM. Means that differ are shown as a>b>c, P<0.05 (one-side t-test). The group designated with ab is not significantly different from the groups designated with a or b, and the group labeled with bc is not different from groups labeled with b or c.
Xbp1U is activated by the RNase activity of IRE1 to produce a functional (spliced) Xbp1S mRNA to be translated efficiently after removing a 26-nucleotide intron. DKO mice on the Chol+/CA diet had increased ratio of Xbp1S to Xbp1U compared to mice on the Chol- control diet and WT mice on the same diet (Figure 6, Panels E). DKO mice on the Chol+ diet also had elevated Xbp1S/Xbp1U ratio compared to mice on the Chol-diet (P=0.06, 1 tail t-test).
Serum amyloid A (SAA) proteins are pro-inflammatory markers, and SAA3 is highly inducible in colon epithelium by luminal microbiota compared to germ-free mice (24). High-fat diet induced SAA3 gene expression in the liver and adipose tissue of humans and mice (30). Whether high-fat diet also induces SAA3 gene in the colon has not been studied. Thus, we tested the effect of atherogenic diets on colonic SAA3 gene expression. The Chol+ and Chol+/CA diets induced SAA3 gene expression 2- and 18-fold respectively compared to DKO mice on the Chol- diet (Figure 6, Panel F). High-fat diets did not induce SAA3 gene expression in the WT colon without inflammation.
DKO and WT mice excreted a similar level of DCA on the same diet
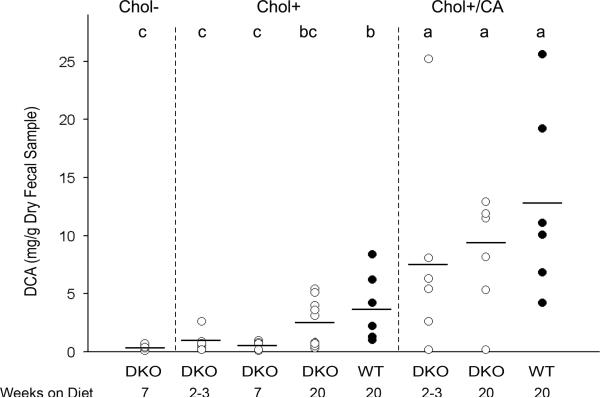
Cholesterol is metabolized into bile acids and excreted into feces. Among the bile acids, deoxycholate (DCA), was implicated to induce colitis in WT B6;129 mice when administered in a normal-fat, cholesterol-free defined diet (31). We analyzed fecal DCA levels by GC/MS to determine whether they were correlated with the extent of colitis. After on the Chol+ and Chol+/CA diets for 2-3 weeks, DKO mice had excreted similar levels of DCA as DKO and WT mice on the same diet for 20 weeks (Figure 7). Similar to mice on conventional LabDiets, DKO mice on the Chol- diet did not excrete DCA (Figure 7 and data not shown). We also analyzed WT fecal DCA levels after on the Chol+ and Chol+/CA diets for 20 weeks and did not find significant difference from levels present in DKO mice.
Figure 7. Fecal DCA levels from DKO and WT mice on Chol-, Chol+, and Chol+/CA diets for 2 to 20 weeks.
Circles represent individual mice (n=6-13 mice per group), and the horizontal line shows the mean for the group. Means that differ are shown as a>b>c, P<0.05. The group labeled bc is not different from those labeled either b or c. Mice on the Chol+/CA diet excreted the highest levels of DCA, 12.8±8.1 mg/g and 8.3±4.9 mg/g, respectively from WT and DKO for 20 weeks. These are not statistically different from DKO mice on the Chol+/CA diet for 2-3 weeks (7.8±4.9 mg/g). Mice on the Chol+ diet for 20 weeks had elevated DCA excretion, 3.9±3.0 mg/g and 2.0±1.9 mg/g, respectively from WT and DKO mice. DKO mice on the Chol+ diet for 2-3 and 7 weeks had similarly low DCA levels, 0.9±0.8 mg/g and 0.6±0.4 mg/g, respectively. Finally, DKO mice on the Chol- diet for 7 weeks has a similarly low DCA level (0.5±0.2 mg/g) as DKO mice on the Chol+ diets for 2-3 and 7 weeks, but significantly lower than DKO mice on the Chol+ diet for 20 weeks.
Discussion
Diet has a profound effect on IBD. High-fat diet has been linked to the increased risk for IBD incidence and severity (3, 32). High-fat-diet-induced obese mice have increased proinflammatory cytokine expression in the colon (33). Although obesity is considered a risk factor for developing IBD, there is scarce evidence to make a direct link between high-fat diet and full-blown colitis (4, 34). Here we provide a causative link between atherogenic diets and aggravated colitis in a spontaneous mouse IBD model.
We fed GPx1/2-DKO and WT mice with cholesterol-containing atherogenic diets to study the protective effect of GPx enzymes against atherosclerosis and ileocolitis. Two groups have shown GPx1 significantly prevents aortic lesions in ApoE-KO mice (10, 11). We were surprised at the lethal effect of Chol+/CA diet on the DKO mice, since WT mice had tolerated this diet for at least one year (35). It was unlikely that they died of cardiovascular disease as the worst aortic lesions in mice on the Chol+/CA diet were relatively mild (stage 2 disease) (19). It was also unlikely that they died of liver disease since both DKO and WT had similar liver pathology (data not shown). Since B6 DKO mice have very mild colitis (while with more evident ileitis) when on regular LabDiets, we compared the dietary effect on ileocolitis. The atherogenic Chol+ and Chol+/CA diets exacerbated colitis, but not ileitis, in the DKO mice. Additionally, moribund DKO mice had significantly worse colitis than the DKO mice, which survived 20 weeks of Chol+/CA diet, suggesting colitis leads to morbidity. The moribund mice often have empty stomach, hypoglycemia, diarrhea and wasting. These observations suggest that they probably die of lack of nutrient intake to sustain their metabolic needs. We have previously reported 40% morbidity associated with a high incidence of ileocolitis in the DKO mice on a mixed B6,129 genetic background when on a standard commercial chow (36). Thus, we conclude that the severe colitis leads to morbidity in the DKO mice. Furthermore, the Chol+/CA diet has been shown to cause lethal typhlocolitis in cyclooxygenase-2 (Cox2) deficient mice within 3 weeks on the diet (37). This suggests that the atherogenic-diet promoted colitis does not depend exclusively on the GPx activity.
We have analyzed a few inflammatory markers in the DKO mice to substantiate our standard pathology-based analysis. We found LPS and TNF-α, but not IL-6 levels were significantly elevated in the DKO mice on the Chol+/CA diet. High dose LPS (≥10 ng/ml) induced SAA3 gene expression in macrophage and colon epithelial cells to display monocytes chemotactic activity (24). We found 18-fold increase of SAA3 gene expression in DKO mouse colon corresponding to a slightly elevated LPS (~3 pg/ml) in the plasma when on the Chol+/CA diet. We might have underestimated plasma LPS levels, since SAA can also bind LPS to neutralize its activity. Elevated LPS levels are likely due to breakdown of the gut barrier, which occurs during inflammation. LPS treatment (0.2-2 mg/kg, i.p.) increased many plasma inflammatory cytokines including TNF-α and IL-6 in a temporal fashion (5). Although liver secretes these cytokines, intestine also responds to LPS by producing these cytokines (38). Since we are studying chronic exposure of a low dose LPS, we suspect IL-6 is primarily an acute phase cytokine and TNF-α is a cytokine of both acute and chronic respondent.
Dietary cholesterol can change expression and activation of SREBP genes in the liver and intestine (14, 15). ATF6 is another transmembrane transcription factor, which shares a similar mechanism for its activation via S1P and S2P cleavage (16). ATF6 is activated by tunicamycin, thapsigargin or dithiothreitol, which are commonly used to induce ER stress to study unfolded protein response (UPR) (16). Upon translocation of ATF6 to the nucleus, ATF6 activates transcription of a chaperone protein GRP78 (a.k.a. BiP), the CCAAT/enhance-binding protein homologous protein (CHOP), and XBP1 (17) (Figure 8). Similar to liver SREBP-2 gene expression, which is inhibited by high cholesterol diet (14), the colon ATF6, CHOP, Grp78/Bip, and XBP1 mRNA levels were mostly decreased in DKO or WT mice on the Chol+/CA diet compared to mice on the Chol- diet. This result suggests that atherogenic diets have weakened UPR in mouse colon. When inflammation occurs, the colon would have ER stress, which is manifested as increased ratio of Xbp1S to Xbp1U.
Figure 8. Unfolded protein response (UPR) and the role of GPx in prevention of inflammation.
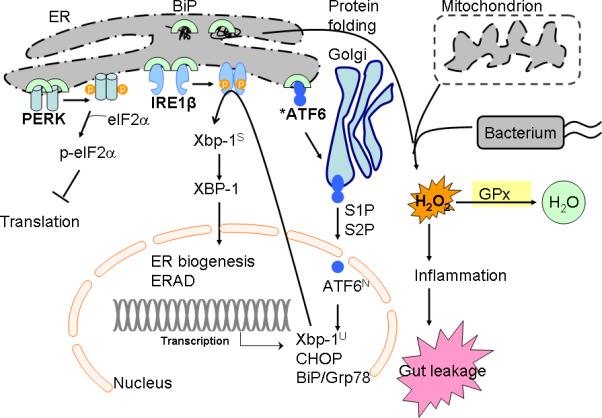
UPR is regulated by three distinct pathways sensed by three transmembrane proteins, protein-kinase-RNA-like ER kinase (PERK), inositol-required enzyme (IRE)-1, and activating transcription factor 6 (ATF6) (17, 29). PERK activation will phosphorylate to inhibit eukaryotic translation initiation factor 2α (eIF2α), thus to inhibit ER protein influx. IRE1β, which is expressed specifically in intestinal epithelium, initiates unconventional splicing of the mRNA of X-box-binding protein 1 (XBP1) to produce the highly active basic leucine zipper (bZIP) family transcription factor (42). XBP1 regulates a subset of UPR genes that promote ER-associated degradation (ERAD) of misfolded proteins and ER biogenesis (42). ATF6, another bZIP transcription factor, is synthesized as an inactive precursor, tethered to the ER membrane by a transmembrane segment. Upon sensing ER stress, ATF6 is transported from the ER to the Golgi apparatus, where it is cleaved by site-1 protease (S1P) and site-2 protease (S2P) to release the N-terminal ATF6N (containing DNA-binding domain) into nucleus. ATF6 regulates gene expression of XBP1, BiP and CHOP (42, 54). High-cholesterol diet inhibits sterol regulator element-binding protein (SREBP)-2 gene expression, which is another bZIP activated by S1P and S2P (14). We have studied whether high-cholesterol also affected ATF6 gene expression (shown by an asterisk mark). Glutathione peroxidase (GPx) reduced H2O2 generated from protein folding, mitochondrial oxidation phosphorylation, and bacterial infection (41). GPx prevents bacterial-associated inflammatory response in the colon.
Down regulation of expression of genes regulating UPR is a risk factor for IBD (17, 39, 40). UPR transfers intracellular signal from the ER stress (accumulation of unfolded proteins) to the nucleus. ER stress can lead to acute production of reactive oxygen species, increase signals for programmed cell death and induce expression of proinflammatory genes (41-43). ATF6 is one of the three distinct transmembrane sensors for ER stress to initiate UPR (29). Hypomorphic S1P mutation, which is required for ATF6 activation, sensitizes mice to DSS-induced colitis (17). IRE1β (inositol-requiring enzyme 1β), another transmembrane sensor present in gut epithelium, is activated by ER stress to autophosphorylate and unmask its endonuclease activity (39, 44). IRE1 catalyzes XBP1U to XBP1S, an active transcription factor (29). Either Ire1β-deficient or Xbp1-deficient mice are also sensitized to DSS-induced colitis (39, 40). Additionally, Xbp1-KO mice have spontaneous enteritis (40). In human IBD, hypomorphic variants of XBP1 are identified as susceptibility factors (40). Since GPx1/2-DKO have spontaneous ileocolitis, it is possible that GPx1 variants at the 3p21 locus also influence susceptibility ad phenotype in patients with IBD (45).
The atherogenic diets worsen colitis but not ileitis in the DKO mice. Although unexpected, we have noted that the severity and onset time of ileitis and colitis in DKO mice varies depending on the genetic background and microflora content, but independent to each other (7, 46, 47). The different response may be due to changes in the numbers and composition of microflora in these two regions of the gut as well as host of immunological, biochemical, functional and structural differences. The colon has three-order-magnitude higher number of bacteria than the ileum, which has higher concentrations of conjugated bile acids secreted from the liver that suppress bacterial growth (48). The mouse colon also has much higher levels of toll-like receptors than the ileum, which might serve to exaggerate responses to breaches of the colon mucosa barrier (49). The ileum and colon typically harbor a different microbiota, which are environmentally malleable (50). Diet can also alter the composition of gut microbiota from changes in host lipid metabolism (51, 52). A high-fat diet had lowered Bifidobacterium species in the cecum and increased endotoxaemia in mice (51). We suspect that the atherogenic diets have altered gut microflora composition in these mice. Although high cholesterol diets also increased DCA excretion, since the extent of colitis does not correlate with the DCA levels, this result does not support the role of DCA in colitis as implicated by others (31, 53).
In summary, we have provided evidence illustrating the anti-inflammatory activity of two cytosolic glutathione peroxidases in mice. Atherogenic diet-induced hypercholesterolemia has weakened unfolded protein response in the colon by down regulation of expression of Atf6 and its regulated genes. The atherogenic diets aggravate inflammatory responses to break down gut barrier in the DKO mice. Thus, we conclude that atherogenic diets have a detrimental effect on the spontaneous colitis.
Acknowledgements
We thank Dr. Jake Lusis at UCLA for technical guidance on analysis of atherosclerosis, Sofia Loera and Tina Montgomery of the Anatomic Pathology Core for tissue processing; Dr. Richard Yip from the Biocore core for IL-6 and TNF-α assays; Dr. Xiaoqing Han and Jun Xie from the Synthetic Chemistry Core, Bixin Xi from the Analytical Pharmacology Core for GC/MS analysis and for their excellent technical support. No competing financial interests exist for all authors. Sources of Support: NIH R01CA114569 (FFC).
Sources of Support: NIH R01CA114569 (FFC).
References
- 1.Ferguson LR, Shelling AN, Browning BL, et al. Genes, diet and inflammatory bowel disease. Mutat Res. 2007;622:70–83. doi: 10.1016/j.mrfmmm.2007.05.011. [DOI] [PubMed] [Google Scholar]
- 2.O'Sullivan M, O'Morain C. Nutrition in inflammatory bowel disease. Best practice & research. 2006;20:561–573. doi: 10.1016/j.bpg.2006.03.001. [DOI] [PubMed] [Google Scholar]
- 3.Reif S, Klein I, Lubin F, et al. Pre-illness dietary factors in inflammatory bowel disease. Gut. 1997;40:754–760. doi: 10.1136/gut.40.6.754. [DOI] [PMC free article] [PubMed] [Google Scholar]
- 4.Ma X, Torbenson M, Hamad AR, et al. High-fat diet modulates non-CD1d-restricted natural killer T cells and regulatory T cells in mouse colon and exacerbates experimental colitis. Clin Exp Immunol. 2008;151:130–138. doi: 10.1111/j.1365-2249.2007.03530.x. [DOI] [PMC free article] [PubMed] [Google Scholar]
- 5.Huang H, Liu T, Rose JL, et al. Sensitivity of mice to lipopolysaccharide is increased by a high saturated fat and cholesterol diet. Journal of inflammation (London, England) 2007;4:22. doi: 10.1186/1476-9255-4-22. [DOI] [PMC free article] [PubMed] [Google Scholar]
- 6.Naura AS, Hans CP, Zerfaoui M, et al. High-fat diet induces lung remodeling in ApoE-deficient mice: an association with an increase in circulatory and lung inflammatory factors. Lab Invest. 2009;89:1243–1251. doi: 10.1038/labinvest.2009.98. [DOI] [PMC free article] [PubMed] [Google Scholar]
- 7.Chu FF, Esworthy RS, Chu PG, et al. Bacteria-induced intestinal cancer in mice with disrupted Gpx1 and Gpx2 genes. Cancer Res. 2004;64:962–968. doi: 10.1158/0008-5472.can-03-2272. [DOI] [PubMed] [Google Scholar]
- 8.Lee DH, Esworthy RS, Chu C, et al. Mutation accumulation in the intestine and colon of mice deficient in two intracellular glutathione peroxidases. Cancer Res. 2006;66:9845–9851. doi: 10.1158/0008-5472.CAN-06-0732. [DOI] [PubMed] [Google Scholar]
- 9.Getz GS, Reardon CA. Diet and murine atherosclerosis. Arterioscler Thromb Vasc Biol. 2006;26:242–249. doi: 10.1161/01.ATV.0000201071.49029.17. [DOI] [PubMed] [Google Scholar]
- 10.Lewis P, Stefanovic N, Pete J, et al. Lack of the antioxidant enzyme glutathione peroxidase-1 accelerates atherosclerosis in diabetic apolipoprotein E-deficient mice. Circulation. 2007;115:2178–2187. doi: 10.1161/CIRCULATIONAHA.106.664250. [DOI] [PubMed] [Google Scholar]
- 11.Torzewski M, Ochsenhirt V, Kleschyov AL, et al. Deficiency of glutathione peroxidase-1 accelerates the progression of atherosclerosis in apolipoprotein E-deficient mice. Arterioscler Thromb Vasc Biol. 2007;27:850–857. doi: 10.1161/01.ATV.0000258809.47285.07. [DOI] [PubMed] [Google Scholar]
- 12.Esworthy RS, Mann JR, Sam M, et al. Low glutathione peroxidase activity in Gpx1 knockout mice protects jejunum crypts from gamma-irradiation damage. Am J Physiol Gastrointest Liver Physiol. 2000;279:G426–G436. doi: 10.1152/ajpgi.2000.279.2.G426. [DOI] [PubMed] [Google Scholar]
- 13.de Haan JB, Witting PK, Stefanovic N, et al. Lack of the antioxidant glutathione peroxidase-1 does not increase atherosclerosis in C57BL/J6 mice fed a high-fat diet. J Lipid Res. 2006;47:1157–1167. doi: 10.1194/jlr.M500377-JLR200. [DOI] [PubMed] [Google Scholar]
- 14.Shimomura I, Bashmakov Y, Shimano H, et al. Cholesterol feeding reduces nuclear forms of sterol regulatory element binding proteins in hamster liver. Proc Natl Acad Sci U S A. 1997;94:12354–12359. doi: 10.1073/pnas.94.23.12354. [DOI] [PMC free article] [PubMed] [Google Scholar]
- 15.Field FJ, Born E, Murthy S, et al. Regulation of sterol regulatory element-binding proteins in hamster intestine by changes in cholesterol flux. J Biol Chem. 2001;276:17576–17583. doi: 10.1074/jbc.M010917200. [DOI] [PubMed] [Google Scholar]
- 16.Bailey D, O'Hare P. Transmembrane bZIP transcription factors in ER stress signaling and the unfolded protein response. Antioxid Redox Signal. 2007;9:2305–2321. doi: 10.1089/ars.2007.1796. [DOI] [PubMed] [Google Scholar]
- 17.Brandl K, Rutschmann S, Li X, et al. Enhanced sensitivity to DSS colitis caused by a hypomorphic Mbtps1 mutation disrupting the ATF6-driven unfolded protein response. Proc Natl Acad Sci U S A. 2009;106:3300–3305. doi: 10.1073/pnas.0813036106. [DOI] [PMC free article] [PubMed] [Google Scholar]
- 18.Friedman G, Ben-Yehuda A, Dabach Y, et al. Macrophage cholesterol metabolism, apolipoprotein E, and scavenger receptor AI/II mRNA in atherosclerosis-susceptible and -resistant mice. Arterioscler Thromb Vasc Biol. 2000;20:2459–2464. doi: 10.1161/01.atv.20.11.2459. [DOI] [PubMed] [Google Scholar]
- 19.Whitman SC. A Practical Approach to Using Mice in Atherosclerosis Research. Clin Biochem Rev. 2004;25:81–93. [PMC free article] [PubMed] [Google Scholar]
- 20.Paigen B, Morrow A, Holmes PA, et al. Quantitative assessment of atherosclerotic lesions in mice. Atherosclerosis. 1987;68:231–240. doi: 10.1016/0021-9150(87)90202-4. [DOI] [PubMed] [Google Scholar]
- 21.Brunt EM, Janney CG, Di Bisceglie AM, et al. Nonalcoholic steatohepatitis: a proposal for grading and staging the histological lesions. American Journal of Gastroenterology. 1999;94:2467–2474. doi: 10.1111/j.1572-0241.1999.01377.x. [see comment] [DOI] [PubMed] [Google Scholar]
- 22.Ozcan E, Garibyan L, Lee JJ, et al. Transmembrane activator, calcium modulator, and cyclophilin ligand interactor drives plasma cell differentiation in LPS-activated B cells. The Journal of allergy and clinical immunology. 2009;123:1277–1286. e1275. doi: 10.1016/j.jaci.2009.03.019. [DOI] [PMC free article] [PubMed] [Google Scholar]
- 23.Zinszner H, Kuroda M, Wang X, et al. CHOP is implicated in programmed cell death in response to impaired function of the endoplasmic reticulum. Genes Dev. 1998;12:982–995. doi: 10.1101/gad.12.7.982. [DOI] [PMC free article] [PubMed] [Google Scholar]
- 24.Reigstad CS, Lunden GO, Felin J, et al. Regulation of serum amyloid A3 (SAA3) in mouse colonic epithelium and adipose tissue by the intestinal microbiota. PloS one. 2009;4:e5842. doi: 10.1371/journal.pone.0005842. [DOI] [PMC free article] [PubMed] [Google Scholar]
- 25.Kasbo J, Saleem M, Perwaiz S, et al. Biliary, fecal and plasma deoxycholic acid in rabbit, hamster, guinea pig, and rat: comparative study and implication in colon cancer. Biol Pharm Bull. 2002;25:1381–1384. doi: 10.1248/bpb.25.1381. [DOI] [PubMed] [Google Scholar]
- 26.Vergnes L, Phan J, Strauss M, et al. Cholesterol and cholate components of an atherogenic diet induce distinct stages of hepatic inflammatory gene expression. J Biol Chem. 2003;278:42774–42784. doi: 10.1074/jbc.M306022200. [DOI] [PubMed] [Google Scholar]
- 27.Figge A, Lammert F, Paigen B, et al. Hepatic overexpression of murine Abcb11 increases hepatobiliary lipid secretion and reduces hepatic steatosis. Journal of Biological Chemistry. 2004;279:2790–2799. doi: 10.1074/jbc.M307363200. [DOI] [PubMed] [Google Scholar]
- 28.Goel R, Boylan B, Gruman L, et al. The proinflammatory phenotype of PECAM-1-deficient mice results in atherogenic diet-induced steatohepatitis. American Journal of Physiology - Gastrointestinal & Liver Physiology. 2007;293:G1205–1214. doi: 10.1152/ajpgi.00157.2007. [DOI] [PubMed] [Google Scholar]
- 29.Hengstermann A, Muller T. Endoplasmic reticulum stress induced by aqueous extracts of cigarette smoke in 3T3 cells activates the unfolded-protein-response-dependent PERK pathway of cell survival. Free Radic Biol Med. 2008;44:1097–1107. doi: 10.1016/j.freeradbiomed.2007.12.009. [DOI] [PubMed] [Google Scholar]
- 30.Scheja L, Heese B, Zitzer H, et al. Acute-phase serum amyloid A as a marker of insulin resistance in mice. Experimental diabetes research. 2008;2008:230837. doi: 10.1155/2008/230837. [DOI] [PMC free article] [PubMed] [Google Scholar]
- 31.Bernstein H, Holubec H, Bernstein C, et al. Unique dietary-related mouse model of colitis. Inflamm Bowel Dis. 2006;12:278–293. doi: 10.1097/01.MIB.0000209789.14114.63. [DOI] [PubMed] [Google Scholar]
- 32.Geerling BJ, Dagnelie PC, Badart-Smook A, et al. Diet as a risk factor for the development of ulcerative colitis. Am J Gastroenterol. 2000;95:1008–1013. doi: 10.1111/j.1572-0241.2000.01942.x. [DOI] [PubMed] [Google Scholar]
- 33.Li H, Lelliott C, Hakansson P, et al. Intestinal, adipose, and liver inflammation in diet-induced obese mice. Metabolism: clinical and experimental. 2008;57:1704–1710. doi: 10.1016/j.metabol.2008.07.029. [DOI] [PubMed] [Google Scholar]
- 34.Chapman-Kiddell CA, Davies PS, Gillen L, et al. Role of diet in the development of inflammatory bowel disease. Inflamm Bowel Dis. 2009;16:15. doi: 10.1002/ibd.20968. [DOI] [PubMed] [Google Scholar]
- 35.Wang DQ, Lammert F, Cohen DE, et al. Cholic acid aids absorption, biliary secretion, and phase transitions of cholesterol in murine cholelithogenesis. Am J Physiol. 1999;276:G751–760. doi: 10.1152/ajpgi.1999.276.3.G751. [DOI] [PubMed] [Google Scholar]
- 36.Esworthy RS, Aranda R, Martin MG, et al. Mice with combined disruption of Gpx1 and Gpx2 genes have colitis. Am J Physiol Gastrointest Liver Physiol. 2001;281:G848–855. doi: 10.1152/ajpgi.2001.281.3.G848. [DOI] [PubMed] [Google Scholar]
- 37.Lin JA, Watanabe J, Rozengurt N, et al. Atherogenic diet causes lethal ileo-cecocolitis in cyclooxygenase-2 deficient mice. Prostaglandins Other Lipid Mediat. 2007;84:98–107. doi: 10.1016/j.prostaglandins.2007.04.004. [DOI] [PMC free article] [PubMed] [Google Scholar]
- 38.Paradkar PN, Blum PS, Berhow MA, et al. Dietary isoflavones suppress endotoxin-induced inflammatory reaction in liver and intestine. Cancer Lett. 2004;215:21–28. doi: 10.1016/j.canlet.2004.05.019. [DOI] [PubMed] [Google Scholar]
- 39.Bertolotti A, Wang X, Novoa I, et al. Increased sensitivity to dextran sodium sulfate colitis in IRE1beta-deficient mice. J Clin Invest. 2001;107:585–593. doi: 10.1172/JCI11476. [DOI] [PMC free article] [PubMed] [Google Scholar]
- 40.Kaser A, Lee AH, Franke A, et al. XBP1 links ER stress to intestinal inflammation and confers genetic risk for human inflammatory bowel disease. Cell. 2008;134:743–756. doi: 10.1016/j.cell.2008.07.021. [DOI] [PMC free article] [PubMed] [Google Scholar]
- 41.Tu BP, Weissman JS. Oxidative protein folding in eukaryotes: mechanisms and consequences. J Cell Biol. 2004;164:341–346. doi: 10.1083/jcb.200311055. [DOI] [PMC free article] [PubMed] [Google Scholar]
- 42.Ron D, Walter P. Signal integration in the endoplasmic reticulum unfolded protein response. Nature reviews. 2007;8:519–529. doi: 10.1038/nrm2199. [DOI] [PubMed] [Google Scholar]
- 43.Ma A. Unresolved ER Stress Inflames the Intestine. Cell. 2008;134:724–725. doi: 10.1016/j.cell.2008.08.023. [DOI] [PubMed] [Google Scholar]
- 44.Iwakoshi NN, Lee AH, Vallabhajosyula P, et al. Plasma cell differentiation and the unfolded protein response intersect at the transcription factor XBP-1. Nat Immunol. 2003;4:321–329. doi: 10.1038/ni907. [DOI] [PubMed] [Google Scholar]
- 45.Latiano A, Palmieri O, Corritore G, et al. Variants at the 3p21 locus influence susceptibility and phenotype both in adults and early-onset patients with inflammatory bowel disease. Inflamm Bowel Dis. 2009 doi: 10.1002/ibd.21176. [DOI] [PubMed] [Google Scholar]
- 46.Esworthy RS, Binder SW, Doroshow JH, et al. Microflora trigger colitis in mice deficient in selenium-dependent glutathione peroxidase and induce Gpx2 gene expression. Biological Chemistry. 2003;384:597–607. doi: 10.1515/BC.2003.067. [DOI] [PubMed] [Google Scholar]
- 47.Esworthy RS, Yang L, Frankel PH, et al. Epithelium-specific glutathione peroxidase, Gpx2, is involved in the prevention of intestinal inflammation in selenium-deficient mice. J Nutr. 2005;135:740–745. doi: 10.1093/jn/135.4.740. [DOI] [PubMed] [Google Scholar]
- 48.Jones BV, Begley M, Hill C, et al. Functional and comparative metagenomic analysis of bile salt hydrolase activity in the human gut microbiome. Proc Natl Acad Sci U S A. 2008;105:13580–13585. doi: 10.1073/pnas.0804437105. [DOI] [PMC free article] [PubMed] [Google Scholar]
- 49.Ortega-Cava CF, Ishihara S, Rumi MA, et al. Strategic compartmentalization of Toll-like receptor 4 in the mouse gut. J Immunol. 2003;170:3977–3985. doi: 10.4049/jimmunol.170.8.3977. [DOI] [PubMed] [Google Scholar]
- 50.Davis CP, Cleven D, Balish E, et al. Bacterial association in the gastrointestinal tract of beagle dogs. Appl Environ Microbiol. 1977;34:194–206. doi: 10.1128/aem.34.2.194-206.1977. [DOI] [PMC free article] [PubMed] [Google Scholar]
- 51.Cani PD, Neyrinck AM, Fava F, et al. Selective increases of bifidobacteria in gut microflora improve high-fat-diet-induced diabetes in mice through a mechanism associated with endotoxaemia. Diabetologia. 2007;50:2374–2383. doi: 10.1007/s00125-007-0791-0. [DOI] [PubMed] [Google Scholar]
- 52.Martinez I, Wallace G, Zhang C, et al. Diet-induced metabolic improvements in a hamster model of hypercholesterolemia are strongly linked to alterations of the gut microbiota. Appl Environ Microbiol. 2009;75:4175–4184. doi: 10.1128/AEM.00380-09. [DOI] [PMC free article] [PubMed] [Google Scholar]
- 53.Bernstein H, Holubec H, Bernstein C, et al. Deoxycholate-induced colitis is markedly attenuated in Nos2 knockout mice in association with modulation of gene expression profiles. Dig Dis Sci. 2007;52:628–642. doi: 10.1007/s10620-006-9608-0. [DOI] [PubMed] [Google Scholar]
- 54.Adachi Y, Yamamoto K, Okada T, et al. ATF6 is a transcription factor specializing in the regulation of quality control proteins in the endoplasmic reticulum. Cell structure and function. 2008;33:75–89. doi: 10.1247/csf.07044. [DOI] [PubMed] [Google Scholar]


