

Abstract
Obesity is associated with increased risk of diabetes, cardiovascular disease and several types of cancers. The hypothalamus is a region of the brain critical in the regulation of body weight. One of the critical and best studied hypothalamic circuits is comprised of the melanocortinergic orexigenic agouti -related protein (AgRP) and anorexigenic α-melanocyte stimulating hormone (α-MSH) neurons. These neurons project axons to the same hypothalamic target neurons and balance each other’s activity leading to body weight regulation. We previously showed that the brain proteoglycan syndecan-3 regulates feeding behavior and body weight, and syndecan-3 null (SDC-3−/−) mice are lean and obesity resistant. Here we show that the melanocortin agonist MTII potently suppresses food intake and activates the hypothalamic paraventricular nuclei (PVN) in SDC-3−/− mice based on c-fos immunoreactivity. Interestingly, we determined that the AgRP neuropeptide is reduced in the PVN of SDC-3−/− mice compared to wild type mice. In contrast, neuropeptide Y, coexpressed in the AgRP neuron, is not differentially expressed nor is the counteracting neuropeptide αMSH. These findings are unprecedented and indicate that AgRP protein localization can be selectively regulated within the hypothalamus resulting in altered neuropeptide response and tone.
Keywords: obesity, syndecan-3, MTII, α-melanocyte stimulating hormone, Agouti-related protein
1. Introduction
The obesity epidemic is associated with multiple untoward health consequences including diabetes, heart disease, and cancer leading to decreased lifespan (Baskin et al., 2005; Haslam and James, 2005; Ogden et al., 2006). In contrast, caloric restriction and maintenance of a lean body weight is correlated with reduced metabolic diseases and incidence of cancer (Cohen et al., 2004; Couzin, 2004; Finkel, 2003). Body weight is tightly regulated by integration of multiple signals, such as leptin, the adipose tissue secreted hormone that conveys to the hypothalamus the relative amount of the body’s adiposity (Abizaid et al., 2006; Elmquist et al., 1999; Friedman, 1999; Myers et al., 2005; Spiegelman and Flier, 2001). Leptin receptors expressed on anorexigenic (Proopiomelanocortin, POMC) and orexigenic (Agouti related protein, AgRP) neurons in the arcuate nucleus receive and process the leptin signal leading to regulation of feeding behavior and energy expenditure. The AgRP and POMC neurons project axons to the same target nuclei within the hypothalamus including to the paraventricular (PVN), dorsomedial (DMN), and lateral hypothalamic area (LHA). In the paraventricular nucleus, these neurons make synaptic contacts with melanocortin-4 receptor expressing neurons and balance each other’s activity leading to food intake regulation. Activation of the melanocortin-4 receptor by the POMC derived peptide α–MSH leads to inhibition of food intake, whereas antagonism of the receptor by AgRP leads to stimulation of food intake.
Syndecans are type I transmembrane proteins found at the cell surface of adherent cells (Bernfield et al., 1999; Park et al., 2000; Reizes et al., 2007). In the brain, syndecans are implicated in neuronal migration, axonal guidance and synaptic plasticity (Hienola et al., 2006; Kaksonen et al., 2002; Steigemann et al., 2004) by modulating ligand-receptor interactions at the cell surface. Our previous studies identified syndecan-3 as a regulator of feeding behavior and body weight by modulating the activity of the melanocortin antagonist AgRP (Reizes et al., 2001). We showed that syndecan-3 null mice (SDC-3−/−) are hypophagic, lean, and resistant to diet-induced obesity (Strader et al., 2004). Syndecan-3 binds to AgRP in vitro and potentiated its activity at the melanocortin receptor (Reizes et al., 2001). Additionally, syndecan-3 null mice exhibited reduced reflex hyperphagia following food deprivation and suppression of agouti (lethal yellow) induced obesity (Reizes & Benoit, unpublished observation). Collectively, the data support the hypothesis that the feeding effect of α–MSH is more potent in SDC-3−/− mice.
Using pharmacological approaches coupled with immunofluorescent localization, we tested whether deletion of the syndecan-3 gene leads to changes in functional response to the hypothalamic melanocortinergic neuropeptides. We now show that SDC-3−/− mice are hypersensitive to α-MSH and exhibit increased activation of melanocortin neurons. More importantly, we determined that within the PVN, the AgRP protein is selectively reduced in SDC-3−/− mice. In contrast, NPY, coexpressed in AgRP neurons and the opposing neuropeptide α-MSH were expressed at similar levels in the PVN of WT and SDC-3−/− mice. Our studies provide compelling evidence that the body weight circuits regulated by the AgRP neuropeptide can be selectively altered by syndecan-3 leading to differential sensitivity to orexigenic and anorexigenic ligands.
2. Experimental Procedures
2.1 Experiment 1: Activation of hypothalamic paraventricular nuclei in response to the melanocortin agonist MTII in SDC-3−/− and WT mice
2.1.1 Effect of MTII on feeding behavior in SDC-3−/− and WT mice
MTII was dissolved in saline solution (0.9% NaCl) and 8–12 week old male mice (4–5/goup) were injected intraperitoneally with 1, 3 or 4 mg/kg MTII or saline and 2 hour intake measured. Mice were then food deprived for 24 hours, injected with 3 mg/kg MTII, and food intake measured at 1, 2, 4, and 24 hours. Performing this analysis in food-deprived mice is critical for the subsequent studies assessing neuronal activation by MTII.
2.1.2 Effect of MTII on C-Fos like immunoreactivity in the hypothalamus of SDC-3−/− and WT mice
8–12 week old mice were housed individually and were food deprived for 24 h prior to injection. MTII was dissolved in saline solution (0.9% NaCl) and mice were injected intraperitoneally with 3 mg/kg MTII or saline as indicated. At 0, 2, and 4 h post-injection, mice were anesthetized and transcardially perfused with saline followed by 4% paraformaldeyde (PFA) in 0.1M phosphate-buffered saline (pH 7.4). Following postfixation, brains were then transferred to a 30% sucrose/80 mM sorenson’s buffer (pH 7.6) at 4°C and for 1–2 days until the brains sank to the bottom of the tube. Brains were sectioned (30 μm thick) on a freezing microtome (Leica Microsystems, Bannockburn, IL) and maintained in cryostorage solution (1% PVP-40 (polyvinylpyrolidine), 0.1M PO4 pH7.4, 30% sucrose, 30% ethylene glycol) until staining. Sections were blocked with 3% goat serum and 1% triton X-100 in PBS for 1 h and then incubated with primary antibodies: c-fos antibody at a dilution of 1:200 overnight at 4°C.
For quantification of c-fos like immunoreactivity, all PVN sections were identified under a dissecting microscope and immunostained with c-fos antibody (Cell Signaling). Immunoreactive nuclei in the PVN were identified under a microscope at 5x Magnification (Leica Microsystems) and images were digitized. c-fos positive neurons from each section were counted manually and averaged across each mouse. Data are expressed as mean ± S.D. n = 4–5.
2.2 Experiment 2: Expression and activity of AgRP and NPY in SDC-3−/− mice
2.2.1 RT-PCR analysis of AgRP, NPY, and αMSH in SDC-3−/− and WT mice
The level of AgRP, POMC, NPY and GAPDH mRNA in hypothalamus of fed and fasted mice were determined using iCycler IQ multicolor real time PCR from Bio-Rad. Mice were euthanized and the brains removed. The hypothalamus was excised as defined superiorly by the apex of the hypothalamic third ventricle, rostrally by the optic chiasm, caudally by the mammillary bodies, and laterally by the optic tract. Total RNA from hypothalamus was isolated using TRI reagent (Ambion, Austin, TX). RNA concentration was determined using NanoDrop 1000 Spectrophotometer (Thermo, Wilmington, DE) and stored at −80°C until use. Reverse transcriptase (RT) reactions were prepared using a high capacity cDNA reverse transcription kit (Applied Biosystems, Foster City, CA). 1 mg of total RNA was used as template for first strand cDNA. Quantitative PCR was performed using mouse specific primer probe sets (GAPDH, 4352339E, AgRP, Mm00475829_g1; NPY, Mm00445771_m1; POMC, Mm00435874-ml) purchased from Applied Biosystems (Foster City, CA). After RT-PCR, the threshold value (CT) readings were recorded and the results were analyzed using the delta delta CT method (Peirson et al., 2003; Pfaffl, 2001).
2.2.2. Effect of AgRP and NPY on feeding behavior in intracerebroventricle injected SDC-3−/− and WT mice
Mice were anesthetized by intraperitoneal injection of avertin (0.2 ml/g). Scalp fur was shaved and prepared using sterile techniques and the mice were then placed into a stereotaxic device (Kopf Instruments, Tajunga, CA) with lambda and bregma at the same vertical coordinate. A small midline incision was made over the dorsal scalp to provide access to the cranium and the cranial surface was cleaned by swabbing with hydrogen peroxide and allowed to dry. Coordinates for cannula placement were 0.825 mm posterior to bregma and on the midline. A small skull window was outlined with a fine dremel bit and removed with forceps; the sagittal sinus was displaced laterally prior to lowering a 26-gauge stainless steel cannula (Plastics One, Roanoke, VA) such that the cannula tip was 4.8 mm below bregma as described by Cepoi et al. (Cepoi 2004). Dental acrylic was used to secure the cannula to the skull.
Cannula placement was verified after the mice had regained their presurgical weight (3 or 4 days) as described by Bowen et al. when ascertaining success of cannulation of the lateral ventricles in mice (Bowen 2003). Food was removed for 2 hr in the middle of the light phase, and at the end of that interval the mice were administered i3vt NPY (5 μg/1 μl). Mice that ate more than 0.5 g in the subsequent 2 hr were included in the study. Successful cannula placement was found in at least 80–90 % of the mice.
On experimental days, mice had their food removed 4 hr prior to the onset of the dark and were immediately given an i3vt injection of AgRP 83–132 (1 nmole in 1 μl), NPY (7.5 μg in 1 μl) or saline (1 μl). NPY and AgRP were purchase from Phoenix Peptides. Injections were infused over 30 seconds. Following the infusion, the guide cannula was kept in place for an additional 30 seconds to allow the drugs to diffuse away from the cannula tip. The mice were returned to their cages and food was returned. Intake was recorded after 2, 4 and 24 hr. Body weight was recorded at the time of injection and 24 hr after food was returned. All mice received every treatment individually counterbalanced design, subsequent injections occurring one week apart to allow recovery of body weight.
2.3 Experiment 3: Reduced AgRP neuropeptide in the hypothalamic paraventricular nucleus of SDC-3−/− mice
2.3.1. Immunofluorescence analysis of AgRP, NPY, and α-MSH in the hypothalamus of SDC-3−/− and WT mice
8–12 week old mice were euthanized at the same time of day, at the beginning of the dark cycle. Brains were processed in an identical manner to the c-fos studies (2.1.2). We empirically determined the thickness of the sections needed for the specific antibodies during optimization prior to performing any experiments. 50 μm sections were optimal for the immunofluorescence analysis for AgRP, α-MSH, and NPY. Sections containing the PVN, ARC, and DMN were co-immunostained for AgRP and α-MSH and digital images were collected on an epifluorescence microscope. Adjacent sections were immunostained for NPY. α-MSH antibody at a dilution of 1:5000 for 2 days at 4°C; NPY and AgRP antibody at a dilution of 1:2000 for 2 days at 4°C. Sections were washed twice with Tris-buffered saline/0.05% Tween 20 and incubated with alexa fluor goat anti-rabbit 488 or goat anti-guinea pig-568 at a concentration of 1:1000 for 2 h.
The densities of AgRP, NPY, and α-MSH were quantified using Image-Pro Plus 6.0 (Mediacybernetics, Silver Spring, MD). Images of immunoreactive neurons and projections were obtained at 10x magnification and digitized. The regions containing the PVN or arcuate were boxed and fluorescence intensity quantified using the Intensity of Density (IOD) algorithm (Image-Pro Plus 6.0). Immunofluorescent staining was performed on WT and SDC-3−/− brain sections at the same time. Data represent average of densities corrected to the average of WT fluorescent density. Each group contained at least 3 WT and 3 SDC-3−/− mice and each mouse had at least 3–4 sections containing PVN, arcuate or DMN.
2.4. Materials
Melanotan II (MTII) was a generous gift from Procter & Gamble Pharmaceuticals, Inc. (Mason, OH). c-fos antibody was purchased from cell signaling (Danvers, MA), AgRP antibody was provided by Dr. Tamas Horvath, NPY and α-MSH antibody were purchased from Pheonix Pharmaceuticals Inc. (Burlingame, CA). Alexa Fluor secondary antibodies were purchased from Invitrogen (Carlsbad, CA)
2.5. Animals
SDC-3−/− mice were generated using established techniques and described previously (Reizes et al., 2001). SDC-3−/− mice were backcrossed (n > 20) to the C57Bl/6J genetic background and are maintained by interbreeding mating. Mice were housed in standard plastic rodent cages on a 12 h light/dark schedule and unless otherwise noted given ad libitum access to water and chow diet (rodent maintenance diet, 3.4 Kcal/g Harlan-Teklad). All mouse procedures were performed under protocols approved by the Cleveland Clinic Foundation Institutional Animal Care and Use Committee (IACUC).
2.6. Statistical analysis and image preparation
Data are expressed as mean ± s.d. or s.e.m. as indicated in the figure legend. Statistical analysis was performed using a Student’s t test for all studies except for food intake. Food intake was expressed relative to food intake and analyzed using a two way ANOVA with Bonferroni post hoc test. Significance was set at p < 0.05. All microscopic images were prepared by using Adobe Photoshop CS2 adjusted for brightness/contrast, scale bar = 200 μm.
3. Results
3.1. Activation of hypothalamic paraventricular nuclei in response to the melanocortin agonist MTII in SDC-3−/− and WT mice
3.1.1. Effect of MTII on feeding behavior in SDC-3−/− and WT mice
The melanocortin agonist MTII is a non-selective agonist of the melanocortin-1, -3, -4, and -5 receptors (Fung and Hruby, 2005). MTII does not interact with syndecan-3, however peripheral administration of MTII leads to inhibition of food intake in free fed mice and SDC-3−/− male mice are hypersensitive to the anorectic effect of MTII (Reizes et al., 2003). These studies were designed to test the effect of MTII on neuronal activation in the hypothalamus. We first determined that feeding behavior is suppressed in food deprived SDC-3−/− mice compared to wild type (WT) mice, a necessary paradigm for assessing neuronal activation. MTII inhibits food intake (2 hour intake) in food deprived WT mice in a dose-dependent manner with 50% inhibition observed at 4 mg/kg compared to saline (Fig. 1a). Similarly, MTII inhibits food intake (2 hour intake) in food deprived SDC-3−/− mice with greater than 60 and 70% inhibition at 3 and 4 mg/kg, respectively (Fig. 1a). The effect of MTII (3 mg/kg) was assessed over a 24-hour period and WT and SDC-3−/− food intake assessed relative to saline intake. SDC-3−/− mice exhibited greatest food intake inhibition at 2 and 4 hours post- MTII injection compared to WT mice (Fig. 1b). Consistent with our previous findings, SDC-3−/− mice are more sensitive to the anorectic effects of MTII than C57Bl/6J WT mice.
Figure 1.
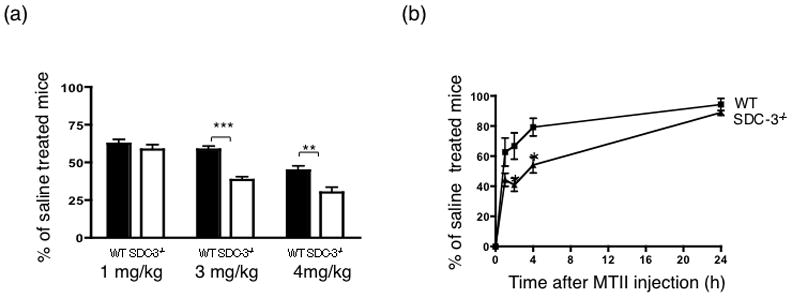
Melanotan II (MTII) induced inhibition of food intake in SDC-3−/− and wild type (WT) male mice after 24 hour food deprivation. A. 1, 3 or 4 mg/kg MTII was i.p. injected in SDC-3−/− and WT mice. Chow was replaced and food intake measured at 2 hours. Food intake is expressed as percentage of saline treated control males (n = 4–5/group). **p≤0.01, *** p ≤ 0.001, SDC-3−/− vs. WT. A two way ANOVA with Bonferroni post hoc test was used to assess significance. B, Time course of MTII (3mg/kg) induced inhibition of food intake. Food intake measured at 1, 2, 4, and 24 hours. *p<0.05, n = 4–5/group. Data expressed as mean ± s.e.m.
3.1.2. Effect of MTII on C-Fos like immunoreactivity in the hypothalamus of syndecan-3 null and WT mice
C-fos, an established marker used to identify activated neurons in the brain (Thiele et al., 1998). We assessed c-fos like immunoreactivity (CFLIR) in SDC-3−/− and WT mice at 2 and 4 hours post-MTII injection. These time points were chosen because the feeding studies indicated the difference between SDC-3−/− and WT mice was greatest during this period (Fig. 1b). 2 hours after MTII injection, CFLIR was detected in both WT and SDC-3−/− male mice in the PVN (Fig. 2a). Samples were quantified by counting all immunopositive cells throughout the PVN from SDC-3−/− and WT mice. At 2 hours, c-fos positive neurons in the PVN were stimulated by MTII in both WT and SDC-3−/−, but were not different between the mice (Fig. 2b). By 4 h, c-fos positive cells were significantly reduced in the PVN of WT mice but remained elevated in SDC-3−/− mice (Fig. 2b). We analyzed CFLIR at 4 hours and corrected for baseline immunoreactivity. Again, we determined that CFLIR was increased in the SDC-3−/− compared to WT mice at 4 hours (Fig. 2c).
Figure 2.
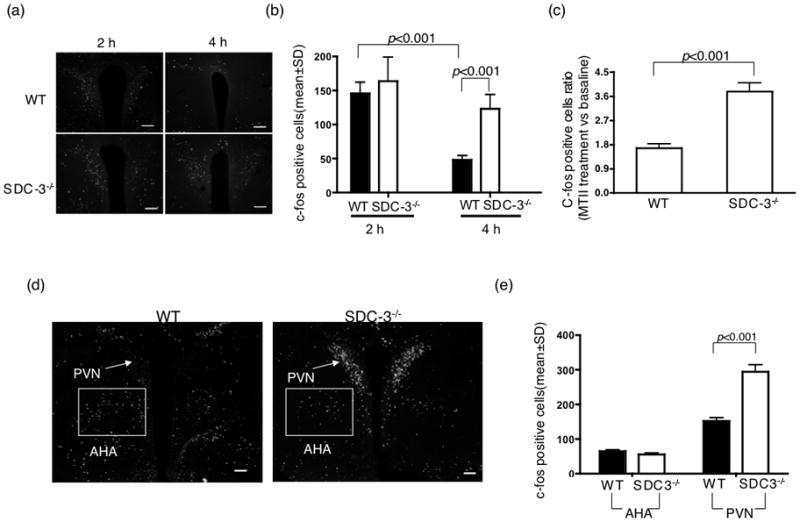
MTII-induced c-fos immunoreactivity in the paraventricular nuclei of SDC-3−/− and WT mice. (a) SDC-3−/− and WT mice were food deprived for 24 h and then injected with 3 mg/kg MTII. Mice were euthanized at 2 or 4 hours and processed as described in the methods (2.1.2). Representative sections from WT and SDC-3−/− mice are shown. (b) c-fos positive neurons were counted from all PVN containing sections. Data represent the mean ± s.d. P values are indicated in figure, SDC-3−/− vs. WT based on Student’s t test. (c) Analysis of c-fos activated neurons compared to baseline. CFLIR was quantified in brain sections obtained at 0 or 4 hrs post-MTII injection. Data are presented as ratio of MTII treated versus baseline and expressed as mean ± s.d. P values are indicated in figure, SDC-3−/− vs. WT based on a Student’s t test. (d) C-fos immunoreactivity in non-MTII activated neurons. 24-hour food deprived mice were injected with MTII (3 mg/kg) and euthanized 4 hours post-injection. (e) Sections containing both the PVN and anterior hypothalamic area (AHA) nuclei were quantified for CFLIR. Data represent the mean ± s.d. n = 3/group. P values are indicated in figure based on Student’s t test.
The difference in CFLIR was not due to a generalized increase in c-fos immunoreactivity in the hypothalamus of SDC-3−/− mice in response to MTII. We quantified the c-fos positive neurons in the anterior hypothalamic region from the PVN containing sections (Fig. 2d and e). The anterior hypothalamic area contains fewer CFLIR neurons, however there was no difference between SDC-3−/− and WT mice.
3.2. Expression and activity of AgRP and NPY in syndecan-3 null mice
3.2.1. RT-PCR analysis of AgRP, NPY, and α-MSH in SDC-3−/− and WT mice
We next sought to determine whether the increase in CFLIR in SDC-3−/− mice was due to increased POMC/α-MSH or alternatively a decrease in AgRP mRNA. SDC-3−/− and WT mice were ad lib fed or food deprived for 24 hours and POMC, AgRP, and NPY mRNA was quantified from the hypothalamus using real time PCR. We determined that fed WT and SDC-3−/− mice express comparable levels of POMC, AgRP, and NPY mRNA (Table 1). Food deprivation led to a 2- 3-fold increase in AgRP mRNA in both WT and SDC-3−/− mice. Similarly, NPY mRNA was also increased by food deprivation however, the mRNA level of NPY in SDC-3−/− did not reach statistical significance (Table 1).
Table 1.
Gene Expression Analysis in Syndecan-3 null and WT mice
| WT | SDC-3−/− | ||
|---|---|---|---|
| AgRP | Fed | 105.6 ± 38.3 | 97.5 ± 35.6 |
| F.D. | 283.5 ± 65.1* | 299.2 ± 45.8** | |
| NPY | Fed | 101.6 ± 20.6 | 130 ± 41.3 |
| F.D. | 206 ± 7.3** | 240.3 ± 115.6 | |
| POMC | Fed | 104.5 ± 34.2 | 107.5 ± 29.1 |
| F.D. | 105.9 ± 12.8 | 68.6 ± 6.5* |
The results were analyzed using the delta delta CT method and the data were represented by fold changes (%) generated for each RNA by calculating 2-ΔΔCT. F.D. - food deprivation.
p<0.01;
p<0.001 fed compared to F.D.
POMC, the precursor transcript for α-MSH, was not significantly decreased in food deprived WT mice, though we did observe a significant reduction in the SDC-3−/− mice. There was approximately 40% reduction in POMC mRNA in the SDC-3−/− mice compared to no change in WT mice. While POMC transcript was significantly decreased in SDC-3−/− mice this cannot explain the enhanced inhibition of food intake (Fig. 1) or the increased CFLIR in the mice (Fig. 2).
3.2.2. Effect of AgRP and NPY on feeding behavior in intracerebroventricle injected SDC-3−/− and WT mice
The increased sensitivity to MTII could be due to decreased sensitivity to AgRP. Therefore, we analyzed whether the C-terminal (non-syndecan-3 binding; (Reizes et al., 2001)) fragment of AgRP is able to induce food intake in SDC-3−/− and WT mice. The AgRP peptide is not able to cross the blood brain barrier, so it was injected directly into the 3rd ventricle via intracerebroventricle cannulas. AgRP induced an equivalent (2-fold) increase in food intake in SDC-3−/− and WT male mice when corrected for saline intake (Fig. 3). Similarly, we analyzed the effect of NPY on food intake in the mice and found a similar increase in food intake in both cohorts (Fig. 3). The data indicate that SDC-3−/− mice are sensitive to AgRP and suggest that the melanocortin receptor is expressed and sensitive to AgRP in the SDC-3−/− mice.
Figure 3.
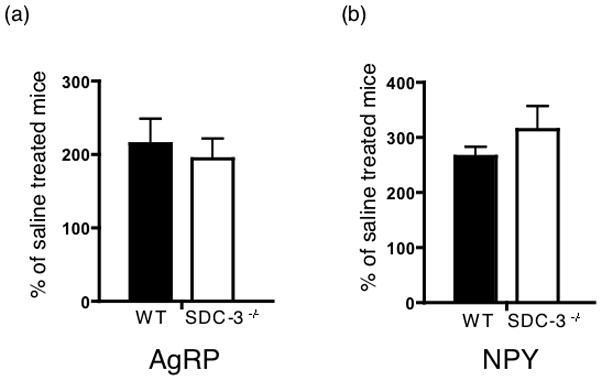
Food intake induced by AgRP and NPY in SDC3−/− and WT mice. Mice were implanted with intracerebroventricular (ICV) catheters and injected with 1.0 nmoles AgRP (a) or 7.5 μg NPY (b) and food intake was measured 4 hours post injection. (n = 5/group, data are mean ± s.e.m.).
3.3. Reduced AgRP neuropeptide in the hypothalamic paraventricular nucleus of SDC-3−/− mice
3.3.1. Immunofluorescence analysis of AgRP, NPY, and αMSH in the hypothalamus of SDC-3−/− and WT mice
To determine whether the increase in α-MSH sensitivity could be due to changes in the neuropeptide protein levels in the target paraventricular nucleus, we analyzed AgRP, NPY, and α-MSH expression by immunofluorescent staining. We focused on the PVN because MTII induced CFLIR in the PVN was significantly different between SDC-3−/− and WT mice.
AgRP and α-MSH immunoreactivity was analyzed in 8–12 week old SDC-3−/− and WT mice (Fig. 4a). Surprisingly, AgRP immunofluorescent density was reduced by approximately 50% in the SDC-3−/− compared to WT male mice (Fig. 4b). In contrast to the differences in AgRP immunofluorescent density, the α-MSH fiber density were similar in both WT and SDC-3−/− mice (Fig. 4c).
Figure 4.
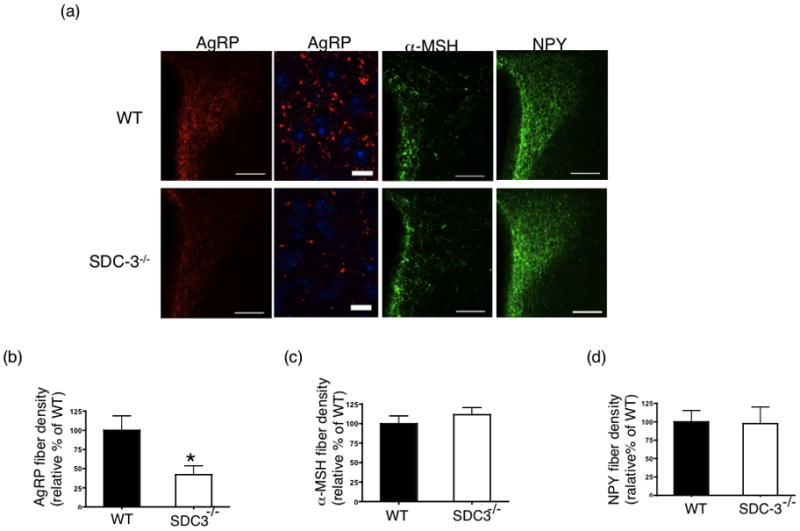
AgRP, NPY, and α-MSH fiber and terminal density in paraventricular nucleus of SDC-3−/− and WT mice. (a) Representative PVN sections from male WT and SDC-3−/− mice immunostained for AgRP (red), NPY (green), and α-MSH (green). Images obtained at 10x magnification (bar = 20 μm). Higher magnification image from AgRP immunostained section (square) was obtained with a confocal microscope using an oil 63X objective. (b) Quantification of AgRP immunoreactivity for male SDC-3−/− and WT mice, respectively. (c) Quantification of α-MSH immunoreactivity for male WT and SDC-3−/− mice, respectively. (d) Quantification of NPY immunoreactivity for male WT and SDC-3−/− mice, respectively. Data represent average of densities corrected to the average of WT density. Each group contained at least 3 WT and 3 SDC-3−/− mice and each mouse had at least 3 sections containing PVN. Data are expressed as mean ± s.e.m. *p<0.05, SDC-3−/− vs. WT based on Student’s t test.
The reduction in AgRP immunofluorescence may be due to a reduction in fibers/terminals in the PVN or reduced amount of the neuropeptide in the PVN. Because neuropeptide Y is colocalized within the same hypothalamic neurons as AgRP, though not necessarily the same vesicles, we immunostained adjacent sections for NPY (Fig. 4a). Unlike AgRP, we determined that NPY density was not different between SDC-3−/− and WT mice (Fig. 4d). This is a critical control because it indicates that the NPY/AgRP fibers emanating from the arcuate are intact but the amount of AgRP neuropeptide appears to be reduced. This is in contrast to the transcript levels that appear the same between SDC-3−/− and WT mice (Table 1).
AgRP and α-MSH efferents within the hypothalamus derive from the arcuate nucleus (Bagnol et al., 1999). Therefore, we co-stained the arcuate nucleus for AgRP and α-MSH immunoreactivity. Both AgRP and α-MSH immunoreactivity was identical in the actuate nucleus of SDC-3−/− and WT mice (Fig 5a). We quantified the immunoreactivity in all sections containing the arcuate nucleus for both AgRP and α-MSH in the mice. In the arcuate, we detected no difference in AgRP density between the WT and SDC-3−/− mice (Fig. 5b). Similarly, α-MSH density was not different between the SDC-3−/− and WT mice (Fig. 5c).
Figure 5.
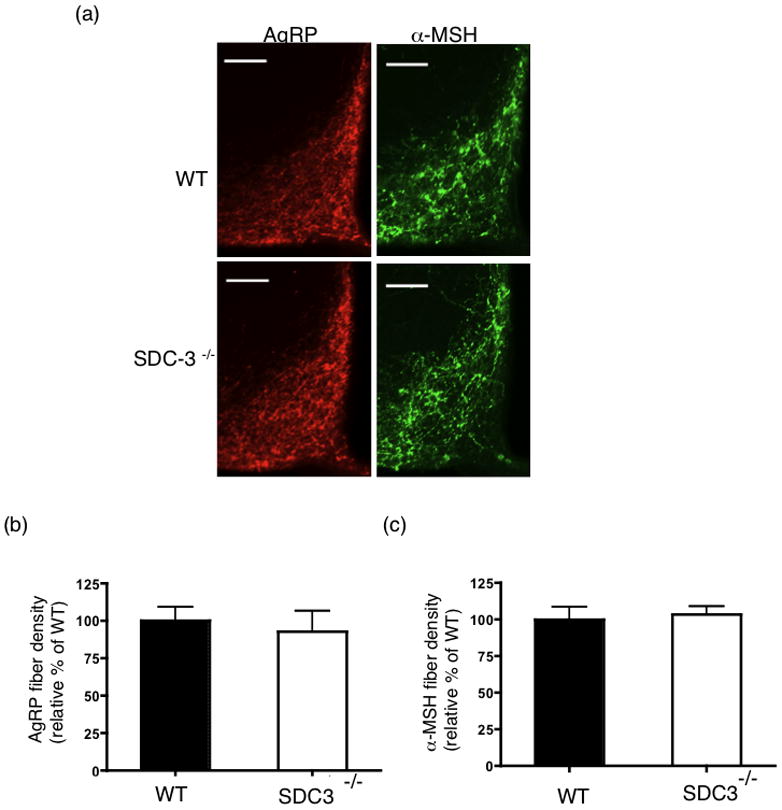
AgRP and α-MSH fiber density analysis in arcuate nuclei of SDC-3−/− and WT mice. (a) Representative ARC sections from WT and SDC-3−/− mice immunostained for AgRP (red) or α-MSH (green). (b) Quantification of AgRP immunoreactivity for male SDC-3−/− and WT mice, respectively. (c) Quantification of α-MSH immunoreactivity for male WT and SDC-3−/− mice, respectively. Each group contained at least 3 WT and 3 SDC-3−/− mice and each mouse had at least 3 sections containing arcuate staining. Data are expressed as mean ± s.e.m.
AgRP, NPY, and α-MSH immunoreactivity was assessed in the dorsomedial nucleus (DMN) of the hypothalamus, a nuclei innervated by all three neuropeptides like the PVN. The DMN was analyzed to determine whether the reduction in AgRP-IR was more global or limited to the PVN. Interestingly, there was not detectable difference in AgRP-IR in the DMN (Fig. 6a) in SDC-3−/− and WT mice. Similarly there was no difference in αMSH and NPY immunoreactivity (Fig. 6a). AgRP, NPY, and α-MSH immunoreacitivity were quantified in DMN sections from SDC-3−/− and WT mice and no significant differences detected (Fig. 6b). The data indicate that AgRP-IR is not reduced throughout the hypothalamus in the SDC-3−/− mice.
Figure 6.
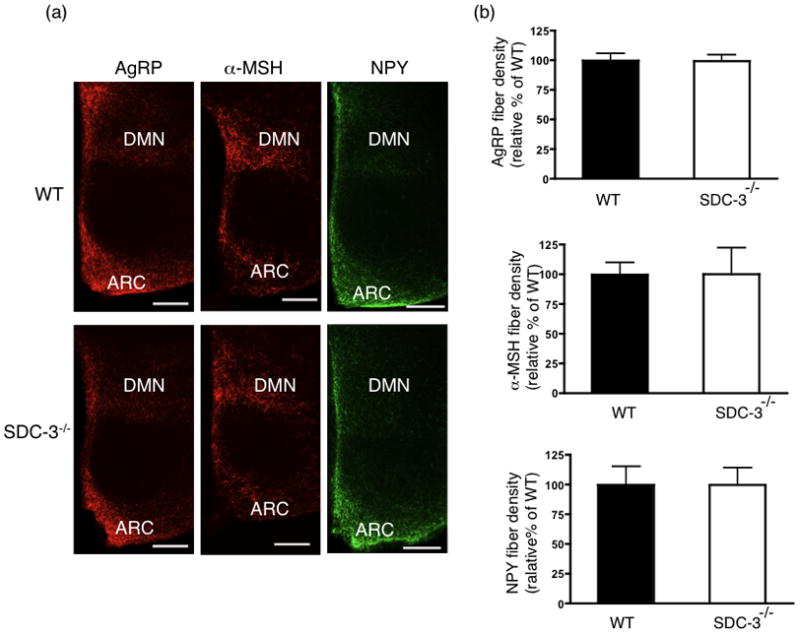
AgRP, NPY and α-MSH fiber in dorsomedial hypothalamic nucleus of SDC-3−/− and WT mice. (a) Representative DMN sections from male WT and SDC-3−/− mice immunostained for AgRP (red), NPY (green), and α-MSH (green). Images obtained at 10x magnification (bar = 20 μm). (b) Quantification of AgRP immunoreactivity for male SDC-3−/− and WT mice, respectively. (c) Quantification of α-MSH immunoreactivity for male WT and SDC-3−/− mice, respectively. (d) Quantification of NPY immunoreactivity for male WT and SDC-3−/− mice, respectively. Each group contained at least 3 WT and 3 SDC-3−/− mice and each mouse had at least 3 sections containing arcuate staining. Data are expressed as mean ± s.e.m.
4. Discussion
SDC-3−/− mice are lean, hypophagic, and resist development of obesity on a high fat diet (Strader et al., 2004). Syndecan-3 is a cell surface proteoglycan and extracellular matrix receptor modulating cell-cell, cell-matrix, and ligand-receptor encounters (Reizes et al., 2007). In the brain, syndecan-3 is expressed at the cell surface and in the neuropil, a synaptic contact region between axons and dendrites (unpublished observations and (Hsueh and Sheng, 1999)). Our previous findings indicated that syndecan-3 potentiates the activity of the melanocortin antagonist AgRP (Reizes et al., 2001). The current finding indicate that melanocortin anorexigenic inputs are poorly opposed by orexigenic AgRP in the paraventricular nucleus, apparently a result of decreased AgRP neuropeptide at the synaptic terminals. As a consequence, we propose that the efficacy of the melanocortin agonist MTII is increased leading to a more pronounced inhibition of food intake in mice lacking the syndecan-3 gene. Indeed, we show that activation of the MTII target neurons in the PVN is greater and more prolonged in these mice. These data are novel and we propose that syndecan-3 regulates AgRP neuropeptide processing and/or maintenance at PVN target neurons.
These data provide important insight to the regulation of feeding by melanocortin neuropeptides. The findings indicate that loss of syndecan-3 protein leads to modulation of AgRP activity in vivo. We propose that SDC-3−/− mice exhibit enhanced sensitivity to the melanocortin agonist MTII across a dose-and time-effect curve due to reduced AgRP immunoreactivity in target neurons. The increased and prolonged neuronal (CFLIR) activation is consistent with the greater inhibition of food intake in SDC-3−/− suggesting α-MSH is unopposed or inefficiently opposed by AgRP in null mice. Importantly, SDC-3−/− mice are sensitive to AgRP because exogenous AgRP injection (Fig. 3) increases food intake to a similar level in both SDC-3−/− and WT mice. This is significant and indicates that melanocortin receptor is fully functional in these mice and it is the AgRP neuropeptide, likely at its specific target in the PVN that is less functional.
These studies reveal a novel role for syndecan-3 in targeting or maintenance of AgRP at its target neurons. Syndecans and HSPGs in simpler organisms are critical regulators of axonal guidance (Johnson et al., 2006; Kantor et al., 2004). It would be reasonable to propose that syndecan-3 may be necessary in the axonal guidance or synaptic contact formation of the AgRP fibers. However, if true, we would anticipate that NPY, the neuropeptide co-expressed with AgRP, would be similarly reduced in the PVN of SDC-3−/− mice. Our findings suggest this is not the case and that the synaptic projections and inputs are intact in the null mice. The decrease in AgRP in the PVN terminals or synapses indicates depletion of the neuropeptide, reduced neuropeptide processing and/or reuptake at the synapse.
For the first time, these studies reveal that loss of an extracellular matrix molecule leads to a differential effect on a neuropeptide at its target neuron. AgRP is reduced in PVN target nuclei (Fig. 4) and not in DMN (Fig. 6). To our knowledge, this is quite unprecedented yet identifies a unique mechanism to regulate body weight. The decreased AgRP immunoreactivity in the PVN suggests that it is post-translationally regulated by syndecan-3 at its target neuron. Importantly, we found no difference in AgRP transcript regulation in the hypothalamus of SDC-3−/− and WT mice (Table 1). The finding that SDC-3−/− mice are lean and hypophagic coupled with the reduced AgRP at the PVN suggests a unique mechanism for body weight regulation by targeting the processing or stability of the AgRP neuropeptide.
We propose that syndecan-3 regulates AgRP and acts to concentrate AgRP at the post-synaptic membrane of target nuclei. Indeed, we proposed this mechanism in our first studies identifying the unique role for syndecan-3 in feeding behavior (Reizes et al., 2001). The current findings provide in vivo evidence that AgRP localization at its target nuclei in the paraventricular nucleus is reduced. This change in AgRP has significant consequences resulting in mice that are lean and significantly resistant to high fat diet induced obesity (Strader et al., 2004). Improved understanding of these mechanisms may provide critical insights to the regulation of body weight and offer novel therapeutic approaches for reducing obesity.
Acknowledgments
We would like to thank Judy Drazba and John Peterson of the Cleveland Clinic Imaging Core for assistance in image acquisition and digital analysis. This work was funded by the Cleveland Clinic Foundation and a development project grant from U54 CA116867 (O.R.), and the NIH; grants DK074386, DK080000 (T.L.H.) and DK064885 (S.C.B.).
Footnotes
Disclosure statement. The authors have no conflicts of interest to report. All mouse procedures were performed under protocols approved by Institutional Animal Care and Use Committee (IACUC) at the Cleveland Clinic Foundation or the University of Cincinnati.
Publisher's Disclaimer: This is a PDF file of an unedited manuscript that has been accepted for publication. As a service to our customers we are providing this early version of the manuscript. The manuscript will undergo copyediting, typesetting, and review of the resulting proof before it is published in its final citable form. Please note that during the production process errors may be discovered which could affect the content, and all legal disclaimers that apply to the journal pertain.
References
- Abizaid A, Gao Q, Horvath TL. Thoughts for food: brain mechanisms and peripheral energy balance. Neuron. 2006;51:691–702. doi: 10.1016/j.neuron.2006.08.025. [DOI] [PubMed] [Google Scholar]
- Bagnol D, Lu XY, Kaelin CB, Day HE, Ollmann M, Gantz I, Akil H, Barsh GS, Watson SJ. Anatomy of an endogenous antagonist: relationship between Agouti-related protein and proopiomelanocortin in brain. J Neurosci. 1999;19:RC26. doi: 10.1523/JNEUROSCI.19-18-j0004.1999. [DOI] [PMC free article] [PubMed] [Google Scholar]
- Baskin ML, Ard J, Franklin F, Allison DB. Prevalence of obesity in the United States. Obes Rev. 2005;6:5–7. doi: 10.1111/j.1467-789X.2005.00165.x. [DOI] [PubMed] [Google Scholar]
- Bernfield M, Gotte M, Park PW, Reizes O, Fitzgerald ML, Lincecum J, Zako M. Functions of cell surface heparan sulfate proteoglycans. Annu Rev Biochem. 1999;68:729–777. doi: 10.1146/annurev.biochem.68.1.729. [DOI] [PubMed] [Google Scholar]
- Cohen HY, Miller C, Bitterman KJ, Wall NR, Hekking B, Kessler B, Howitz KT, Gorospe M, de Cabo R, Sinclair DA. Calorie restriction promotes mammalian cell survival by inducing the SIRT1 deacetylase. Science. 2004;305:390–392. doi: 10.1126/science.1099196. [DOI] [PubMed] [Google Scholar]
- Couzin J. Research on aging. Gene links calorie deprivation and long life in rodents. Science. 2004;304:1731. doi: 10.1126/science.304.5678.1731a. [DOI] [PubMed] [Google Scholar]
- Elmquist JK, Elias CF, Saper CB. From lesions to leptin: hypothalamic control of food intake and body weight. Neuron. 1999;22:221–232. doi: 10.1016/s0896-6273(00)81084-3. [DOI] [PubMed] [Google Scholar]
- Finkel T. Ageing: a toast to long life. Nature. 2003;425:132–133. doi: 10.1038/425132a. [DOI] [PubMed] [Google Scholar]
- Friedman JM. Leptin and the regulation of body weight. Harvey Lect. 1999;95:107–136. [PubMed] [Google Scholar]
- Fung S, Hruby VJ. Design of cyclic and other templates for potent and selective peptide alpha-MSH analogues. Curr Opin Chem Biol. 2005;9:352–358. doi: 10.1016/j.cbpa.2005.06.010. [DOI] [PMC free article] [PubMed] [Google Scholar]
- Haslam DW, James WP. Obesity. Lancet. 2005;366:1197–1209. doi: 10.1016/S0140-6736(05)67483-1. [DOI] [PubMed] [Google Scholar]
- Hienola A, Tumova S, Kulesskiy E, Rauvala H. N-syndecan deficiency impairs neural migration in brain. J Cell Biol. 2006;174:569–580. doi: 10.1083/jcb.200602043. [DOI] [PMC free article] [PubMed] [Google Scholar]
- Hsueh YP, Sheng M. Regulated expression and subcellular localization of syndecan heparan sulfate proteoglycans and the syndecan-binding protein CASK/LIN-2 during rat brain development. J Neurosci. 1999;19:7415–7425. doi: 10.1523/JNEUROSCI.19-17-07415.1999. [DOI] [PMC free article] [PubMed] [Google Scholar]
- Johnson KG, Tenney AP, Ghose A, Duckworth AM, Higashi ME, Parfitt K, Marcu O, Heslip TR, Marsh JL, Schwarz TL, et al. The HSPGs Syndecan and Dallylike bind the receptor phosphatase LAR and exert distinct effects on synaptic development. Neuron. 2006;49:517–531. doi: 10.1016/j.neuron.2006.01.026. [DOI] [PubMed] [Google Scholar]
- Kaksonen M, Pavlov I, Voikar V, Lauri SE, Hienola A, Riekki R, Lakso M, Taira T, Rauvala H. Syndecan-3-deficient mice exhibit enhanced LTP and impaired hippocampus-dependent memory. Mol Cell Neurosci. 2002;21:158–172. doi: 10.1006/mcne.2002.1167. [DOI] [PubMed] [Google Scholar]
- Kantor DB, Chivatakarn O, Peer KL, Oster SF, Inatani M, Hansen MJ, Flanagan JG, Yamaguchi Y, Sretavan DW, Giger RJ, et al. Semaphorin 5A is a bifunctional axon guidance cue regulated by heparan and chondroitin sulfate proteoglycans. Neuron. 2004;44:961–975. doi: 10.1016/j.neuron.2004.12.002. [DOI] [PubMed] [Google Scholar]
- Myers MG, Jr, Patti ME, Leshan RL. Hitting the target: leptin and perinatal nutrition in the predisposition to obesity. Endocrinology. 2005;146:4209–4210. doi: 10.1210/en.2005-0971. [DOI] [PubMed] [Google Scholar]
- Ogden CL, Carroll MD, Curtin LR, McDowell MA, Tabak CJ, Flegal KM. Prevalence of overweight and obesity in the United States, 1999–2004. Jama. 2006;295:1549–1555. doi: 10.1001/jama.295.13.1549. [DOI] [PubMed] [Google Scholar]
- Park PW, Reizes O, Bernfield M. Cell surface heparan sulfate proteoglycans: selective regulators of ligand-receptor encounters. J Biol Chem. 2000;275:29923–29926. doi: 10.1074/jbc.R000008200. [DOI] [PubMed] [Google Scholar]
- Peirson SN, Butler JN, Foster RG. Experimental validation of novel and conventional approaches to quantitative real-time PCR data analysis. Nucleic Acids Res. 2003;31:e73. doi: 10.1093/nar/gng073. [DOI] [PMC free article] [PubMed] [Google Scholar]
- Pfaffl MW. A new mathematical model for relative quantification in real-time RT-PCR. Nucleic Acids Res. 2001;29:e45. doi: 10.1093/nar/29.9.e45. [DOI] [PMC free article] [PubMed] [Google Scholar]
- Reizes O, Benoit SC, Clegg DJ. The role of syndecans in the regulation of body weight and synaptic plasticity. Int J Biochem Cell Biol. 2007 doi: 10.1016/j.biocel.2007.06.011. [DOI] [PubMed] [Google Scholar]
- Reizes O, Benoit SC, Strader AD, Clegg DJ, Akunuru S, Seeley RJ. Syndecan-3 modulates food intake by interacting with the melanocortin/AgRP pathway. Ann N Y Acad Sci. 2003;994:66–73. doi: 10.1111/j.1749-6632.2003.tb03163.x. [DOI] [PubMed] [Google Scholar]
- Reizes O, Lincecum J, Wang Z, Goldberger O, Huang L, Kaksonen M, Ahima R, Hinkes MT, Barsh GS, Rauvala H, et al. Transgenic expression of syndecan-1 uncovers a physiological control of feeding behavior by syndecan-3. Cell. 2001;106:105–116. doi: 10.1016/s0092-8674(01)00415-9. [DOI] [PubMed] [Google Scholar]
- Spiegelman BM, Flier JS. Obesity and the regulation of energy balance. Cell. 2001;104:531–543. doi: 10.1016/s0092-8674(01)00240-9. [DOI] [PubMed] [Google Scholar]
- Steigemann P, Molitor A, Fellert S, Jackle H, Vorbruggen G. Heparan sulfate proteoglycan syndecan promotes axonal and myotube guidance by slit/robo signaling. Curr Biol. 2004;14:225–230. doi: 10.1016/j.cub.2004.01.006. [DOI] [PubMed] [Google Scholar]
- Strader AD, Reizes O, Woods SC, Benoit SC, Seeley RJ. Mice lacking the syndecan-3 gene are resistant to diet-induced obesity. J Clin Invest. 2004;114:1354–1360. doi: 10.1172/JCI20631. [DOI] [PMC free article] [PubMed] [Google Scholar]
- Thiele TE, van Dijk G, Yagaloff KA, Fisher SL, Schwartz M, Burn P, Seeley RJ. Central infusion of melanocortin agonist MTII in rats: assessment of c-Fos expression and taste aversion. Am J Physiol. 1998;274:R248–254. doi: 10.1152/ajpregu.1998.274.1.R248. [DOI] [PubMed] [Google Scholar]