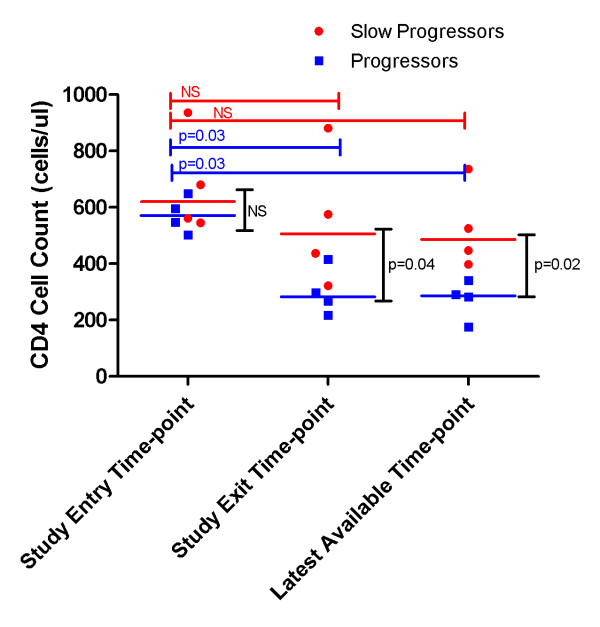
Figure 1.
CD4 of study entry, study exit and latest available time-point data for slow progressors and progressors. The red circles depict the data points for the slow-progressors. The blue squares depict data points for the progressors. Red bars and blue bars represent the p values for the slow progressors and progressors respectively. Black bars represent p values for inter-group comparison for the different time-points. NS = not significant. All comparisons between the study entry, study exit and latest available time-point parameters were performed using the Mann-Whitney unpaired t test, and p values are shown. Differences were regarded as statistically significant with a p value < 0.05. When slow progressors were compared to progressors, the analysis yielded significant differences when the CD4 at study exit and last available time-points were compared - as shown above (p = 0.04 and p = 0.02 respectively). Likewise viral load was significantly different between the groups at study exit and the latest available time-point (p = 0.03 and p = 0.02 respectively, data not shown).

