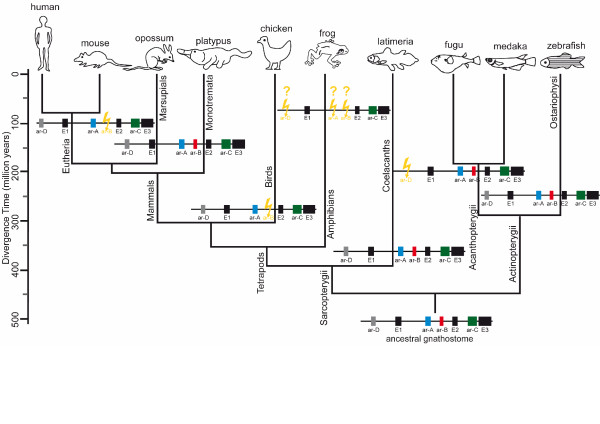
Figure 5.
Hypothetical evolution of enhancer structure of shh loci in vertebrates. The structure of the shh locus is schematically represented for each vertebrate linage on the tree showing vertebrate evolutionary relationships. The enhancers are highlighted in color: blue: ar-A; red: ar-B; green: ar-C and gray: ar-D; exons (E1, E2, E3) in black. The lightning symbol (yellow) indicates enhancer loss in the corresponding vertebrate linage. Question marks indicate incomplete sequence data. The species divergence time scale was adapted from literature data [46-48].

