Abstract
A simple, rapid UV–Vis spectrophotometry method for the determination of total flavonoids in Sedum sarmentosum Bunge., S. lineare Thunb., and S. erythrostictum Migo. was developed, with a good linearity, precision, and stability. The detection wavelength was set at 500 nm, and an extraction solvent was optimized. Through the comparative study of multiple samples of the three plant drugs, their collected seasons and the habitats can be preliminarily ascertained, which may help to control the quality of the medicines to some extent.
Keywords: Genus Sedum, quality control, total flavonoid content, UV–Vis spectrophotometry
INTRODUCTION
Sedum sarmentosum Bunge., S. lineare Thunb., and S. erythrostictum Migo. are three Sedum plant medicines widely used against hepatitis, dysentery, herpes zoster, and swelling in China. Since S. sarmentosum Bunge. is famous for its validity of acute or chronic hepatitis, it has been recorded by Chinese Pharmacopoeia (2010), and various preparations have been developed from it. According to the present reports, the active components of S. sarmentosum Bunge. due to liver protection and alanine aminotransferase (ALT) decrease mainly exist in the water portion and n-butanol portion which principally include the glycosides and flavonoids, suggesting that the medicinal properties of S. sarmentosum Bunge. might result from pharmacologically active bioflavonoids.[1–5] Thus, the total flavonoid determination could reflect the quality of the drug to some extent.
Traditional extraction techniques, such as maceration, heating reflux, and soxhlet extraction, are often effective but time consuming or labor intensive. In contrast, ultrasonic extraction can extract analytes from various matrices in a shorter time. Besides, the quantification of total flavonoids was usually completed by UV–Vis absorption at 500 nm and calculated against a stand reference in routine analyses.[6–9] Although a number of papers have reported on the quantification of total flavonoids in traditional herbal medicines, few described the determination combined with comparison among several kinds of herbal drugs from different habitats as well as various months of collection together.
This article aimed to develop a rapid simple approach to estimate the quality of the three crude medicines and try to preliminarily explore the relationships among the harvest period, habitat, and drug quality.
MATERIALS AND METHODS
Apparatus
KQ-500E ultrasonic apparatus (Kunshan Ultrasonic Instrument Co., Ltd., Beijing, People’s Republic of China) was applied here and the outpower was 500 W, with a frequency of 40 kHz. The determination was performed on a 757 CRT UV–Vis spectrophotometer (Lengguang Instrument Co., Ltd., Shanghai, People’s Republic of China).
Reagents and materials
The standard rutin was purchased from National Institute for the Control of Pharmaceutical and Biological Products (batch number: 100080-200707); the ethanol and petroleum ether employed were of the analytical reagent grade. Double distilled water was used in this work.
The three plant medicines, harvested from Jianshi, Yichang, Huangmei, and Wuhan, Hubei province, in different months were air-dried immediately under 60°C and were respectively identified as S. sarmentosum Bunge., S. lineare Thunb., and S. erythrostictum Migo. by Professor Wan Dingrong from College of Pharmacy, South-Central University for Nationalities [Table 1].
Table 1.
Drug samples and their sources
| Species | Habitat | Date of | People for whom collection was done and specimen number |
|---|---|---|---|
| S. sarmentosum Bunge. | Jianshi | April 27, 2006 | Congrong Wang 060427 |
| June 28, 2006 | Congrong Wang 060620 | ||
| September 16, 2006 | Congrong Wang 060901 | ||
| Yichang | April 16, 2006 | Dingrong Wan 060401 | |
| July 14, 2009 | Yujie Chen, Jing Wang 090703 | ||
| September 29, 2009 | Yujie Chen, Jing Wang 090906 | ||
| Wuhan | April 3, 2006 | Dingrong Wan 060403 | |
| June 6, 2009 | Dingrong Wan 090601 | ||
| August 29, 2006 | Dingrong Wan 060810 | ||
| S. lineare Thunb. | Huangmei | April 2, 2009 | Dingrong Wan 090401 |
| Luotian | July 14, 2006 | Dingrong Wan 060706 | |
| Huangmei | October 5, 2008 | Jing Wang, Ran Xu 081001 | |
| S. erythrostictum Migo. | Jianshi | April 26, 2006 | Congrong Wang 060427 |
| June 27, 2006 | Congrong Wang 060627 | ||
| September 17, 2006 | Congrong Wang 060908 | ||
| Wuhan | April 3, 2006 | Dingrong Wan 060403 | |
| May 2, 2006 | Dingrong Wan 060505 | ||
| October 4, | Wan Dingrong | ||
| 2006 | 061004 |
Sample preparation
Each dried plant drug was crushed and passed through a 20-mesh sieve. Then 1.0 g of each sample was accurately taken, mixed with 50 ml of petroleum ether, and extracted ultrasonically twice for 40 min. Poured out the petroleum ether solution. After the sample powder was dried completely, 100 ml of 70% ethanol was added, and subjected to another ultrasonic extraction for 90 min (3 × 30 min) at 55°C, and then filtered into a flask to make a total volume of 100 ml with 70% ethanol.
Standard preparation
A total of 200.0 mg/l of the rutin standard solution was prepared by dissolving rutin reference material in 70% ethanol.
Procedures for the determination of total flavonoids
A total of 4 ml of each sample extraction was pipetted into a 10-ml volumetric flask. The solution was treated with 0.40 ml of the 5% NaNO2 solution for 6 min and evenly mixed, into which 0.4 ml of the 10% Al(NO3)3solution was added and shaked up; then 6 min later, 4ml of the 4% NaOH solution was added to it. The mixture was diluted to the volume with double distilled water, and allowed to stand for 15 min before analyzing against the blank solution.
RESULTS AND DISCUSSION
Selection of the detection wavelength
The absorption spectra of the three sample extraction and rutin solutions were obtained. The absorption peak of rutin was at 510 nm and S. lineare Thunb. at 500nm, while both S. lineare Thunb. and S. erythrostictum Migo. solutions had strong absorptions at a little less than 500 nm. Comprehensively, 500 nm was chosen as the detection wavelength.
Optimization of the extraction solvent
Since flavonoids contain some hydroxyl groups, they often dissolve easily in alcohol or alcohol–water mixtures. The S. sarmentosum Bunge. sample (Jianshi, June 28, 2006) was employed here, trying to find out the optimum solvent for sample extraction. The relationship between alcohol concentration and the yield of the total flavonoids is shown in Figure 1. In the figure, we could see that the extraction yield kept increasing and reached the top when the ethanol concentration went up to 70%, and then began to fall sharply as the ethanol concentration continued growing. Hence, the optimum extraction solvent turned out to be 70% ethanol.
Figure 1.
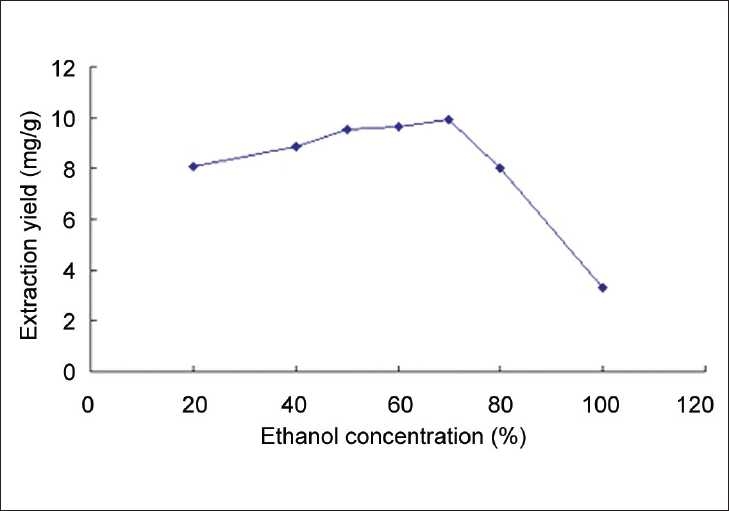
The relationship between the ethanol concentration and the flavonoid extraction yield of S. sarmentosum Bunge.
Method validation
All the sample solutions applied here were made from the S. sarmentosum Bunge. sample collected in Jianshi, June 28, 2006.
The linearity of the method was tested by analyzing different amounts of the standard solution (0, 0.2, 0.5, 1, 2, 3, 4 ml, respectively) coupled with isometric color development reagents according to the procedures for the determination of total flavonids. A good linear response was shown (r > 0.999) over the range of 4–80 μg/ml, with an equation A = 12.155C + 0.005, in which A meant the absorbance value while C (mg/mL) represented the concentration of the rutin solution.
Exactly took 4 ml of the S. sarmentosum Bunge. sample solution, operated according to the colorimetric method mentioned above and determined successively for five times. The average absorption was 0.489, and the RSD attained was 0.09%, demonstrating that the instrument used had a high precision.
A series of S. sarmentosum Bunge. samples were taken and treated according to sample preparation and colorimetric methods mentioned above. The flavonoid contents calculated from regression equation were 1.06%, 1.05%, 1.01%, 1.04%, 1.01%, and 1.00%, so the average content was 1.03% with RSD < 2.7% (n = 6), investigating a good repeatability.
Recovery experiment was performed to evaluate the accuracy of the methods. 1.0g of S. sarmentosum Bunge. sample powder were spiked with 0.5ml rutin solution (containing 10 mg of rutin) prior to the extraction. The spiked samples were analyzed in six copies. Recoveries of total flavonoids obtained are shown in Table 2, which informed us that the method possessed a nice accuracy.
Table 2.
Recoveries of total flavonoids
| Sample amount (g) | Flavonoids in the sample (mg) | Spiked rutin amount (mg) | Determined flavonoid amount (mg) | Recovery (%) | Mean recovery (%) | RSD |
|---|---|---|---|---|---|---|
| 1.0003 | 10.3031 | 10 | 20.07404 | 0.977094 | 93.8 | 2.80 |
| 1.0003 | 10.3031 | 10 | 19.7861 | 0.9483 | ||
| 1.0002 | 10.3021 | 10 | 19.86837 | 0.956627 | ||
| 1.0001 | 10.3010 | 10 | 19.58042 | 0.927942 | ||
| 1.0001 | 10.3010 | 10 | 19.49815 | 0.919715 | ||
| 0.9999 | 10.2990 | 10 | 19.29247 | 0.899347 |
After the extraction of S. sarmentosum Bunge., the sample mentioned above was dealt with according to the procedures for the determination of total flavonoids; absorptions were measured every 20 min ranging from 0 min to 120 min [Figure 2]. It’s clear that the absorption of the solution was relatively stable (RSD = 0.78%) if the measurement was carried out within 120 min. Thus, all the analyses should be performed within 2 h after the color reaction.
Figure 2.
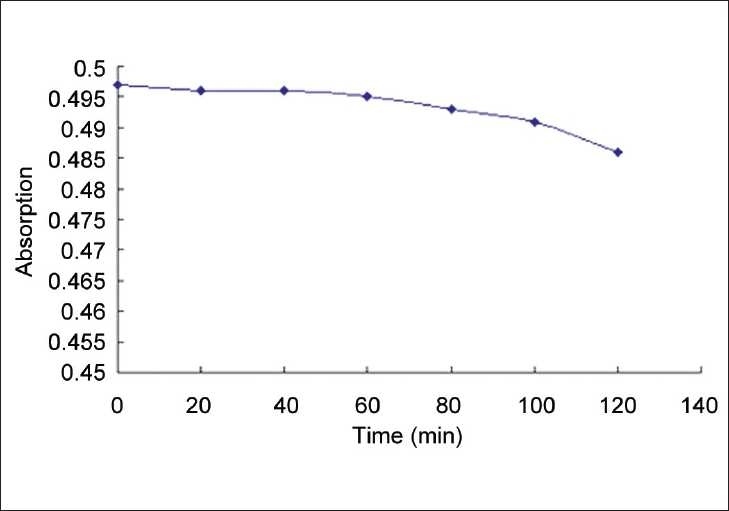
The relationship between the analysis time and absorption
Sample analysis
The present method was applied to the analyses of flavonoid contents in three crude drugs from Genus Sedum and the results are displayed in Table 3. It is obvious that all the related plant drugs contain flavonoids, which may be associated with their common pharmacological actions.
Table 3.
Total flavonoids in three crude drugs from the genus Sedum
| Species | Habitat | Date of collection | Flavonoid content (%) |
|---|---|---|---|
| S. sarmentosum Bunge. | Jianshi | April 27, 2006 | 2.09 |
| June 28, 2006 | 1.04 | ||
| September 16, 2006 | 1.41 | ||
| Yichang | April 16, 2006 | 2.52 | |
| July 14, 2009 | 1.10 | ||
| September 29, 2009 | 1.22 | ||
| Wuhan | April 3, 2006 | 1.93 | |
| June 6, 2009 | 0.82 | ||
| August 29, 2006 | 0.64 | ||
| S. lineare Thunb. | Huangmei | April 2, 2009 | 1.88 |
| Luotian | July 14, 2006 | 0.91 | |
| Huangmei | October 5, 2008 | 1.44 | |
| S. erythrostictum Migo. | Jianshi | April 26, 2006 | 2.18 |
| June 27, 2006 | 1.10 | ||
| September 17, 2006 | 0.85 | ||
| Wuhan | April 3, 2006 | 1.04 | |
| May 2, 2006 | 0.86 | ||
| October 4, 2006 | 0.66 |
A relationship between total flavonoid content and harvest season is also revealed by Table 3. All the three plant medicines contained maximum flavonoids in April (flowering period), and then the flavonoid quantities kept decreasing from April to June or July (during this time, the leaves of S. erythrostictum Migo. mostly fell down). But for S. sarmentosum Bunge. and S. lineare Thunb., the contents began to rise a little after August [Figures 3 and 4] (except S. sarmentosum Bunge. sample collected in Wuhan), while the flavonoid quantities of S. erythrostictum Migo. continued to drop during autumn [Figure 5]. It seemed that all the three plant drugs should have the best quality if harvested in flowering time. Thus, the quality could be preliminarily controlled by flavonoid determination.
Figure 3.
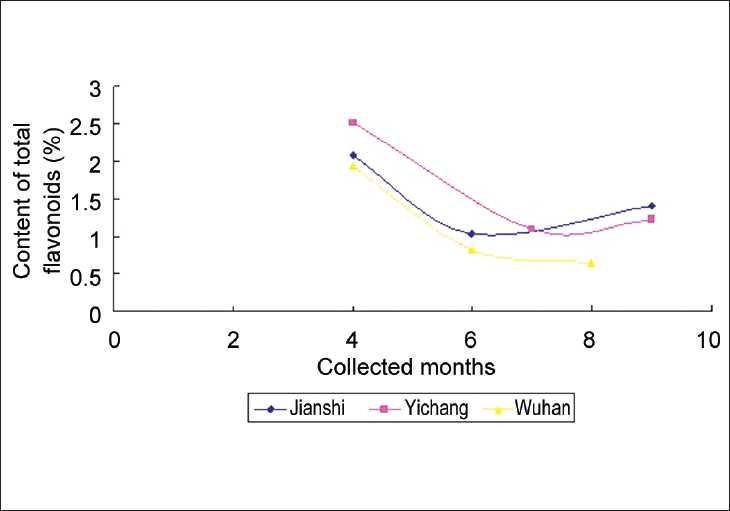
The relationship among month of collection, habitat and the content of total flavonoids in S. sarmentosum Bunge.
Figure 4.
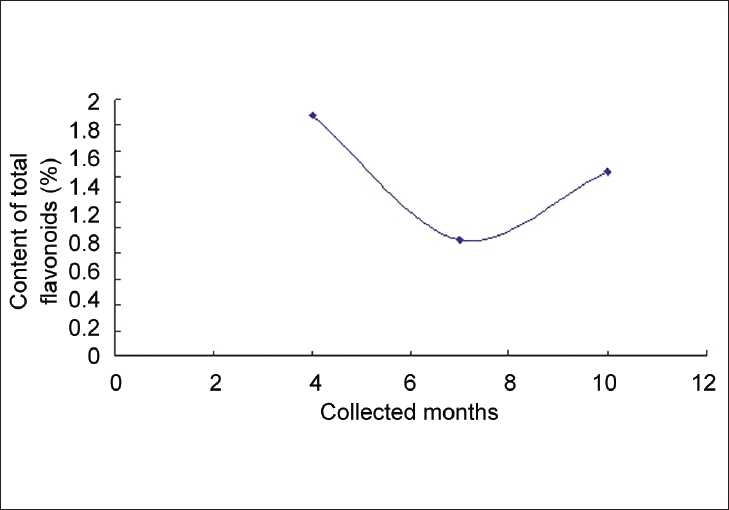
The relationship between month of collection and the content of total flavnoids in S. lineare Thunb
Figure 5.
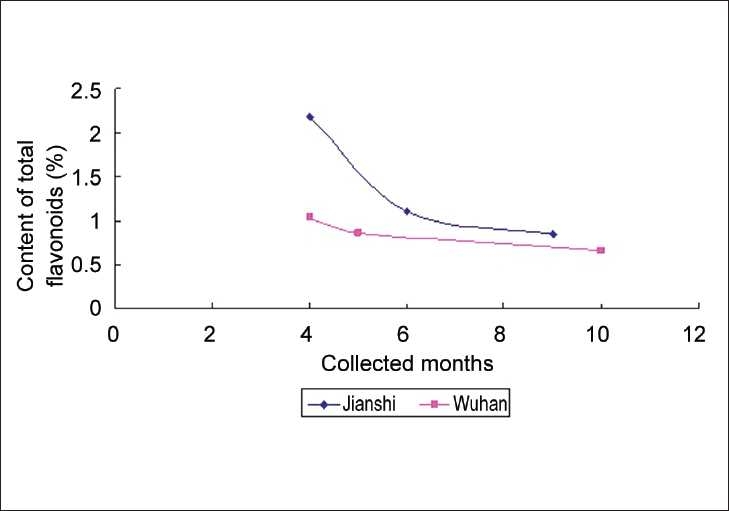
The relationship among month of collection, habitat and the content of total flavnoids in S. erythrostictum Migo
On the other hand, it was also manifested that a certain relation existed between the flavonoid content and the sample habitat. Both Figures 3 and 5 informed us that samples collected in the west of Hubei Province (Jianshi or Yichang) usually possessed higher flavonoid quantities than those collected in the east. Therefore, it was reasonable to deduce that Western Hubei should be a more suitable habitat to collect the three crude drugs from genus Sedum than the east.
CONCLUSION
As the components contained in a Chinese traditional medicine are various and complicated, the strong polar glycosides, i.e., S. sarmentosum Bunge. glycoside (Sarmentosin), are not the only active composition associated with hepatitis treatment. Flavonoid ingredients are also the key point. Therefore, the flavonoid quantities reflected the quality of the three medicines from one aspect.
Studies on total flavonoid determination of the S. sarmentosum Bunge., S. lineare Thunb., and S. erythrostictum Migo. samples collected from different habitats and months clearly manifested that the flavonoid contents are closely related to the collected seasons, which may help to judge the optimum harvest time of the three plant drugs, so that the quality could be preliminarily controlled. The results also suggested that the flavonoid content changed with the habitat. The samples harvested in the west of Hubei usually possessed higher flavonoid contents compared with those collected in the east.
The method established for the flavonoid determination in three crude drugs of genus Sedum was simple, direct, and accurate, providing a valuable reference for quality control.
Footnotes
Source of Support: Nil
Conflict of Interest: None declared.
REFERENCES
- 1.Wan DR, Chen JC, Yu HH. Vol 1. Wuhan: Hubei Science and Technology Press; 2002. Records on Material Medical of Hubei; p. 319. [Google Scholar]
- 2.Pan JH, He MT. The screening of the components due to protect liver and decrease the ALT in Sedum erythrostictum Migo. Chin Pharm Aff. 2002;16:365–6. [Google Scholar]
- 3.He AM, Wang MS. The flavonoids in Sedum erythrostictum Migo. Chinese Trad Herbal Drugs. 1997;28:517–22. [Google Scholar]
- 4.Pan JH, He MT, Luo L, Yan J. Test of protecting liver and reducing enzyme levels on different extraction sites from sedum sarmentosum bunge. Lishizhen Med Mater Med Res. 2001;12:888. [Google Scholar]
- 5.Pan JH, Xue CY, Yan J, Liu XH. Test of protecting liver and reducing enzyme levels of isorhamnetin-3,7-di-O-β-D-glucopyranoside. Lishizhen Med Med Mater Res. 2002;13:714–5. [Google Scholar]
- 6.Kartashova GS, Sudos LV. Quantitative determination of flavonoids in the above-ground part of agrimony plants. Pharm Chem J. 1997;31:488–91. [Google Scholar]
- 7.Heimler D, Pieroni A, Tattini M, Cimato A. Determination of flavonoids, flavonoid glycosides and biflavonoids in Olea europaea L. Leaves. Chromatographia. 1993;33:369–73. [Google Scholar]
- 8.Marinova D, Ribarova F, Atanassova M. Total phenolics and total flavonoids in bulgarian fruits fruits and vegetables. J Univ Chem Technol Metallurgy. 2005;40:255–60. [Google Scholar]
- 9.Soares LA, Bassani VL, Ortega GG, Petrovick PR. Total flavonoid determination for the quality control of aqueous extractives from Phyllanthus niruri L. Lat. Am J Pharm. 2003;22:203–7. [Google Scholar]


