Abstract
Activation of the small GTP-binding protein Arf1, a major regulator of cellular traffic, follows an ordered sequence of structural events, which have been pictured by crystallographic snapshots. Combined with biochemical analysis, these data lead to a model of Arf1 activation, in which opening of its N-terminal helix first translocates Arf1-GDP to membranes, where it is then secured by a register shift of the interswitch β-strands, before GDP is eventually exchanged for GTP. However, how Arf1 rearranges its central β-sheet, an event that involves the loss and re-formation of H-bonds deep within the protein core, is not explained by available structural data. Here, we used Δ17Arf1, in which the N-terminal helix has been deleted, to address this issue by NMR structural and dynamics analysis. We first completed the assignment of Δ17Arf1 bound to GDP, GTP, and GTPγS and established that NMR data are fully consistent with the crystal structures of Arf1-GDP and Δ17Arf1-GTP. Our assignments allowed us to analyze the kinetics of both protein conformational transitions and nucleotide exchange by real-time NMR. Analysis of the dynamics over a very large range of timescale by 15N relaxation, CPMG relaxation dispersion and H/D exchange reveals that while Δ17Arf1-GTP and full-length Arf1-GDP dynamics is restricted to localized fast motions, Δ17Arf1-GDP features unique intermediate and slow motions in the interswitch region. Altogether, the NMR data bring insight into how that membrane-bound Arf1-GDP, which is mimicked by the truncation of the N-terminal helix, acquires internal motions that enable the toggle of the interswitch.
Keywords: Enzyme Kinetics, Exchange, G Proteins, NMR, Protein Conformation, Protein Structure, Protein Turnover, Protein Dynamics
Introduction
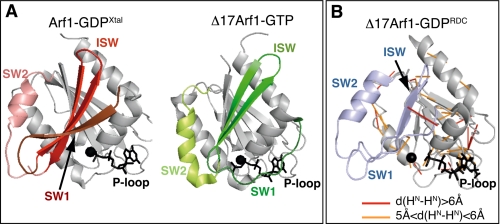
The interplay between the structure of proteins and the nature and timescales of their internal motions, which have become accessible to analysis with recent advances in nuclear magnetic resonance (NMR) spectroscopy methods (1, 2), is increasingly recognized as a major component underlying protein functions (reviewed in Refs. 3, 4). In particular, the characterization of conformational fluctuations is gaining considerable interest for proteins that undergo large and/or allosteric conformational changes to carry out their functions (5, 6). Small GTP-binding proteins (GTPases)4 represent a fascinating family in that regard, as they undergo large amplitude conformational changes upon converting from their inactive, GDP-bound form to their active, GTP-bound form and adapt their structures to their interactions with multiple regulators and effectors (reviewed in Ref. 7). 15N relaxation and/or H/D exchange NMR experiments conducted on Rho and Ras family GTPases have begun to unravel the contribution of internal dynamics to GTPase-based processes, and how the dynamics profiles vary with the nucleotides in presence or the introduction of mutations (8–10). 15N-HSQC-based real-time NMR analysis of spontaneous and guanine nucleotide exchange factor (GEF)-stimulated nucleotide exchange (11), as well as spontaneous and GTPase-activating protein (GAP)-stimulated GTP hydrolysis (12) has also been recently established. In this work, we investigate the relationship between structure and dynamics of Arf GTPases, which are central regulators of most aspects of intracellular traffic and its cross-talk to cytoskeleton dynamics (reviewed in Ref. 13). The GDP/GTP switch of Arf proteins represents an extreme case in the GTPase kingdom, characterized by a specific structural device that allows nucleotide exchange to be coupled to membrane recruitment (reviewed in Ref. 14). This device is comprised of the classical switch 1 and switch 2 found in all GTPases and two regions that are unique to Arf proteins: an amphipathic, myristoylated N-terminal helix, and 2 β-strands that connect switch 1 to switch 2 (the interswitch) (Fig. 1A). The sequence of conformational changes that take place in the course of Arf activation have been captured by crystallographic snapshots of Arf1, the major eukaryotic isoform, either alone or in complex with GEFs. Structural and biochemical studies have been integrated into a robust model for GEF-stimulated Arf1 activation in cells as follows: (i) the N-terminal helix of Arf1-GDP blocks the interswitch in an eclipsed conformation, which is not competent for binding to membranes (15–17); (ii) the N-terminal helix opens up and binds to membranes, releasing its hasp on the interswitch (18); (iii) binding of the GEF displaces the switch 1 and promotes a 2-residue register shift of the interswitch, which secures Arf1-GDP to membranes and primes the nucleotide-binding site for GTP (19); (iv) GDP is expelled from the nucleotide binding site (20, 21); (v) binding of GTP reorganizes the switch 1 and switch 2 regions (21, 22). Whether spontaneous nucleotide exchange follows the exact same route is currently not known.
FIGURE 1.
Comparison of NMR and crystallographic structural data. A, crystal structure of Arf1-GDP (Arf1-GDPXtal) and Δ17Arf1 Q71L-GTP (pdb 1O3Y). B, NMR structure of Δ17Arf1-GDP (Δ17Arf1-GDPRDC). 1HN-1HN nOes corresponding to distances larger than 5 Å in Δ17Arf1-GDPRDC are mapped as orange (5–6 Å) and red (>6 Å) bars on the structure. All structures were drawn with Pymol (DeLano Scientific LLC).
A few NMR structural studies have also been reported for Arf1 in solution. Backbone assignments have been published for unmyristoylated full-length human Arf1-GDP (23), for the GDP-bound form of a truncated Arf1 mutant that lacks the N-terminal helix (human Δ17Arf1) bound to GDP (24), and for myristoylated full-length yeast Arf1-GDP (17, 25). A structural model of human Δ17Arf1-GDP was established by refining the crystal structure of Arf1-GDP against residual dipolar couplings (RDCs), which departed considerably from the available crystal structures (24), while the NMR structure of myristoylated yeast Arf1-GDP was much closer to the crystal structures (17). However, none of these studies investigated the contribution of dynamics to the activation process.
In this work, we used NMR spectroscopy to analyze spontaneous nucleotide exchange in real time and determine the internal dynamics of Arf1-GDP, Δ17Arf1-GDP, and Δ17Arf1-GTP. Our results, combined with the biochemical and structural data, bring new insight in the interswitch toggle mechanism.
EXPERIMENTAL PROCEDURES
Protein Preparation
Uniformly 15N, (15N, 13C) and (13C, 15N, 2H) labeled human Arf1 or Δ17Arf1 were produced in Escherichia coli in M9 minimal media in milliQ water or heavy water supplemented with 15NH4Cl and [12C/13C] glucose. Arf1 constructs and unlabeled human ARNO (Sec7 domain) were purified to homogeneity as described in Ref. 19. All NMR experiments were done in 50 mm HEPES pH 7.3, 5% D2O, 150 mm NaCl. The percentage of isotope-labeling was [U-100% 15N], [U-98% 13C; U-98% 15N], and [U-98% 13C; U-98% 15N; U-70% 2H) as checked by mass spectrometry. Δ17Arf1 was purified as a mixture of GDP- and GTP-bound forms, and was loaded with either GDP, GTP, or GTPγS by heating the protein samples (100–600 μm) at 310 K during 30 min in the presence of 10 mm Mg2+ and 10 mm nucleotide. Full-length Arf1 was purified as a GDP-bound form.
NMR Spectroscopy
NMR spectra were recorded on Bruker 600 MHz, 700 MHz, 800 MHz, 900 MHz, or 950 MHz Avance spectrometers equipped with a triple resonance triple axes gradient TXI probe for the 700 MHz and triple resonance z axis gradient TXI cryoprobes for the others. One-dimensional 1H and 31P experiments were recorded on a 500 MHz Varian Inova spectrometer equipped with a penta-probe.
Backbone Assignments and Structural Analysis of Chemical Shifts
Backbone resonance assignments were done at 298 K using triple resonance experiments (HNCA, HNCACB, CBCA(CO)NH with TROSY versions for deuterated samples). Complete assignments could not be achieved from deuterated samples alone due to a lack of proton back-exchange, and requested the combination of data obtained on protonated and deuterated proteins. 1H chemical shifts were referenced to DSS, indirect referencing was used for 15N and 13C chemical shifts. Direct assignment of Δ17Arf1-GTP was not possible because of the hydrolysis of GTP in the course of the spectra recording, yielding a mixture of Δ17Arf1-GDP and Δ17Arf1-GTP resonances. (15N, 13C, 1H) assignments of Δ17Arf1-GDP and Δ17Arf1-GTPγS were thus carried out first, from which the (1H,15N) backbone assignments of Δ17Arf1-GTP could be deduced. Data were processed using NMRpipe (26) and analyzed with Sparky (T. D. Goddard and D. G. Kneller, SPARKY 3, University of California, San Francisco). Secondary structures were predicted from the C′, CA, CB, N, and HN chemical shifts by TALOS (27). Normalized chemical shifts variations between forms A and B were computed from 15N and 1HN chemical shifts according to Equation 1.
 |
Amide protons in close proximity were identified from three-dimensional (1H,15N,1H) NOESY-HSQC experiments recorded at 800 and 900 MHz on both protonated and deuterated samples using two mixing times of 80 and 120 ms.
Real-time NMR Analysis of Nucleotide Exchange
All experiments were done at a protein concentration of 100 μm. GTPγS (20-fold excess) was added at the beginning of each experiment. The purity of the GTPγS stock solution (10 mm) was assessed from 31P one-dimensional spectra. No 31P signal other than the three characteristic peaks of GTPγS was detected after 6 h of accumulation, thus demonstrating purity higher than 95% (supplemental Fig. S6). Series of one-dimensional 1H spectra were recorded at 500 MHz until complete nucleotide exchange. 100 successive (1H,15N) HSQC experiments lasting 16 min each were recorded at 800 MHz until complete nucleotide exchange. The temperature (298 K) was calibrated for each spectrometer using the 100% methanol standard Bruker temperature calibration sample. The decrease of peak intensities as a function of time was fitted to a monoexponential function using either Kaleidagraph (one-dimensional experiments) or MATLAB (HSQC). Uncertainties were estimated from 500 simulated data sets using a Monte-Carlo procedure.
A unique protein preparation was split in two identical samples for the one- and two-dimensional experiments. One peak corresponding to the amide proton of Leu-25 in the Δ17Arf1GDP form was isolated in the one-dimensional spectra, so that its intensity decrease upon GTPγS exchange could be monitored in both one- and two-dimensional series. This peak was thus used as a reference to check the consistency between the one- and two-dimensional real time experiments. Identical half times were obtained from the analysis of the one-dimensional peak and the two-dimensional cross-peak of Leu-25.
15N Relaxation Experiments
15N R1, 15N R2, and (1H→15N) nOe experiments were recorded at 700 MHz. 10 relaxation delays were measured between 30 and 3000 ms for 15N R1 and between 0 and 256 ms for 15N R2, with one delay repeated 3 times for error evaluation. Either pseudo-three-dimensional experiments or series of two-dimensional experiments were used. In the pseudo-three-dimensional experiments, the relaxation delay pseudo third dimension was built the fastest and was incremented after each scan. The use of this strategy for Δ17Arf1-GTP minimized the contribution of the GDP-bound form signal arising from GTP hydrolysis. For heteronuclear (1H→15N) nOe experiments, interleaved saturated and unsaturated experiments were acquired. The delay for proton saturation was set to 4 s. All data were processed with nmrPipe (26), intensities were calculated with nmrView (One Moon Scientific Inc). R1 and R2 relaxation rates were determined by fitting peak intensities to a single-exponential decay using house-written MATLAB procedures. Uncertainties were estimated as above. The (1HN→15N) nOe values were taken as the ratio between the intensities of corresponding peaks in the spectra recorded with and without saturation of the amide protons. A model-free analysis of relaxation data were performed with the software TENSOR 2 (28).
Relaxation Dispersion Experiments
Spectra were recorded at 700 MHz and 950 MHz at 298K using a pseudo-three-dimensional (interleaved) constant time CPMG sequence optimized as described by Hansen et al. (29, 30). The CPMG delay (TCPMG) was set to 20 ms. 15–17 experiments were acquired with 15N 180° pulses repetition frequencies (νCP) between 25 and 1000 Hz during TCPMG. Peak intensities were converted to relaxation rates, and uncertainties in relaxation rates were calculated from repeated experiments as described in Ref. 31. The dispersion curves at the two fields were fitted simultaneously to a global two-state fast exchange (Meiboom equation) using house written MATLAB procedures. Uncertainties were estimated from 1000 simulated data sets using a Monte-Carlo procedure.
H/D Exchange Experiments
All U-[15N] protein samples were lyophilized and dissolved in D2O immediately prior to the (1H,15N) HSQC experiments. Experiments were carried out at 298K at 700 MHz (Arf1-GDP) or 600 MHz (Δ17Arf1-GDP). The first spectrum was completed ∼20 min after dissolving the protein in D2O. Series of (1H-15N) HSQC spectra were recorded over 48 h. Data were analyzed using similar procedures as those described for relaxation experiments. Protection factors were obtained as the ratio between the experimentally derived exchange rate constants kex and the intrinsic exchange rate constants kint calculated with the Sphere software.
RESULTS
Assignments and Cross-validation of NMR and Crystallographic Δ17Arf1 Data
To enable the real-time and dynamics NMR analysis of Arf1 activation on a sound basis, we established the assignment of human Δ17Arf1 bound to GDP, GTP, and GTPγS (supplemental Fig. S1). We first re-assessed the 1H, 15N, and 13C assignments of Δ17Arf1-GDP, which confirmed and completed the corrections, published by Viaud et al. (32), and assigned the three-dimensional spectrum of Δ17Arf1 bound to the non-hydrolyzable GTP analog GTPγS (supplemental Tables S1 and S2). We obtained high quality spectra for Δ17Arf1-GTPγS that showed no indication of hydrolysis over time, from which most backbone resonances could be assigned. Δ17Arf1-GDP and Δ17Arf1-GTPγS assignments were eventually used to assign the (1H,15N) resonances of Δ17Arf1-GTP from mixed Δ17Arf1-GDP/Δ17Arf1-GTP HSQC spectra. GTPγS induced only 3 significant perturbations as compared with the Δ17Arf1-GTP spectrum, which were located in the vicinity of the GTPγS sulfur (supplemental Fig. S1B). This indicates that GTPγS does not induce notable conformational changes, in agreement with 31P NMR spectroscopy comparison of Ras bound to GTP and GTP analogs, which identified GTPγS as the analog that is most similar to physiological GTP (33).
Next, we assessed the consistency between NMR data and structural models obtained from either crystallographic analysis of full-length Arf1-GDP (PDB entry 1HUR, Arf1-GDPXtal hereafter (15, 23)) or NMR analysis using RDCs (PDB entry 1U81, first structure referred to as Δ17Arf1-GDPRDC hereafter, (24)), the latter being considerably distorted with respect to known structures of Arf and other GTPases. To that purpose we analyzed normalized chemical shift variations between the different forms (CSVs), chemical shifts based secondary structure predictions, and non-sequential HN-HN nOe correlations with respect to each structural model.
CSVs between Δ17Arf1-GDP and Arf1-GDP are located mainly in switch 1, interswitch and in the C-terminal helix, while none are found in the nucleotide-binding site, at odds with its distorted conformation in Δ17Arf1-GDPRDC. Their moderate values (<0.6 ppm) are indicative of at most local and minor conformational differences (supplemental Fig. S2A). By comparison, CSVs between Δ17Arf1-GDP and Δ17Arf1-GTP amount to up to 2.5 ppm (supplemental Fig. S2B). Interestingly, chemical shifts back-calculated for Arf1-GDP using Arf1-GDPXtal and for Δ17Arf1-GDP using Arf1-GDPXtal truncated of the N-terminal helix correctly predicted the location of sizeable experimental CSVs (34), indicating that the deletion of the N-terminal helix is sufficient to yield the observed CSVs locations without major conformational changes (supplemental Fig. S3). Consistently, secondary structures predicted from the experimental chemical shifts match the secondary structures measured from Arf1-GDPXtal significantly better than those calculated from Δ17Arf1-GDPRDC (100 and 80% of α-helices, 80 and 45% of β-sheets, respectively). Finally, 135 1HN-1HN nOes were extracted from the three-dimensional (1H-15N-1HN) NOESY-HSQC spectra of Δ17Arf1-GDP. All the corresponding HN-HN distances calculated from Arf1-GDPXtal were shorter than 5 Å, whereas 44 exceeded 5 Å in Δ17Arf1-GDPRDC, out of which 11 were larger by up to 4.8 Å (Fig. 1B).
We also assessed that the crystal structure of the Δ17Arf1-GTP (22) was consistent with the NMR data, including HN-HN distances calculated from nOe correlations for Δ17Arf1-GTPγS. Altogether, this analysis establishes that the deletion of the N-terminal helix in Arf1-GDP does not alter its major conformation in solution, and that the crystal structures of Arf1-GDP and Δ17Arf1-GTP, but not Δ17Arf1-GDPRDC, are sensible three-dimensional models with which to analyze the structure and dynamics of the GDP/GTP cycle of Δ17Arf1 in solution.
Real-time NMR Study of the Nucleotide Exchange Process
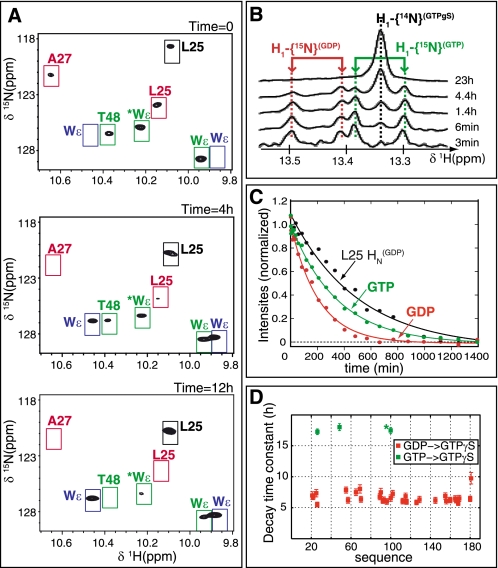
The HSQC spectra of Δ17Arf1-GDP and Δ17Arf1-GTPγS and those of Δ17Arf1-GTP and Δ17Arf1-GTPγS have 29 and 3 non-overlapping crosspeaks, respectively. The nucleotide exchange process can thus be followed in the same sample from the relative intensities of each set of crosspeaks (Fig. 2A). We also used the fact that Δ17Arf1 is purified from E. coli bound to 15N-labeled nucleotides yielding a mixture of GTP- and GDP-bound forms from which nucleotide dissociation upon addition of unlabeled GTPγS can be followed in one-dimensional proton spectra (Fig. 2B). 1H one-dimensional and (1H,15N) two-dimensional spectra were collected over time after addition of 20-fold excess GTPγS until complete exchange of GDP- and GTP- for GTPγS (Fig. 2, A and B). We could therefore monitor simultaneously the kinetics of GDP and GTP dissociation (koff_GDP and koff_GTP, Fig. 2, B and C) and of Δ17Arf1-GDP/GTP environmental changes (k1_GDP and k1_GTP). koff_GDP and koff_GTP indicate that GTPγS replaces GDP slightly faster (koff_GDP = 0.30 ± 0.03 h−1) than it does for GTP (koff_GTP = 0.12 ± 0.02 h−1). The half times of decay for (1HN,15N) peaks of Δ17Arf1GDP were similar for most residues (Fig. 2D and supplemental Fig. S4), indicating a global process with k1_GDP = 0.15 ± 0.02 h−1. A slightly smaller k1_GTP value of 0.057 ± 0.002 h−1 was obtained from the subset of GTP-associated crosspeaks that vary upon GTPγS exchange. Surprisingly, the rates of environmental changes k1_GDP and k1_GTP were about twice smaller than the off rates of nucleotides. The relevance of this difference is assessed by the measurement of an identical decrease rate of the amide proton one-dimensional peak and two-dimensional (1H,15N) crosspeak of Leu-25 in the GDP state (Fig. 2C).
FIGURE 2.
Real-time NMR analysis of nucleotide exchange. A, close-up views of (1H-15N) HSQC spectra of Δ17Arf1 collected at time = 0, 4, and 12 h after addition of GTPγS. Peaks that are specific to Δ17Arf1-GTP, Δ17Arf1-GDP, and Δ17Arf1-GTPγS, are boxed in green, red, and blue, respectively. Other peaks do not shift upon addition of GTPγS. B, one-dimensional proton spectra in the region of GDP, GTP, and GTPγS H1 at selected delays after addition of GTPγS. C, GDP (in red), GTP (in green) H1{15N}, and Leu-251HN{15N} (GDP-bound form, in black) one-dimensional peak intensities as a function of time after addition of excess GTPγS. Intensities are fitted to a monoexponential decreasing function. D, half-times calculated for the isolated cross-peaks of Δ17Arf1-GDP (red) and Δ17Arf1-GTP (green). The tryptophan side chain was not assigned and is shown by an asterisk.
We then analyzed nucleotide exchange stimulated by the Sec7 catalytic domain of the GEF ARNO. In the case of Δ17Arf1, addition of 1% molar equivalent of ARNO made the kinetics of the nucleotide exchange too fast to be monitored even by one-dimensional 1H experiments. In contrast, the (1H-15N) HSQC protein chemical shifts of full-length Arf1-GDP were unaffected by the addition of GTP or GTPγS, regardless of the presence of ARNO, as expected from previous biochemical work (reviewed in Ref. 35). Surprisingly, the bound 15N-labeled GDP was however replaced by unlabeled GTPγS in the presence of ARNO, as shown by the disappearance of the 15N doublet and the appearance of a 14N singlet. Contamination of the GTPγS sample was ruled out by 31P spectroscopy. The fact that the additional phosphate of GTPγS is accommodated in the GDP conformation of Arf1 without yielding protein CSVs in the nucleotide binding site suggests that the additional group is expelled from the nucleotide binding site.
Globally, these results suggest the presence of intermediates of the spontaneous exchange reaction that are either empty or can accommodate GDP or GTP without significant conformational change. These states could resemble those evidenced by x-ray crystallography of GDP-bound intermediates of Δ17Arf1-GDP bound to ARNO (20). In the case of Arf1-GDP, the presence of ARNO enhances some local plasticity, sufficient to release the nucleotide and accommodate a GTP, but not to produce the conformational switch.
Δ17Arf1-GDP Exhibits Dynamics over a Larger Range of Timescales than Arf1-GDP and Δ17Arf1-GTP
Whereas the structural components of the GDP/GTP exchange of Arf1 are now well established, the contribution of internal dynamics has not been investigated. Dynamics can be analyzed over a large range of time scales by 15N relaxation, which reports on fast internal motions in the pico/nanosecond range, CPMG 15N relaxation dispersion (RD) for motions in the micro to millisecond range (reviewed in Ref. 1), and H/D exchange to analyze internal flexibility in the minutes to hours range (reviewed in Ref. 2). We analyzed Δ17Arf1-GTP, Arf1-GDP, and Δ17Arf1-GDP dynamics by 15N relaxation and CPMG 15N RD and, for Arf1-GDP and Δ17Arf1-GDP by native-state H/D exchange. 15N relaxation rate constants R1, R2, and nOe, 15N CPMG RD and H/D exchange data are given in supplemental Fig. S5 and Tables S3 and S4, respectively. 15N relaxation rate constants could be measured for most residues in all Arf1 forms, except in the switch 2 due to either broad (Δ17Arf1-GDP and Arf1-GDP) or overlapping (Δ17Arf1-GTP) resonances. They were analyzed with a model-free formalism (36). 15N relaxation data indicate that all Arf forms have an isotropic global rotational motion (overall global correlation time τc at 298K for Arf1-GDP, Δ17Arf1-GDP, and Δ17Arf1-GTP equal to 10.87 ± 0.03, 10.30 ± 0.04, and 10.67 ± 0.05 ns, respectively) and behave as globular monomers in solution.
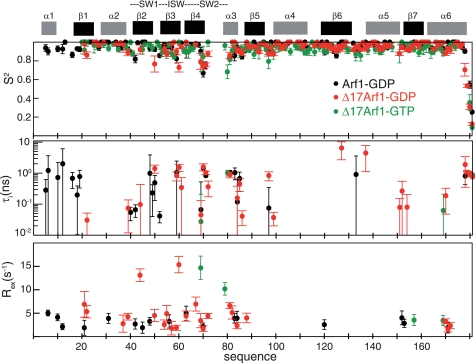
Comparison of internal dynamics shows that Δ17Arf1-GTP is the least dynamic form, displaying only highly restricted internal motions. This is apparent from the small number of residues, all of which are located near the switch 2, that have generalized order parameter S2 values smaller than 0.85, intermediate internal correlation times (τi) in the nanosecond range and conformational exchange contributions (Rex) associated to motions in micro-millisecond range (Fig. 3). Consistently, RD curves were flat for most residues, suggesting that the protein backbones have mainly localized motions in the millisecond regime (Fig. 4, right).
FIGURE 3.
Model-free analysis of 15N relaxation experiments. General order parameter S2, internal slow correlation time τi and Rex contributions are shown for Arf1-GDP (black), Δ17Arf1-GDP (red), and Δ17Arf1-GTP (green). The secondary structures and switch regions are indicated on top.
FIGURE 4.
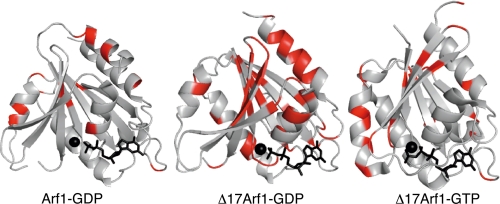
Residues exhibiting significant 15N relaxation dispersion are mapped on the structures of Arf1-GDP (left), Δ17Arf1-GDP (middle), and Δ17Arf1-GTP (right).
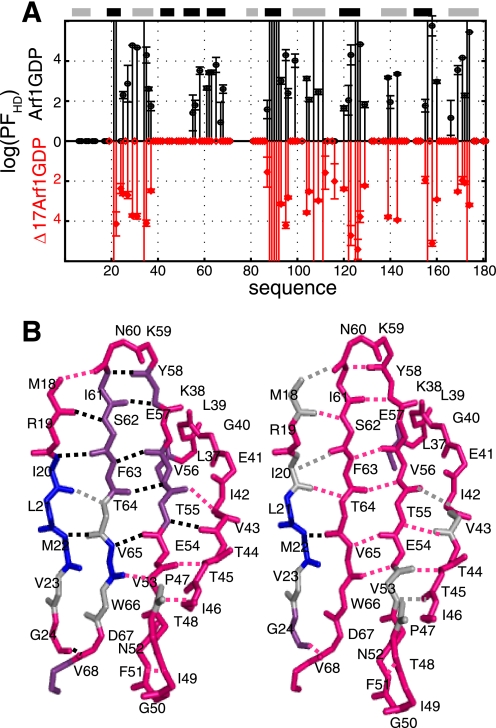
The dynamics of Arf1-GDP is somewhat more complex. Although most residues have S2 values larger than 0.85, several exhibit internal correlation time τi in the nanosecond range. This is notably the case for the N-terminal helix and switch 1 regions. Rex contributions are predicted for these regions, although they are only moderately predictive of actual millisecond exchange processes considering their rather small values (5 Hz range) (Fig. 3). Accordingly, CPMG RD experiments indicate the existence of motions in the micro/millisecond timescale for only a small number of residues, in particular in the N-terminal helix (Fig. 4, left). Finally, native-state H/D exchange experiments identified amide protons that were exchanged within minutes to hours, and were located across the entire structure (Fig. 6A, top). In particular, all amide protons located in the N-terminal helix and in the switch 1 are solvent-exchanged within minutes, suggesting that these structures are flexible in this form.
FIGURE 6.
Native-state H/D exchange experiments. A, logarithm of solvent protection factors (log(PFHD)) of the amide protons of Arf1-GDP (black) and Δ17Arf1-GDP (red) as a function of the protein sequence. Zero values correspond to residues whose amide protons are already fully exchanged in the first HSQC spectrum. Values higher than six correspond to residues that were not exchanged after 120 h. B, H/D exchange in the interswitch region and flanking β1 and switch 1 β-strand in Arf1-GDP (left) and Δ17Arf1-GDP (right). Residues whose amide protons exchange with deuterium faster than minutes, in the order of hours, and slower than a week are represented in pink, purple, and blue, respectively. Amide protons of residues that cannot be assigned are shown in gray (ND). Hydrogen bonds are highlighted in pink for those involving fast exchanged amide protons (<min), in gray for ND, and in black otherwise.
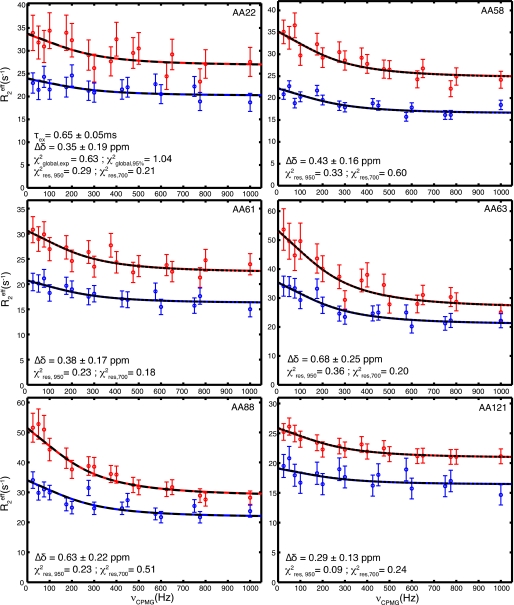
The dynamics of Δ17Arf1-GDP departed significantly from those of both Δ17Arf1-GTP and Arf1-GDP. While most residues have S2 values larger than 0.85 and only a small number have intermediate internal correlation times τi in the ns range, Rex contributions in the switch regions are significantly larger than those calculated for Arf1-GDP (Fig. 3). In contrast with Arf1-GDP and Δ17Arf1-GTP, a large number of residues exhibit non-flat CPMG RD curves, which reveals extensive internal motions in the micro-millisecond time scale. Interestingly, a set of residues exhibiting significant RD was located along the whole β-sheet (Fig. 4, middle panel). The exchange rate constant kex equal to 1530 ± 110 s−1 obtained from the global fit of the data at two fields is compatible with a two-state fast exchange (Fig. 5). This fast exchange regime is corroborated by the quadratic dependence of the exchange contributions Rex with the magnetic field (ratio of Rex at 22.3T and 16.45T equal to 1.84 for all residues). Under this condition, the fitted parameter is Δδapp = [pB(1 − pB)](1/2)Δδ and it is not possible to extract the population of each state and the difference in chemical shifts Δδ between the states for each residue. However, it should be noted that because pB is the same for all residues (global exchange), the relative variations of Δδ between residues along the sequence is independent of the population. The results are given in supplemental Table S3.
FIGURE 5.
15N relaxation dispersion curves and fits for Δ17Arf1-GDP. Representative 15N relaxation dispersion profiles for residues located in the interswitch and in the central β-sheet in the Δ17Arf1-GDP state. Data at 22.3T (νH = 950 MHz) and 16.45T ((νH = 700 MHz) are represented in red and blue, respectively. Plain lines correspond to the optimal global fit of the experimental data to the Meiboom equation. Dashed black curves correspond to the Meiboom curves back calculated with the mean parameters resulting from 1000 simulated MonteCarlo data. The fit yields one global exchange time τex (= 1/kex) and one apparent Δδapp = pB(1-pB)Δδ for each residue. The value of Δδ indicated for each residue was calculated for pB = 0.5 and correspond to the minimal possible value. χ2 values are also indicated for the global fit of experimental data (χ2global,exp), for the 1000 MonteCarlo fits (χ2global,95%), and for each residue at each field (χ2res,950 and χ2res,700).
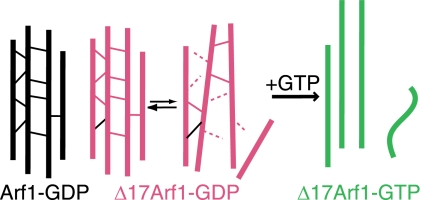
Native-state H/D exchange experiments identified essentially the same amide proton in slow exchange as in Arf1-GDP, except for a striking decrease of the protection factors in the vicinity of the interswitch region (Fig. 6A, bottom). This decrease of the protection factors in Δ17Arf1-GDP as compared with Arf1-GDP indicates that 8 of the hydrogen bonds that are predicted from the crystal structure are likely to be less stable in Δ17Arf1-GDP (Fig. 6B, right) than in Arf1-GDP (Fig. 6B, left, supplemental Table S4). Notably, all hydrogen bonds between the β-strands of the interswitch (β2-β3), and additional hydrogen bonds between the interswitch and strand β1 or switch 1 are less stable in Δ17Arf1-GDP than in Arf1-GDP. As a conclusion, our results show that buried interswitch residues that are protected in Arf1-GDP become unprotected in Δ17Arf1-GDP. Thus the truncation of the N-terminal helix induces motions that allow H/D exchange to take place deep in the protein, involving the disruption of internal hydrogen bonds (Fig. 7).
FIGURE 7.
Schematic view of the β1-β4 strands in Arf1-GDP and Arf1-GTP. A possible mechanism of the 2-residue register shift of the interswitch between the GDP- and GTP-bound states is proposed.
DISCUSSION
To establish the first dynamics analysis of an Arf GTPase on a sound basis, we first completed the assignment of human Δ17Arf1 bound to GDP, GTP, and GTPγS, and carefully assessed that available NMR information for Arf1 and Δ17Arf1 was fully consistent with crystallographic three-dimensional data. This ruled out the conclusion of a previous work (24), which inferred that the crystal structures were not relevant to the structures in solution. This also shows that RDCs should be used with caution in structure calculations, as they also incorporate internal dynamics contributions, which as we show here are sizable in Δ17Arf1-GDP.
NMR relaxation dispersion techniques recently emerged as a powerful approach to analyze the propagation of dynamics across proteins on a per-residue basis in signaling or enzymatic processes (reviewed in Refs. 3, 4). Our ensemble of Arf1 assignments allowed us to undertake an extensive analysis of the dynamics profiles of Arf1-GDP, Δ17Arf1-GDP, and Δ17Arf1-GTP in time scales ranging from fast and intermediate to slow motions. Notably, incorporation of native state H/D exchange data allowed us to gain access to motions in the minutes to hours range. Our analysis reveals that Δ17Arf1-GTP and Arf1-GDP dynamics are restricted to fast and local motions, whereas Δ17Arf1-GDP displayed a complex dynamics behavior with components in the fast, intermediate and slow regimes. Consistent with these observations, Δ17Arf1-GDP is thermodynamically less stable than Δ17Arf1-GTP and Arf1-GDP, as reflected by their denaturation temperatures measured by the thermo-fluorescence assay (respectively Tm = 63.4, 68.4, and 73.6 °C). The switch 1 and N-terminal helix of Arf1-GDP displayed however intrinsic dynamics, consistent with the fact that these elements are displaced first in the exchange reaction (18, 19, 21). These internal motions may therefore prime Arf1-GDP for the initiating event of the exchange reaction.
Δ17Arf1-GDP can be considered as a mimic of membrane-associated Arf1-GDP, in which the truncation of its N-terminal helix is equivalent to the displacement of this helix as it binds to membranes in full-length myristoylated Arf1-GDP. This truncation unlocks the retracted conformation of the interswitch, making Arf1-GDP competent for the subsequent membrane-securing step (19). Accordingly, Δ17Arf1-GDP is readily activated by GDP/GTP exchange in solution, whereas full-length Arf1 cannot be activated under these conditions (reviewed in Ref. 35). However, how Arf1-GDP accommodates the toggle of the interswitch in the core of its central β-sheet while maintaining its folded structure has remained unexplained. The comparative analysis of internal dynamics between Δ17Arf1-GDP, Δ17Arf1-GTP, and Arf1-GDP provides for the first time some insight into this central event of Arf and Arf-related GTPases activation (reviewed in Ref. 14).
Altogether, our combined structural and dynamics NMR analysis of Arf1 provides novel insight into the allosteric propagation of information between the side of Arf1 that faces the membrane, and its opposite face that binds nucleotides and cellular partners. The localization of the millisecond range motions along the β-sheet down to the switch regions and the nucleotide-binding site reveals how the release of the N-terminal helix opens a “front-back” communication path across the protein. This communication path is blocked in the full-length protein. We can thus speculate that the combination of inter-strand motions evidenced by CPMG and H/D exchange experiments in the ms to seconds timescales altogether converge toward the opening of the interswitch domain through a lateral process that involve a melting/dissociation of the central β-strands. Inter-strand motions in the ms range trigger higher amplitude motions in the interswitch and switch 1 domains, that may finally drive the whole conformational change from the GDP- to the GTP-bound states orders of magnitude slowly (21, 22). The transient formation of more opened states shown through H/D exchange thus possibly favors the stabilization of the GTP form (Fig. 7).
Our results indicate how, in membrane-associated Arf1-GDP, the displacement of the N-terminal helix through its membrane anchoring renders Arf1-GDP “softer” in the vicinity of the interswitch, and reveal conformational sub-states in exchange at the millisecond timescale that prime the subsequent toggle of the interswitch. The interswitch may then use these acquired internal motions to toggle without disrupting the overall structure of Arf1.
Supplementary Material
Acknowledgments
We thank Bernard Guibert (LEBS) and Annie Moretto (ICSN) for technical help, Éric Jacquet and Naïma Nhiri (ICSN and IMAGIF) for thermofluor experiments, and Xavier Méniche (IBBMC, Orsay) for mass spectroscopy. We thank Hans Wienk for help at the NMR LSF (ELSF Utrecht).
This work was supported by grants from the Association pour la Recherche contre le Cancer (to V. B. and J. C.) by the CNRS, the Ministère de la Recherche, and the Institut de Chimie des Substances Naturelles (to V. B., E. G., and C. v.H.). This work was also supported by TGE RMN THC FR3050.

The on-line version of this article (available at http://www.jbc.org) contains supplemental Figs. S1–S6 and Table S1–S4.
- GTPase
- small GTP-binding protein
- HSQC
- heteronuclear single quantum coherence
- GEF
- guanine nucleotide exchange factor
- GAP
- GTPase-activating protein
- Arf
- ADP ribosylation factor
- CPMG
- Carr Purcell Meiboom Gill
- Δ17Arf1
- human Arf1 deleted of residues 1–17
- RDC
- residual dipolar coupling
- CSV
- chemical shift variation
- GTPγS
- guanosine 5′-3-O-(thio)triphosphate.
REFERENCES
- 1.Palmer A. G., 3rd. (2004) Chem. Rev. 104, 3623–3640 [DOI] [PubMed] [Google Scholar]
- 2.Krishna M. M., Hoang L., Lin Y., Englander S. W. (2004) Methods 34, 51–64 [DOI] [PubMed] [Google Scholar]
- 3.Boehr D. D., Dyson H. J., Wright P. E. (2006) Chem. Rev. 106, 3055–3079 [DOI] [PubMed] [Google Scholar]
- 4.Mittermaier A. K., Kay L. E. (2009) Trends Biochem. Sci. 34, 601–611 [DOI] [PubMed] [Google Scholar]
- 5.Tzeng S. R., Kalodimos C. G. (2009) Nature 462, 368–372 [DOI] [PubMed] [Google Scholar]
- 6.Bruschweiler S., Schanda P., Kloiber K., Brutscher B., Kontaxis G., Konrat R., Tollinger M. (2009) J. Am. Chem. Soc. 131, 3063–3068 [DOI] [PubMed] [Google Scholar]
- 7.Biou V., Cherfils J. (2004) Biochemistry 43, 6833–6840 [DOI] [PubMed] [Google Scholar]
- 8.Loh A. P., Guo W., Nicholson L. K., Oswald R. E. (1999) Biochemistry 38, 12547–12557 [DOI] [PubMed] [Google Scholar]
- 9.Adams P. D., Loh A. P., Oswald R. E. (2004) Biochemistry 43, 9968–9977 [DOI] [PubMed] [Google Scholar]
- 10.O'Connor C., Kovrigin E. L. (2008) Biochemistry 47, 10244–10246 [DOI] [PubMed] [Google Scholar]
- 11.Gasmi-Seabrook G. M., Marshall C. B., Cheung M., Kim B., Wang F., Jang Y. J., Mak T. W., Stambolic V., Ikura M. (2010) J. Biol. Chem. 285, 5137–5145 [DOI] [PMC free article] [PubMed] [Google Scholar]
- 12.Marshall C. B., Ho J., Buerger C., Plevin M. J., Li G. Y., Li Z., Ikura M., Stambolic V. (2009) Sci. Signal 2, ra3. [DOI] [PubMed] [Google Scholar]
- 13.D'Souza-Schorey C., Chavrier P. (2006) Nat. Rev. Mol. Cell Biol. 7, 347–358 [DOI] [PubMed] [Google Scholar]
- 14.Pasqualato S., Renault L., Cherfils J. (2002) EMBO Rep. 3, 1035–1041 [DOI] [PMC free article] [PubMed] [Google Scholar]
- 15.Amor J. C., Harrison D. H., Kahn R. A., Ringe D. (1994) Nature 372, 704–708 [DOI] [PubMed] [Google Scholar]
- 16.Greasley S. E., Jhoti H., Teahan C., Solari R., Fensome A., Thomas G. M., Cockcroft S., Bax B. (1995) Nat. Struct. Biol. 2, 797–806 [DOI] [PubMed] [Google Scholar]
- 17.Liu Y., Kahn R. A., Prestegard J. H. (2009) Structure 17, 79–87 [DOI] [PMC free article] [PubMed] [Google Scholar]
- 18.Antonny B., Beraud-Dufour S., Chardin P., Chabre M. (1997) Biochemistry 36, 4675–4684 [DOI] [PubMed] [Google Scholar]
- 19.Renault L., Guibert B., Cherfils J. (2003) Nature 426, 525–530 [DOI] [PubMed] [Google Scholar]
- 20.Mossessova E., Corpina R. A., Goldberg J. (2003) Mol. Cell 12, 1403–1411 [DOI] [PubMed] [Google Scholar]
- 21.Goldberg J. (1998) Cell 95, 237–248 [DOI] [PubMed] [Google Scholar]
- 22.Shiba T., Kawasaki M., Takatsu H., Nogi T., Matsugaki N., Igarashi N., Suzuki M., Kato R., Nakayama K., Wakatsuki S. (2003) Nat. Struct. Biol. 10, 386–393 [DOI] [PubMed] [Google Scholar]
- 23.Amor J. C., Seidel R. D., 3rd, Tian F., Kahn R. A., Prestegar J. H. (2002) J. Biomol. NMR 23, 253–254 [DOI] [PubMed] [Google Scholar]
- 24.Seidel R. D., 3rd, Amor J. C., Kahn R. A., Prestegard J. H. (2004) J. Biol. Chem. 279, 48307–48318 [DOI] [PubMed] [Google Scholar]
- 25.Gruschus J. M., Chen P. W., Luo R., Randazzo P. A. (2009) Structure 17, 2–4 [DOI] [PubMed] [Google Scholar]
- 26.Delaglio F., Grzesiek S., Vuister G. W., Zhu G., Pfeifer J., Bax A. (1995) J. Biomol. NMR 6, 277–293 [DOI] [PubMed] [Google Scholar]
- 27.Cornilescu G., Delaglio F., Bax A. (1999) J. Biomol. NMR 13, 289–302 [DOI] [PubMed] [Google Scholar]
- 28.Dosset P., Hus J. C., Blackledge M., Marion D. (2000) J. Biomol. NMR 16, 23–28 [DOI] [PubMed] [Google Scholar]
- 29.Hansen D. F., Vallurupalli P., Kay L. E. (2008) J. Phys. Chem. B 112, 5898–5904 [DOI] [PubMed] [Google Scholar]
- 30.Loria J. P., Rance M., Palmer A. G. (1999) J. Am. Chem. Soc. 121, 2331–2332 [Google Scholar]
- 31.van Tilborg P. J., Mulder F. A., de Backer M. M., Nair M., van Heerde E. C., Folkers G., van der Saag P. T., Karimi-Nejad Y., Boelens R., Kaptein R. (1999) Biochemistry 38, 1951–1956 [DOI] [PubMed] [Google Scholar]
- 32.Viaud J., Zeghouf M., Barelli H., Zeeh J. C., Padilla A., Guibert B., Chardin P., Royer C. A., Cherfils J., Chavanieu A. (2007) Proc. Natl. Acad. Sci. U.S.A. 104, 10370–10375 [DOI] [PMC free article] [PubMed] [Google Scholar]
- 33.Spoerner M., Nuehs A., Herrmann C., Steiner G., Kalbitzer H. R. (2007) FEBS J. 274, 1419–1433 [DOI] [PubMed] [Google Scholar]
- 34.Shen Y., Bax A. (2007) J. Biomol. NMR 38, 289–302 [DOI] [PubMed] [Google Scholar]
- 35.Pasqualato S., Renault L., Cherfils J. (2003) in The GDP/GTP Cycle of Arf Proteins, Structural and Biochemical Aspects, Kluwer Academic [Google Scholar]
- 36.Lipari G., Szabo A. (1982) J. Am. Chem. Soc. 104, 4559–4570 [Google Scholar]
Associated Data
This section collects any data citations, data availability statements, or supplementary materials included in this article.


