Abstract
Rsf-1 (HBXAP) has been reported as an amplified gene in human cancer, including the highly aggressive ovarian serous carcinoma. Rsf-1 protein interacts with SNF2H to form an ISWI chromatin remodeling complex, RSF. In this study, we investigated the functional role of Rsf-1 by observing phenotypes after expressing it in nontransformed cells. Acute expression of Rsf-1 resulted in DNA damage as evidenced by DNA strand breaks, nuclear γH2AX foci, and activation of the ATM-CHK2-p53-p21 pathway, leading to growth arrest and apoptosis. Deletion mutation and gene knockdown assays revealed that formation of a functional RSF complex with SNF2H was required for Rsf-1 to trigger DNA damage response (DDR). Gene knock-out of TP53 alleles, TP53 mutation, or treatment with an ATM inhibitor abolished up-regulation of p53 and p21 and prevented Rsf-1-induced growth arrest. Chronic induction of Rsf-1 expression resulted in chromosomal aberration and clonal selection for cells with c-myc amplification and CDKN2A/B deletion. Co-culture assays indicated Rsf-1-induced DDR as a selecting barrier that favored outgrowth of cell clones with a TP53 mutation. The above findings suggest that increased Rsf-1 expression and thus excessive RSF activity, which occurs in tumors harboring Rsf-1 amplification, can induce chromosomal instability likely through DDR.
Keywords: Chromatin Remodeling, Clonal Selection, DNA Damage, Oncogene, p53, Remodeling and Spacing Factor, Genome Instability, Hepatitis B Virus X Protein-associated Protein
Introduction
Chromatin remodeling is a fundamental process in several key biological activities such as nucleotide synthesis, transcription regulation, DNA repair, methylation, and recombination (1). This process is regulated by a group of nuclear protein complexes that assemble chromatin by sliding and spacing nucleosomes, allowing for accessibility of otherwise highly packaged DNA in nucleosomes to nuclear proteins, e.g. transcription factors, enhancers, repressors, and enzymes. This process is made possible by the ATPase subunit of the chromatin remodeling complex, which utilizes ATP hydrolysis to generate energy needed to alter the chromatin architecture at the nucleosomal level. Based on sequence homology of the ATPase subunit, three subfamilies have been defined in mammalian cells: the ISWI,3 SWI/SNF, and CHD/Mi-2 families (2, 3). Functional analyses suggested common chromatin remodeling mechanism shared by these three subfamilies, but the unique protein motif adjacent to the ATPase domain in each subfamily dictated different modes of gene regulation and subunit recruitment (4). Given the crucial roles of chromatin remodeling factors in biology, it comes as no surprise that defects in, or aberrant expression of, chromatin remodeling proteins are associated with various developmental disorders and cancer (5, 6).
Using digital karyotyping, we have identified a discrete amplicon at chromosome (ch) 11q13.5 in ovarian high grade serous carcinomas, a highly malignant neoplastic disease (7, 8). This amplicon was subsequently validated in two independent studies that profiled DNA copy number changes in ovarian carcinoma (8, 9). Aside from ovarian serous carcinoma, amplification at the ch11q13.5 region is detected in other types of neoplastic diseases: breast, bladder, esophageal, and head and neck cancers (10). The minimal ch11q13.5 amplicon contains 13 genes; among them, Rsf-1 (HBXAP, hepatitis B virus X protein-associated protein) showed the highest correlation between DNA and RNA copy number in ovarian cancer tissues (7) and was the only gene that contributed to drug resistance in ovarian cancer cells (11). We also observed that the amplification and overexpression of Rsf-1 independently correlated with worse clinical outcomes in ovarian serous carcinoma patients, indicating association of Rsf-1 with disease aggressiveness (7, 12).
Molecularly, Rsf-1 protein interacts with SNF2H through its DDT and PHD domains to form the remodeling and spacing factor (RSF) complex that belongs to the ISWI chromatin remodeling family (13–16). It has been shown that SNF2H possesses nucleosome-dependent ATPase activity, whereas Rsf-1 (HBXAP) functions as a histone chaperone. As with other ISWI chromatin remodeling complexes, RSF has been reported to participate in nucleosome assembly and chromatin remodeling in response to various growth signals and environmental cues (13–15). More recently, RSF has been shown to interact with centromere protein A (CENP-A) histone, suggesting critical roles of the RSF complex during DNA replication and segregation (17). Rsf-1 protein level correlated with that of SNF2H in human cancer tissues, and ectopic expression of Rsf-1 increased protein levels of SNF2H probably through formation of a stabilized RSF complex (16). Rsf-1 knockdown or disruption of RSF complex formation inhibited cell growth in OVCAR3 ovarian cancer cells, which harbor Rsf-1 amplification and thus express abundant endogenous Rsf-1, but not in other cancer cells without Rsf-1 amplification or overexpression (11, 16). These results strongly suggest that Rsf-1 amplification is critical in maintaining the survival and growth of ovarian cancer cells.
To further understand the biological functions of Rsf-1 during tumor development, we determined the effects by ectopic expression of Rsf-1 in nontransformed cells including ovarian surface epithelial cells and RK3E cells. Findings suggest that Rsf-1 overexpression, as occurs in tumor cells with Rsf-1 amplification, can be detrimental to cells by inducing DNA damage, resulting in growth arrest and apoptosis. Still, in the presence of mutated p53 signaling, cells can continue undergoing cell division despite DNA damage, promoting chromosomal instability as observed in cancer cells.
EXPERIMENTAL PROCEDURES
Establishment of Rsf-1-expressing Cell Models
To determine the effects of Rsf-1 expression, IOSE-80pc cells were transduced by the Rsf-1/V5 lentivirus (18) because the virus offered a more efficient system to deliver gene than transfection in this cell line. For the Rsf-1-inducible expression system, a full-length Rsf-1 gene and Rsf-1 deletion mutants tagged with V5 (C-terminal) were cloned into a Tet-off expression vector, pBI-EGFP (Clontech, Mountain View, CA). RK3E cells were transfected with a tTA (tetracycline-controlled transactivator) vector to generate RK3E-tTA cells. Inducible expression vectors were then introduced into the RK3E-tTA cells, and the stable transfectants were selected by hygromycin (Roche Diagnostics, Mannheim, Germany) and G418.
Cell Growth, Colony Formation, and Apoptosis Assays
Cells were grown in 96-well plates at a density of 3,000 cells per well. After overnight culture, the cells were washed with Dox-in (gene turned off) or Dox-free (gene turned on) medium. Cell number was measured at different times, based on fluorescence intensity of SYBR green I nucleic acid staining (Molecular Probes, Eugene, OR). Cell growth was monitored daily for 4 consecutive days. For colony formation assay, cells were seeded in 25-cm2 flasks at a density of 2,000 cells/flask with Dox-in or Dox-free medium. The colonies were counted after staining with crystal violet dye (Sigma) at day 10. To study possible involvement of ATM kinase in mediating Rsf-1-induced cell death, RK3E cells were treated with 100 nm or 200 nm CGK733 (Merck Biosciences; Darmstadt, Germany). Cells treated with equal concentration of dimethyl sulfoxide were used as controls. For apoptosis assay, apoptotic cells were detected by annexin V-FITC staining (BioVision, Mountain View, CA). Annexin V (+) cell percentage was calculated in at least 400 cells from different fields for each experiment. The data were expressed as mean ± S.D. from triplicates.
DNA Strand Break Assay
Quantification of DNA strand breaks was determined using a Comet assay kit (Trevigen, Inc., Gaithersburg, MD) (19). Rsf-1 expressing and nonexpressing cells were harvested in ice-cold PBS at a density of 1 × 10⁵ cells/ml. Cells treated with UV light at a sublethal dose were used as the positive control. Cells were mixed with LMAgarose at 1:10 ratio (v/v) and spread onto the CometSlide immediately. After gel solidification, slides were immersed in ice-cold lysis buffer provided by the kit for 45 min, followed by incubation in an alkaline solution provided by the kit at room temperature for one hour. Fragmented DNA strands were separated from nuclei by electrophoresis and detected by SYBR Green staining. Percentage of comet-like nuclei (with DNA strand breaks) was counted under fluorescent microscope from five randomly selected high power fields (40×) with each approximately containing 100 nuclei.
Immunofluorescence Staining
Rsf-1-transduced ovarian surface epithelium (OSE) cells were used to determine whether Rsf-1 expression resulted in genomic instability. At different time points, cells on chamber slides were fixed with paraformaldehyde and incubated with anti-phospho-CHK2 (pCHK2) antibody (clone ab38461; Abcam, Cambridge, MA) or anti-γH2AX antibody (clone ab11174; Abcam) for 2 h, and followed by rhodamin-conjugated anti-mouse or anti-rabbit antibody (Jackson ImmunoResearch Laboratories, West Grove, PA). Cell nuclei were counter stained with DAPI (Sigma).
G-banding Karyotyping and Abnormal Mitosis Counting
To assess whether Rsf-1 expression resulted in an increase in chromosomal aberrations, we used an Rsf-1-inducible RK3E cell model in which Rsf-1 was repeatedly turned on for three passages then turned off for three passages to avoid acute growth arrest. After 10 cycles of repeated induction, cells were subjected to G-banding karyotyping, array CGH, and evaluation for abnormal mitotic figures. For G-banding karyotyping, cells were synchronized with 10 μg/ml colcemid (Invitrogen) for 3 h. Cells were then trypsinized and fixed with ice-cold fixation solution (methanol/glacial acetate = 3:1; v/v). After three washes with fixation buffer, the cell suspension was spotted onto slides, aged at 65 °C for 5 h, and were submitted to standard procedures of G-banding with trypsin. Images of 10 metaphases in which there was minimal chromosome overlap, long chromosome length, little or no cytoplasm, and high banding resolution were selected for detailed analysis. Abnormal mitotic figures including spindle pole number abnormality, anaphase bridges, and micronuclei were counted in ∼400 randomly selected nuclei and the percentage calculated.
Array Comparative Genomic Hybridization (CGH)
A genome-wide oligonucleotide array (Rat genome CGH microarray 244A; Agilent Technologies, Palo Alto, CA) was used for array-CGH analysis. Genomic DNA fragmentation, labeling, and array hybridization were performed according to the standard protocol (version 4) provided by Agilent Technologies. DNA was isolated from Rsf-1 turned on cells as the experimental genome and those isolated from Rsf-1 turned off or control cells of the same batch as reference genome. The hybridized arrays were scanned with an Agilent G2565BA DNA microarray scanner and analyzed by Agilent Feature Extraction software (version 8.1.1). Another custom analytical software package, Agilent CGH Analytics (version 3.4) was also used for subsequent data analysis. Locations of the copy number aberrations were calculated using the Z-score statistical algorithm with a moving average window of 5 megabases. The Z-score threshold was set at 2.5 to make an amplification or deletion call. Based on these settings, the aberration score was generated automatically for each copy number altered loci.
Gene Knockdown Using siRNA
SMART pools of siRNA against SNF2H and p21 were purchased from Dharmacon RNAi Technologies. A scramble siRNA (catalogue no. D-001210-02-05) was also purchased from Dharmacon as the off-target control. For gene knockdown, cells were treated with siRNA at a final concentration of 200 nm using oligofectamine (Invitrogen). For Rsf-1-inducible RK3E cells, treated cells were washed with Dox-free (gene turned on) or Dox-in (gene turned off) medium 8 h after transfection. Cell growth assay was performed for 4 days under Dox-free or Dox-in medium to evaluate whether SNF2H or p21 knockdown could affect Rsf-1-induced cell growth arrest in RK3E cells.
RESULTS
Rsf-1 Expression Induces Growth Arrest in Nontransformed Cells
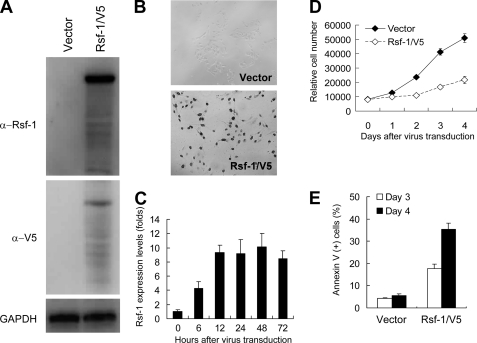
We demonstrated earlier that increasing Rsf-1 expression in ovarian cancer cells promotes tumor xenograft growth in mice (16). Yet, acute effects of Rsf-1 overexpression on nontransformed cells are not known. In this study, we selected an OSE cell line IOSE-80pc, a benign cellular counterpart of ovarian carcinoma (18), and a Tet-off Rsf-1 inducible system in RK3E cells as models. The RK3E cell line was used because it has been widely used to assess transformational ability of potential oncogenes (20–25). First, we ectopically expressed Rsf-1 in IOSE-80pc cells using an Rsf-1-expressing lentivirus, with Rsf-1 expression detected by Western blot analysis and by immunostaining (Fig. 1, A and B). A consistent high expressing level of Rsf-1 was confirmed by real-time quantitative PCR 12 h after virus transduction (Fig. 1C). The IOSE-80pc cell number was significantly reduced 4 days after transduction by Rsf-1/V5 lentivirus as compared with those transduced by control (vector only) virus (Fig. 1D). Apoptotic cells were increased in Rsf-1-expressing cells at days 3 and 4 (Fig. 1E). For RK3E cells, we induced Rsf-1 expression by removing doxycyclin from culture medium. Based on Western blot analysis, we detected Rsf-1 protein expression in Rsf-1 Tet-off RK3E clones as early as 6 h after induction (supplemental Fig. S1A). As compared with noninduced control cells, Rsf-1-induced clones grew more slowly in culture and exhibited increased apoptotic activity when cells were incubated in a low serum condition (0.5% FBS) based on annexin V staining (supplemental Fig. S1C). As compared with control cells, no evidence of increased number of senescent cells was observed in Rsf-1-overexpressing cells (data not shown).
FIGURE 1.
Rsf-1 expression induces growth arrest in non-transformed OSE cells. IOSE-80pc cells were used for studying the biological effects of Rsf-1 overexpression. A, Western blot analysis shows Rsf-1-V5 protein band in treated cells 48 h after virus transduction by using anti-Rsf-1 and anti-V5 antibodies. B, immunocytochemistry demonstrates nuclear Rsf-1-V5 immunoreactivity in almost all treated cells 48 h after virus transduction. Cells treated with empty vector virus were used as controls. C, mRNA expression levels of Rsf-1 at different time points were measured by real-time quantitative PCR. D, cell growth analysis demonstrated a growth arrest in Rsf-1/V5 virus-transduced IOSE-80pc cells as compared with control virus-transduced cells. E, the percentage of annexin V-stained apoptotic cells increased in Rsf-1 virus-transduced cells as compared with control virus-transduced cells at days 3 and 4 after virus transduction (p < 0.001). Error bar: one standard error.
Rsf-1 Induces DNA Strand Breaks and Activates DDRs in Dividing Nontransformed Cells
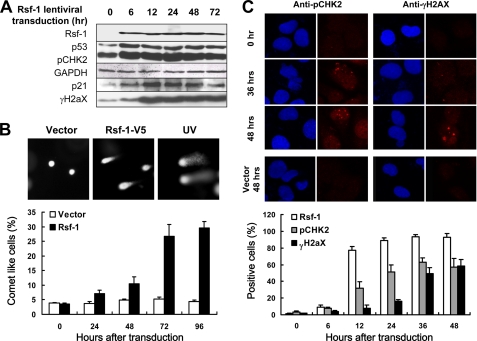
It has been established that certain oncogenes can induce cellular senescence and cell death in precancerous tissues by induction of DNA replication stress and activation of DNA damage responses (DDRs) (26–28). As our previous studies support an oncogenic potential of Rsf-1 (7, 11, 12, 16), it is likely that Rsf-1 induction can also cause DDRs and subsequent growth arrest in those nontransformed cells. To investigate this possibility, we measured protein levels of γH2AX, pCHK2, p53, and p21, all of which are involved in the DDR pathway (29, 30), in both IOSE-80pc cells and RK3E Rsf-1 inducible cells. As shown in Fig. 2A, Western blot analysis demonstrated increased protein levels not only of Rsf-1, but also of γH2AX, pCHK2, p53 and p21 6 h after Rsf-1 lentiviral transduction. Similarly, the same results in the expression patterns of Rsf-1, γH2AX, pCHK2, p53, and p21 were also observed in RK3E cells upon Rsf-1 induction (supplemental Fig. S2A). The above findings suggest DNA strand breaks induced by Rsf-1 expression. To determine whether this was the case, we analyzed DNA strand breaks in IOSE-80pc cells transduced by Rsf-1/V5 and compared with cells transduced by empty lentivirus, as well as in Rsf-1-induced and noninduced RK3E cells. Upon electrophoresis, DNA with strand breaks migrated out of nuclei forming a comet tail-like structure, whereas nondamaged DNA remained within nuclei. Fig. 2B and supplemental Fig. S2B show a higher percentage of comet-like cells detected in Rsf-1-expressing IOSE-80pc cells and RK3E cells than in their control groups as early as 24 h after Rsf-1 expression. At all time points, the percentage of comet-like cells was significantly higher in Rsf-1-expressing cells than in controls. Immunofluorescence staining also demonstrated concomitant γH2AX and pCHK2 foci in nuclei of IOSE-80pc cells after Rsf-1 virus transduction (Fig. 2C) and in nuclei of RK3E cells after Rsf-1 induction (supplemental Fig. S2C).
FIGURE 2.
Rsf-1 induces DNA strand breaks and activates DDR. IOSE-80pc cells were used for studying DNA damage response (DDR) induced by Rsf-1 overexpression. A, Western blot analysis shows that Rsf-1 overexpression in ovarian surface epithelial cells is associated with increased protein levels of phosphorylated γ-histone 2AX (γH2AX), phosphorylated check point kinase-2 (pCHK2), p53, and p21. GAPDH serves as a loading control. B, upon gel electrophoresis, DNA with strand breaks migrated out of nuclei forming a comet tail-like structure, whereas the nondamaged DNA remained stationary within the nucleus. At all time points, the percentage of comet-like cells was significantly higher in the Rsf-1-overexpressing group than in the control group (p < 0.001). UV-irradiated cells serve as the positive control. C, immunofluorescence staining demonstrates punctuate immunofluorescence (foci) of both γH2AX and pCHK2 in cells at 36 and 48 h after Rsf-1 transduction. The percentages of Rsf-1, γH2AX, and pCHK2-positive cells at different time points were counted and shown in the lower panel. Error bar: one standard error.
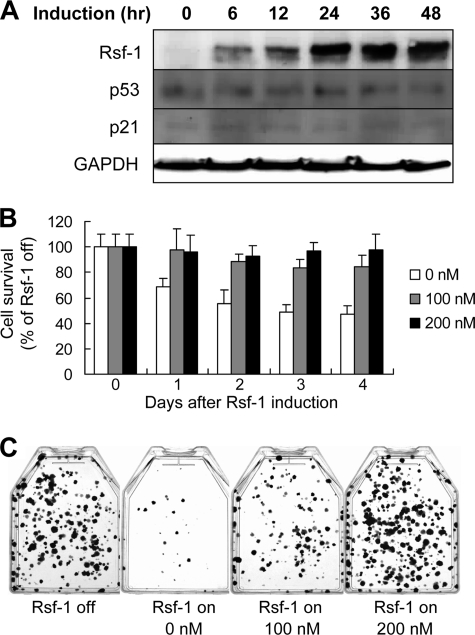
Because the DDR pathway is initiated by ATM/ATR (Ataxia-Telangiectasia and Rad3 related protein) activation, we further determined whether the growth inhibitory effects induced by Rsf-1 overexpression could be abolished by ATM inactivation. We treated RK3E Rsf-1-inducible cells with an ATM kinase inhibitor, CGK733. Western blotting showed expression levels of p53 and p21, the key effectors of DDRs (29, 30), were not altered despite Rsf-1 was turned on (Fig. 3A). Based on growth curve analysis and colony numbers, we found that the inhibitor was able to reverse growth suppression effect of Rsf-1 (Fig. 3, B and C). As a positive control, Rsf-1 knockdown by shRNA could rescue cells from cell growth inhibition as a result of Rsf-1 induction (supplemental Fig. S3). The above findings suggested ATM and p53 signaling as responsible for Rsf-1-induced growth suppression.
FIGURE 3.
ATM inactivation reverses Rsf-1-induced cell growth arrest. ATM inhibitor was added when the Rsf-1 gene was turned on. A, Western blot analysis shows that the ATM inhibitor CGK733 (100 nm) abolishes Rsf-1-induced up-regulation of p53 and p21 proteins. Of note, the p21 protein level was very low but detectable. B, growth curves analysis demonstrates that CGK733 increases cell survival rate after the Rsf-1 gene was turned on. Cells without treatment were used as controls. The survival rate was measured based on the ratio of cell numbers when Rsf-1 on versus Rsf-1 off. C, CGK733 at 100 and 200 nm rescued Rsf-1-induced growth suppression as the colony number increased as compared with 0 nm (p < 0.001). Error bar: one standard error.
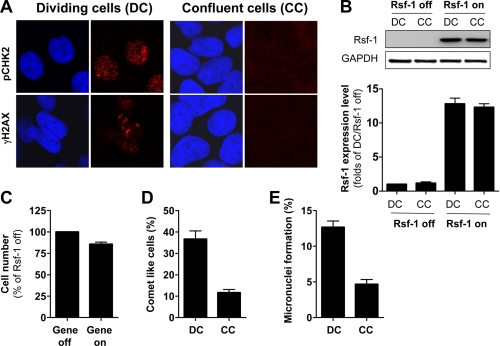
It has been shown that DDR induced by excessive oncogene products is always coupled with DNA replication (28). Using Rsf-1-inducible RK3E cells, we compared the ability to induce cell death, DNA strand breaks, and micronuclei formation between dividing and confluent cells after Rsf-1 expression. Fig. 4A depicts confluent cells (CC) with weaker pCHK2 and γH2AX staining after Rsf-1 turned on, as compared with the staining patterns in dividing cells (DC). Western blot and QPCR analyses confirmed equal expressing Rsf-1 levels between DC and CC cells, excluding possible effects caused by uneven Rsf-1 expressing levels (Fig. 4B). These results suggest reduction of Rsf-1-induced DDRs when cells are confluent. Fig. 4, C–E, demonstrates remarkable effects of Rsf-1 overexpression on cell survival, DNA break induction, and micronuclei formation, respectively, in DC cells as compared with CC cells. Our results indicated Rsf-1-induced DDRs occurring far more often in dividing cells than in confluent cells, suggesting that DNA replication is required for Rsf-1-induced DDR.
FIGURE 4.
Comparison of Rsf-1-induced effects on DC versus CC. A, after Rsf-1 induction, immunofluorescence staining demonstrates formation of both γH2AX and pCHK2 foci in cells undergoing cell division, but not in confluent non-dividing cells. B, Western blot analysis and quantitative real-time PCR were performed to compare the Rsf-1-expressing levels in DC and CC. C, cell growth assay demonstrates less cell death in confluent cells after Rsf-1 induction. Less DNA breaks (D) and less micronuclei (E) were found when Rsf-1 was turned on in confluent cells. Error bar: one standard error.
Formation of Functional RSF Complex Is Required for Rsf-1 to Induce Growth Arrest
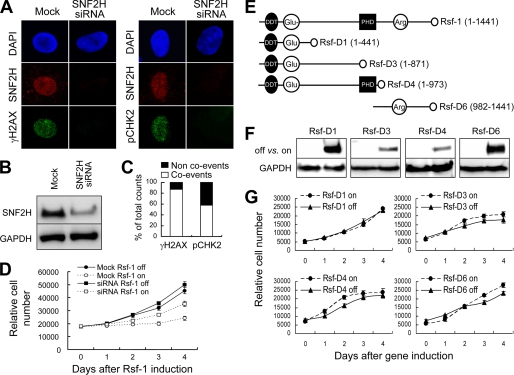
Based on the data of anti-Rsf-1 co-immunoprecipitation, Rsf-1 was predominantly associated with SNF2H to form an RSF complex in ovarian cancer cells (16), as well as in RK3E cells (supplemental Fig. S1B). Here, we asked whether this interaction is required for Rsf-1-induced growth arrest. SNF2H siRNA was used to suppress SNF2H expression and led to reduced expression levels of γH2AX and pCHK2 (Fig. 5A). Western blot analysis revealed the effectiveness of siRNA to down-regulate the SNF2H expression in treated cells (Fig. 5B). We found >85% of cells negative for γH2AX, 57% negative for pCHK2 after SNF2H knockdown (Fig. 5C). Notably, SNF2H knockdown partially rescued Rsf-1-induced growth arrest (Fig. 5D), indicating that the interaction between Rsf-1 with SNF2H is required for growth arrest. A scramble siRNA did not cause similar effects as shown in SNF2H siRNAs (supplemental Fig. S4).
FIGURE 5.
Interaction of the full-length Rsf-1 and SNF2H is required for Rsf-1 to induce growth arrest in nontransformed RK3E cells. A, most SNF2H knockdown cells exhibited undetectable staining of pCHK2 and γH2AX. B, Western blot analysis shows an efficient reduction of SNF2H protein by a SNF2H-specific siRNA pool. C, co-events were those cells showing down-regulation in both SNF2H and pCHK2 or both SNF2H and γH2AX. D, growth curve analyses in Rsf-1 inducible RK3E cells transfected with anti-SNF2H siRNA or buffer alone (mock control). E, schematic presentation of the full-length Rsf-1 and its different deletion mutants (D1, D3, D4, and D6). F, Western blot analysis showed expression of deletion mutants in RK3E cells 48 h after induction. G, growth curve analyses demonstrate no significant effects of deletion mutants on cellular proliferation as compared with the full-length Rsf-1. Error bar: one standard error.
Our previous study also demonstrated that Rsf-1/SNF2H interaction was mediated through the DDT and PHD domains on Rsf-1 (16). We determined whether the SNF2H binding motif in Rsf-1 containing both DDT and PHD domains was sufficient to induce growth arrest. To this end, we generated RK3E clones with a Tet-off inducible expression system for several Rsf-1 deletion mutants including Rsf-D1 (1–441 amino acids), Rsf-D3 (1–871 amino acids), D4 (1–973 amino acids) and D6 (982–1441 amino acids) (Fig. 5, E and F) (16). Of note, Rsf-D4 represented the minimal fragment of Rsf-1 that interacted with SNF2H. Interestingly, we did not observe significant growth inhibitory or apoptosis- enhancing effect in all clones expressing these deletion constructs, including the Rsf-D4 (Fig. 5G). This observation suggested that both the full-length Rsf-1 and SNF2H were required to form a functional RSF complex responsible for the growth suppression effects.
Chronic Rsf-1 Induction Results in Chromosomal Instability
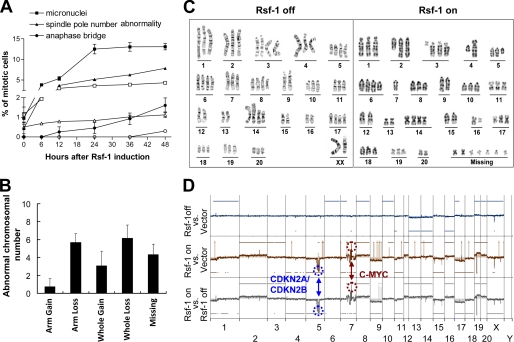
DNA damage in excess of repair capacity has been shown to contribute to genomic instability and provide a mixture of genetically heterogeneous clones for Darwinian selection, thus propelling tumor development (26). To investigate the prolonged effect of Rsf-1 induction and assess its role in a biological context in nontransformed cells, we turned on and off the Rsf-1 expression periodically to prevent acute growth arrest and apoptosis. Here, we determined whether or not genomic alterations were increased in Rsf-1-inducible RK3E cells. The level of chromosomal aberration was determined by the percentage of abnormal mitosis, karyotypic aberration, and DNA copy number changes by comparing the Rsf-1-expressing cells to the control cells. First, we found that Rsf-1 induction increased the percentage of cells with abnormal mitoses including increased numbers of micronuclei, increased numbers of anaphase bridges, and increased numbers of mitotic spindle poles (Fig. 6A). Second, we found that Rsf-1 expression promoted karyotypic aberrations including gain and loss of whole and partial chromosomal arms and gain of aberrant chromosomes that could not be assigned to specific chromosomes (Fig. 6, B and C). To identify genome-wide alterations associated with Rsf-1 expression, we performed array-CGH and compared profiles among Rsf-1-induced, Rsf-1-noninduced, and mock-induced (vector alone) RK3E cells (Fig. 6D). There was no difference in DNA copy number changes between Rsf-1 noninduced cells and the mock control. By contrast, clonal amplifications and deletions in discrete regions were detected in Rsf-1-induced cells as compared with either Rsf-1-noninduced or mock control cells. The most pronounced changes included amplification at ch7q31 to ch7q33 (position: 94, 580, 952–104, 649, 976), which harbors c-myc and homozygous deletion at ch5q31 to ch5q34 (position: 108, 138, 927–130, 524, 001), which contains CDKN2A/B.
FIGURE 6.
Chronic Rsf-1 induction leads to chromosomal abnormality. A, the frequency of abnormal mitoses including micronuclei, abnormal spindle pole number, and anaphase bridge increases in the Rsf-1-induced RK3E cells (filled symbols) as compared with noninduced controls (open symbols) at different time points. B, karyotypic analysis demonstrates different types of gross karyotypic abnormality in Rsf-1 induced cells. C, examples of karyotypes in Rsf-1-induced (Rsf-1 on) and noninduced (Rsf-1 off) cells. D, array CGH showed clonal DNA copy number alterations including deletion in ch5, ch7, and ch9, and amplification in ch7 in RK3E cells after Rsf-1 induction, whereas Rsf-1-noninduced and mock-induced RK3E (vector-only control) cells displayed no such changes. Error bar: one standard error.
Inactivation of p53 Signaling Reverses Growth Inhibitory Effects of Rsf-1
Among genes in the DDR pathway, TP53 was frequently found mutated (>80%) in high grade ovarian serous carcinoma (31). These results suggest a critical role of p53 involved in the molecular check point for Rsf-1-induced DNA damage and subsequent DDR. Thus, if TP53 mutations occur at initiation stages of ovarian cancer (32), such a genetic event would provide survival benefits to abolish oncogene-induced growth suppression/senescence and allow further accumulation of genetic alterations. To test this hypothesis, we used two approaches to study the impacts of TP53 status on Rsf-1 functions. First, when introduced to express a mutant p53 (R175H), Rsf-1-expressing RK3E cells were found able to continue proliferating without undergoing apoptosis (supplemental Fig. S1D). Second, we ectopically expressed Rsf-1 in a mouse embryonic fibroblast (MEF) system, allowing us to explore Rsf-1 biofunctions under different genetic backgrounds (MEFp53+/+, MEFp53−/−, and MEFARF−/−). Similar to RK3E cells, MEFp53+/+ responded to Rsf-1 expression by suppressing cell growth after 2 days (supplemental Fig. S5A). In contrast, MEFp53−/− (TP53-null) and MEFARF−/− (ARF-null) cells did not show significant growth inhibition after Rsf-1 retrovirus transduction (supplemental Fig. S5, B and C).
TP53 Mutations Precede Rsf-1 Overexpression
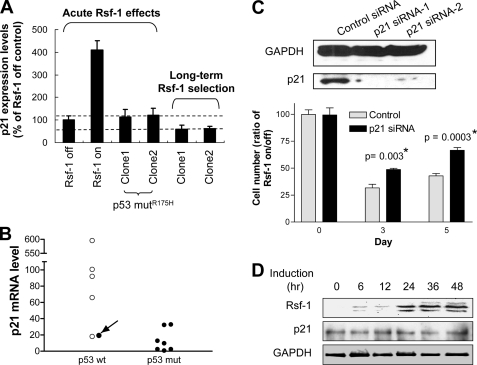
The TP53 status after chronic Rsf-1 induction (in Fig. 6) was also checked by direct sequencing. Our data indicated no mutation found in TP53 sequences (data not shown). However, as shown in Fig. 6D, chronic Rsf-1 induction resulted in genetic deletion of CDKN2A/2B (ARF/INK) loci, which can subsequently suppress p53-p21 signaling (33, 34). Fig. 7A showed the expression levels of p21 in RK3E cells under acute or long term Rsf-1 induction. Acute Rsf-1 overexpression was associated with a 4-fold increase in mRNA level of p21 in RK3E cells. However, failure of p21 induction was found in selected cell clones after long term Rsf-1 induction probably due to ARF inactivation. Similar finding was verified in clinical samples (Fig. 7B). A case harboring wild type p53 showed a high Rsf-1-expressing level but a very low p21 levels, which was similar to that in the cases with mutant p53. Fig. 7C indicates that p21 siRNA effectively reduced p21 protein expression and partially rescued RK3E cells from Rsf-1-induced growth inhibitory effect. Interestingly, introducing a p53 mutant (R175H) into RK3E cells could significantly reduce p21 expression after acute Rsf-1 induction (Fig. 7, A and D).
FIGURE 7.
Rsf-1-induced cell growth arrest involves the p53-p21 pathway. A, QPCR was performed to determine the change in expression level of p21 in nontransformed RK3E cells after Rsf-1 induction. B, QPCR shows the relative p21 transcript levels in 13 ovarian cancer tissues. Cases with high level of Rsf-1 expression (staining score >2) (7, 12) are labeled with filled circles, and specimens with lower Rsf-1 level (score ≤2) are indicated with open circles. The case of interest with wild-type TP53 sequences (arrow) has a similar low level of p21 mRNA to those with TP53 mutations. C, Western blot analysis shows the efficiency of p21 siRNAs in reducing p21 protein expression 48 h after siRNA transfection. siRNA against luciferase was used as the control. Rsf-1-inducible cells treated with control or p21 siRNAs were analyzed for cell growth under Rsf-1 turned-on or -off condition. Cell number of each treatment was monitored and presented as ratios of Rsf-1 on to Rsf-1 off at days 3 and 5. D, Western blot analysis demonstrates that Rsf-1 induction fails to elevate p21 expression levels in RK3E cells transfected with the mutant p53 (R175H) vector. Error bar: one standard error.
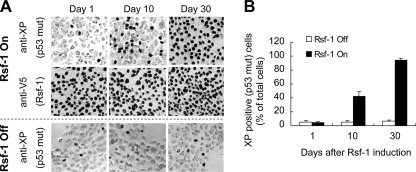
Although long term Rsf-1 induction did not select p53 mutant clones, the above findings suggest survival advantages of TP53 mutation for Rsf-1-overexpressing cells. To test this possibility, we co-cultured RK3E cells expressing mutant p53 (R175H) with cells expressing wild type p53 (1:25 ratio) under a low serum (0.5%) condition. When the Rsf-1 gene was turned off, all the cells either with wild type or mutant p53 grew with a similar ratio after 30 days (Fig. 8, A and B). However, Rsf-1 induction resulted in selective preference for cells with mutant p53, which became the dominant population after Rsf-1 induction for 30 days (Fig. 8, A and B). Our study supports the view that loss of p53 function is a prerequisite for Rsf-1 to promote tumor progression.
FIGURE 8.
TP53 mutation confers a selective growth advantage for Rsf-1-overexpressing RK3E cells. A, Rsf-1-expressing RK3E cells, which carry mutant (R175H) and wild type p53, were mixed at a ratio of 1:25 and grown in low serum (0.5%) medium for 30 days. The diffuse Rsf-1 expression was demonstrated by immunostaining for V5. Cells with p53 mutant in the mixed culture were stained with an anti-Xpress (XP) antibody that only recognizes mutant p53 tagged with an XP epitope. A mixed culture under Rsf-1 gene off was used as the control. B, the population of p53 mutant cells in the mixed culture was measured at indicated time points by counting XP-positive cells. Error bar: one standard error.
DISCUSSION
Remodeling chromatin structure is essential for several critical nuclear functions, and aberrant activity in chromatin remodeling emerges as a contributor to tumor development. Our previous studies suggested the clinical significance and essential role of Rsf-1 for cell survival in ovarian cancer. Here, we investigated the biological effects of Rsf-1 on nontumorigenic cells and demonstrated that Rsf-1 expression resulted in chromosomal aberration through DNA damage response. We found Rsf-1 expression associated with growth arrest in cells unless they harbored mutant p53, suggesting TP53 mutation as a prerequisite for Rsf-1 to promote tumor progression. On the other hand, ectopic Rsf-1 expression in cells expressing wild-type p53 resulted in DNA strand breaks and subsequent activation of the ATM-pCHK2-p53-p21 DDR pathway, followed by growth inhibition and apoptosis. Introduction of mutant p53 or ATM inhibitor abrogated Rsf-1-induced cell growth arrest. We further proved that excessive Rsf-1 protein enhanced chromosomal instability, probably as a result of Rsf-1-induced DNA strand breaks. These findings may provide new insight into the role of ISWI chromatin remodeling in cancer.
Observations made in this study have several biological implications. Initiating DDR response by Rsf-1 overexpression is unique in chromatin remodeling complexes reported to date, a finding similar to observations made in nontransformed cells after ectopic expression of certain oncogenes (27, 35, 36). Because the DDR pathway could be activated in the absence of actual DNA damage (37), it may be that higher level of Rsf-1, as occurs in Rsf-1-amplified cancer cells, may trigger a false signal as if DNA damage had occurred. Using cell DNA electrophoresis assay, we clearly showed that Rsf-1 induction, similar to UV irradiation, caused DNA strand breaks in chromosomally stable OSE and RK3E cells. The mechanism by which excessive amounts of Rsf-1 proteins contribute to DNA strand breaks is intriguing. Rsf-1-induced DDR depends on SNF2H, suggesting formation of the Rsf-1·SNF2H (RSF) complex and its functional activity, are essential to mediate this effect. As Rsf-D4 was not sufficient to trigger cell growth arrest, other proteins binding to the C-terminal of Rsf-1 may likely contribute to Rsf-1-induced DDR. For example, several proteins involved in cancer development were found to form functional complexes with chromatin remodeling factors, such as BRCA1 in the SWI·SNF complex during breast cancer development (38). It is therefore interesting to further study whether Rsf-1 forms functional complexes with other oncoproteins to promote tumor progression.
Paradoxically, ATP-dependent chromatin remodeling complexes have been demonstrated to play a critical role in repair of DNA double-strand breaks. These complexes are recruited to DNA-damaged sites and are directly involved in both homologous recombination and nonhomologous end-joining repair (39). More specifically, certain chromatin-remodeling complexes function by exchanging histone dimer pairs within nucleosomes, hence reshaping the landscape with histones bearing modifications, which, in turn, serves as a molecular “bar code” to recruit specific nuclear proteins for DNA damage repair (2, 40). It can be envisioned that the increased Rsf-1 protein level accelerates or stabilizes the formation of RSF chromatin remodeling complex. Although an appropriate level of chromatin remodeling activity is essential for DNA repair, excessive RSF chromatin remodeling complexes could directly or indirectly compromise the repair system leading to cumulative DNA strand breaks. This view is supported by previous reports showing that overexpression of Rad51 recombinase, essential for homologous recombination and repair of DNA double-strand breaks, leads to DNA double-strand breaks and chromosomal instability as evidenced by exaggerated recombination events including aneuploidy, chromosomal translocations, and multiple chromosomal rearrangements (41, 42). As DNA damage frequently occurs in cancer cells, probably due to enhanced oxidative stress, Rsf-1 overexpression may compromise DNA repair efficiency and subsequently lead to unrepaired DNA damage.
The above represents our favored view, but alternative mechanisms should also be pointed out. Besides Rsf-1, SNF2H interacts with several other cellular proteins, and the SNF2H containing ISWI complexes are known to have diverse cellular functions including DNA repair (2, 43). Thus, excessive Rsf-1 proteins may sequester SNF2H and alter subcellular distribution and partnership of SNF2H (16). These events may compromise formation of other SNF2H containing chromatin remodeling complexes involving DNA repair. Indeed, it has been reported that inhibition of expression of SNF2 led to activation of DNA damage response pathway, growth inhibition, and cell cycle G2/M arrest (44), a phenotype similar to that induced by ectopic expression of Rsf-1. Another study also indicated that interrupting the formation of the YY1·INO80 chromatin remodeling complex, a member of Snf2p family with DNA repair activity, resulted in loss of DNA repair activity and induced genomic instability in MEF cells (45).
Current results imply that a mechanism has evolved to protect normal cells from exaggerated chromatin remodeling and subsequent DNA damage in response to Rsf-1 overexpression. How do tumor cells overcome growth inhibitory effect arising from Rsf-1 amplification? As occurs in oncogenic stress, increased p53 levels due to the ATM-pCHK2-p53-p21 pathway activation lead to cell growth arrest at G1 or G2/M and/or to apoptosis (46, 47). This negative selection pressure favors clonal outgrowth of tumor cells with defective p53. Consistent with this view, our recent study has shown that TP53 mutation may likely precede Rsf-1 gene up-regulation in development of ovarian cancer (48). Moreover, our results demonstrate that introducing a mutant TP53 gene into TP53wt cells, or knock-out of TP53 alleles, rescues cells from Rsf-1-induced growth arrest. Collectively, these results indicate that inactivation of p53 abolishes the checkpoint governed by the ATM-p53 pathway and allows cells to continue proliferating despite the presence of DNA damage. Such unchecked DNA damage is associated with accumulation of chromosomal aberrations in dividing cells, creating a repertoire of genetically heterogeneous tumor cell species, some of which further evolve under host selection pressures leading to clonal outgrowth of tumor cells with specific genetic changes. To this end, we found that overexpression of Rsf-1 promoted chromosomal instability as evidenced by increased karyotypic abnormalities and DNA copy number alterations in otherwise chromosomally stable cells. Our data also demonstrated that long term Rsf-1 induction enriched cells clones with low p21 expression (Fig. 7) or TP53 mutations (Fig. 8). Chromosomal instability has been known as a hallmark of neoplastic disease; its causal roles in tumor development can be demonstrated in certain types of cancer (49). Our finding of Rsf-1 induction in nontransformed cells associated with c-myc amplification and CDKN2A/2B deletion argues that such clonal selection exists in our experimental system because both molecular genetic events are frequently detected in human carcinomas.
In summary, the current study demonstrates the biological effects of Rsf-1 overexpression in nontransformed cells. Excessive Rsf-1 proteins and presumably increased RSF chromatin remodeling activity induce DNA strand breaks, activate the ATM/p53-dependent DDRs, and lead to growth arrest and apoptosis in cells with wild-type p53. Defective p53 as present in the great majority of ovarian serous carcinomas lifts the p53 DNA damage checkpoint, allowing tumor cells to proliferate in the presence of DNA strand breaks, resulting in chromosomal aberrations. Our findings suggest an alternative mechanism in developing chromosomal instability in ovarian tumor cells and provide a new avenue for future studies aimed at elucidating the roles of chromatin remodeling in cancer.
Supplementary Material
Acknowledgments
We thank Dr. T. L. Mao and Dr. A. Ayhan for assistance with the TP53 sequencing analysis, David Chu for technical assistance, and Dr. J. Y. Chen (National Health Research Institute, Taiwan) for critical suggestions.
This work was supported, in whole or in part, by NCI, National Institutes of Health Grants RO1CA129080 and RO1CA103937. This work was also supported by Johns Hopkins-China Medical University Research Collaboration Fund (DMR-98-104) and National Science Council Grant NSC 98-2320-B-039-033-MY3 (Taiwan).

The on-line version of this article (available at http://www.jbc.org) contains supplemental “Experimental Procedures,” Figs. S1–S5, and additional references.
- ISWI
- imitation switch
- RSF
- remodeling and spacing factor
- OSE
- ovarian surface epithelium
- DDR
- DNA damage response
- CC
- confluent cells
- DC
- dividing cells
- QPCR
- quantitative real-time PCR
- MEF
- mouse embryonic fibroblast
- pCHK2
- phosphorylated check point kinase-2
- ATM
- ataxia-telangiectasia mutated gene
- CGH
- comparative genomic hybridization.
REFERENCES
- 1.Ho L., Crabtree G. R. (2010) Nature 463, 474–484 [DOI] [PMC free article] [PubMed] [Google Scholar]
- 2.Wang G. G., Allis C. D., Chi P. (2007) Trends Mol. Med. 13, 373–380 [DOI] [PMC free article] [PubMed] [Google Scholar]
- 3.Vignali M., Hassan A. H., Neely K. E., Workman J. L. (2000) Mol. Cell Biol. 20, 1899–1910 [DOI] [PMC free article] [PubMed] [Google Scholar]
- 4.Boyer L. A., Logie C., Bonte E., Becker P. B., Wade P. A., Wolffe A. P., Wu C., Imbalzano A. N., Peterson C. L. (2000) J. Biol. Chem. 275, 18864–18870 [DOI] [PubMed] [Google Scholar]
- 5.Wolffe A. P. (2001) Oncogene 20, 2988–2990 [DOI] [PubMed] [Google Scholar]
- 6.Lafon-Hughes L., Di Tomaso M. V., Méndez-Acuña L., Martínez-López W. (2008) Mutat. Res. 658, 191–214 [DOI] [PubMed] [Google Scholar]
- 7.Shih Ie M., Sheu J. J., Santillan A., Nakayama K., Yen M. J., Bristow R. E., Vang R., Parmigiani G., Kurman R. J., Trope C. G., Davidson B., Wang T. L. (2005) Proc. Natl. Acad. Sci. U.S.A. 102, 14004–14009 [DOI] [PMC free article] [PubMed] [Google Scholar]
- 8.Nakayama K., Nakayama N., Jinawath N., Salani R., Kurman R. J., Shih Ie, M., Wang T. L. (2007) Int. J. Cancer 120, 2613–2617 [DOI] [PubMed] [Google Scholar]
- 9.Brown L. A., Kalloger S. E., Miller M. A., Shih Ie M., McKinney S. E., Santos J. L., Swenerton K., Spellman P. T., Gray J., Gilks C. B., Huntsman D. G. (2008) Genes Chromosomes Cancer 47, 481–489 [DOI] [PubMed] [Google Scholar]
- 10.Schwab M. (1998) Bioessays 20, 473–479 [DOI] [PubMed] [Google Scholar]
- 11.Choi J. H., Sheu J. J., Guan B., Jinawath N., Markowski P., Wang T. L., Shih Ie M. (2009) Cancer Res. 69, 1407–1415 [DOI] [PMC free article] [PubMed] [Google Scholar]
- 12.Davidson B., Trope' C. G., Wang T. L., Shih Ie M. (2006) Gynecol. Oncol. 103, 814–819 [DOI] [PubMed] [Google Scholar]
- 13.LeRoy G., Loyola A., Lane W. S., Reinberg D. (2000) J. Biol. Chem. 275, 14787–14790 [DOI] [PubMed] [Google Scholar]
- 14.Loyola A., Huang J. Y., LeRoy G., Hu S., Wang Y. H., Donnelly R. J., Lane W. S., Lee S. C., Reinberg D. (2003) Mol. Cell Biol. 23, 6759–6768 [DOI] [PMC free article] [PubMed] [Google Scholar]
- 15.Loyola A., LeRoy G., Wang Y. H., Reinberg D. (2001) Genes Dev. 15, 2837–2851 [DOI] [PMC free article] [PubMed] [Google Scholar]
- 16.Sheu J. J., Choi J. H., Yildiz I., Tsai F. J., Shaul Y., Wang T. L., Shih I. M. (2008) Cancer Res. 68, 4050–4057 [DOI] [PMC free article] [PubMed] [Google Scholar]
- 17.Perpelescu M., Nozaki N., Obuse C., Yang H., Yoda K. (2009) J. Cell Biol. 185, 397–407 [DOI] [PMC free article] [PubMed] [Google Scholar]
- 18.Choi J. H., Park S. H., Leung P. C., Choi K. C. (2005) J. Clin. Endocrinol. Metab. 90, 207–210 [DOI] [PubMed] [Google Scholar]
- 19.Singh N. P., McCoy M. T., Tice R. R., Schneider E. L. (1988) Exp. Cell Res. 175, 184–191 [DOI] [PubMed] [Google Scholar]
- 20.Kolligs F. T., Hu G., Dang C. V., Fearon E. R. (1999) Mol. Cell Biol. 19, 5696–5706 [DOI] [PMC free article] [PubMed] [Google Scholar]
- 21.Hendrix N. D., Wu R., Kuick R., Schwartz D. R., Fearon E. R., Cho K. R. (2006) Cancer Res. 66, 1354–1362 [DOI] [PubMed] [Google Scholar]
- 22.Komiya T., Park Y., Modi S., Coxon A. B., Oh H., Kaye F. J. (2006) Oncogene 25, 6128–6132 [DOI] [PubMed] [Google Scholar]
- 23.Bommer G. T., Jäger C., Dürr E. M., Baehs S., Eichhorst S. T., Brabletz T., Hu G., Fröhlich T., Arnold G., Kress D. C., Göke B., Fearon E. R., Kolligs F. T. (2005) J. Biol. Chem. 280, 7962–7975 [DOI] [PubMed] [Google Scholar]
- 24.Foster K. W., Ren S., Louro I. D., Lobo-Ruppert S. M., McKie-Bell P., Grizzle W., Hayes M. R., Broker T. R., Chow L. T., Ruppert J. M. (1999) Cell Growth & Differ. 10, 423–434 [PubMed] [Google Scholar]
- 25.Kolligs F. T., Nieman M. T., Winer I., Hu G., Van Mater D., Feng Y., Smith I. M., Wu R., Zhai Y., Cho K. R., Fearon E. R. (2002) Cancer Cell 1, 145–155 [DOI] [PubMed] [Google Scholar]
- 26.Bartkova J., Horejsí Z., Koed K., Krämer A., Tort F., Zieger K., Guldberg P., Sehested M., Nesland J. M., Lukas C., Ørntoft T., Lukas J., Bartek J. (2005) Nature 434, 864–870 [DOI] [PubMed] [Google Scholar]
- 27.Bartkova J., Rezaei N., Liontos M., Karakaidos P., Kletsas D., Issaeva N., Vassiliou L. V., Kolettas E., Niforou K., Zoumpourlis V. C., Takaoka M., Nakagawa H., Tort F., Fugger K., Johansson F., Sehested M., Andersen C. L., Dyrskjot L., Ørntoft T., Lukas J., Kittas C., Helleday T., Halazonetis T. D., Bartek J., Gorgoulis V. G. (2006) Nature 444, 633–637 [DOI] [PubMed] [Google Scholar]
- 28.Bartek J., Bartkova J., Lukas J. (2007) Oncogene 26, 7773–7779 [DOI] [PubMed] [Google Scholar]
- 29.Kastan M. B., Bartek J. (2004) Nature 432, 316–323 [DOI] [PubMed] [Google Scholar]
- 30.Shiloh Y. (2003) Nat. Rev. Cancer 3, 155–168 [DOI] [PubMed] [Google Scholar]
- 31.Salani R., Kurman R. J., Giuntoli R., 2nd, Gardner G., Bristow R., Wang T. L., Shih I. M. (2008) Int. J. Gynecol. Cancer 18, 487–491 [DOI] [PubMed] [Google Scholar]
- 32.Leitao M. M., Soslow R. A., Baergen R. N., Olvera N., Arroyo C., Boyd J. (2004) Gynecol. Oncol. 93, 301–306 [DOI] [PubMed] [Google Scholar]
- 33.Zindy F., Eischen C. M., Randle D. H., Kamijo T., Cleveland J. L., Sherr C. J., Roussel M. F. (1998) Genes Dev. 12, 2424–2433 [DOI] [PMC free article] [PubMed] [Google Scholar]
- 34.de Stanchina E., McCurrach M. E., Zindy F., Shieh S. Y., Ferbeyre G., Samuelson A. V., Prives C., Roussel M. F., Sherr C. J., Lowe S. W. (1998) Genes Dev. 12, 2434–2442 [DOI] [PMC free article] [PubMed] [Google Scholar]
- 35.Di Micco R., Fumagalli M., Cicalese A., Piccinin S., Gasparini P., Luise C., Schurra C., Garre' M., Nuciforo P. G., Bensimon A., Maestro R., Pelicci P. G., d'Adda di Fagagna F. (2006) Nature 444, 638–642 [DOI] [PubMed] [Google Scholar]
- 36.Di Micco R., Fumagalli M., d'Adda di Fagagna F. (2007) Trends Cell Biol. 17, 529–536 [DOI] [PubMed] [Google Scholar]
- 37.Soutoglou E., Misteli T. (2008) Science 320, 1507–1510 [DOI] [PMC free article] [PubMed] [Google Scholar]
- 38.Bochar D. A., Wang L., Beniya H., Kinev A., Xue Y., Lane W. S., Wang W., Kashanchi F., Shiekhattar R. (2000) Cell 102, 257–265 [DOI] [PubMed] [Google Scholar]
- 39.Bao Y., Shen X. (2007) Curr. Opin. Genet. Dev. 17, 126–131 [DOI] [PubMed] [Google Scholar]
- 40.Downey M., Durocher D. (2006) Nat. Cell Biol. 8, 9–10 [DOI] [PubMed] [Google Scholar]
- 41.Richardson C., Stark J. M., Ommundsen M., Jasin M. (2004) Oncogene 23, 546–553 [DOI] [PubMed] [Google Scholar]
- 42.Francis R., Richardson C. (2007) Genes Dev. 21, 1064–1074 [DOI] [PMC free article] [PubMed] [Google Scholar]
- 43.Xiao A., Li H., Shechter D., Ahn S. H., Fabrizio L. A., Erdjument-Bromage H., Ishibe-Murakami S., Wang B., Tempst P., Hofmann K., Patel D. J., Elledge S. J., Allis C. D. (2009) Nature 457, 57–62 [DOI] [PMC free article] [PubMed] [Google Scholar]
- 44.Ye Y., Xiao Y., Wang W., Wang Q., Yearsley K., Wani A. A., Yan Q., Gao J. X., Shetuni B. S., Barsky S. H. (2009) Mol. Cancer Res. 7, 1984–1999 [DOI] [PubMed] [Google Scholar]
- 45.Wu S., Shi Y., Mulligan P., Gay F., Landry J., Liu H., Lu J., Qi H. H., Wang W., Nickoloff J. A., Wu C., Shi Y. (2007) Nat. Struct. Mol. Biol. 14, 1165–1172 [DOI] [PMC free article] [PubMed] [Google Scholar]
- 46.Vogelstein B., Lane D., Levine A. J. (2000) Nature 408, 307–310 [DOI] [PubMed] [Google Scholar]
- 47.Eischen C. M., Weber J. D., Roussel M. F., Sherr C. J., Cleveland J. L. (1999) Genes Dev. 13, 2658–2669 [DOI] [PMC free article] [PubMed] [Google Scholar]
- 48.Sehdev A. S., Kurman R. J., Kuhn E., Shih I. M. (2010) Mod. Pathol. 23, 844–855 [DOI] [PMC free article] [PubMed] [Google Scholar]
- 49.Weaver B. A., Cleveland D. W. (2006) Curr. Opin. Cell Biol. 18, 658–667 [DOI] [PubMed] [Google Scholar]
Associated Data
This section collects any data citations, data availability statements, or supplementary materials included in this article.


