Abstract
Activation of RAW264.7 cells with a lipopolysaccharide specific for the TLR4 receptor, Kdo2-lipid A (KLA), causes a large increase in cellular sphingolipids, from 1.5 to 2.6 × 10⁹ molecules per cell in 24 h, based on the sum of subspecies analyzed by “lipidomic” mass spectrometry. Thus, this study asked the following question. What is the cause of this increase and is there a cell function connected with it? The sphingolipids arise primarily from de novo biosynthesis based on [U-13C]palmitate labeling, inhibition by ISP1 (myriocin), and an apparent induction of many steps of the pathway (according to the distribution of metabolites and microarray analysis), with the exception of ceramide, which is also produced from pre-existing sources. Nonetheless, the activated RAW264.7 cells have a higher number of sphingolipids per cell because KLA inhibits cell division; thus, the cells are larger and contain increased numbers of membrane vacuoles termed autophagosomes, which were detected by the protein marker GFP-LC3. Indeed, de novo biosynthesis of sphingolipids performs an essential structural and/or signaling function in autophagy because autophagosome formation was eliminated by ISP1 in KLA-stimulated RAW264.7 cells (and mutation of serine palmitoyltransferase in CHO-LYB cells); furthermore, an anti-ceramide antibody co-localizes with autophagosomes in activated RAW264.7 cells versus the Golgi in unstimulated or ISP1-inhibited cells. These findings establish that KLA induces profound changes in sphingolipid metabolism and content in this macrophage-like cell line, apparently to produce sphingolipids that are necessary for formation of autophagosomes, which are thought to play important roles in the mechanisms of innate immunity.
Keywords: Autophagy, Lipopolysaccharide (LPS), Macrophage, Mass Spectrometry (MS), Sphingolipid, Ceramide, Kdo2-Lipid A
Introduction
Sphingolipids (SL)5 are a complex family of molecules (1) that participate in many facets of cell structure and function (2, 3). For some categories of cells, such as macrophages, normal and abnormal functions have been associated with seemingly every SL subcategory, including sphingosine (4), sphingosine 1-phosphate (S1P) (5), ceramide (Cer) (6), ceramide 1-phosphate (Cer-1-P) (7), sphingomyelin (SM) (8), and both simple (e.g. glucosylceramide (GlcCer)) (9) and more complex glycosphingolipids (10–12). Likewise, macrophage behavior can be modified by inhibition of de novo sphingolipid biosynthesis by l-cycloserine (13) and myriocin (14) and by sphingolipid analogs such as FTY720 (15), PCERA-1 (Cer-1-P analog) (16), and α-galactosylceramide (α-GalCer) (17), among others.
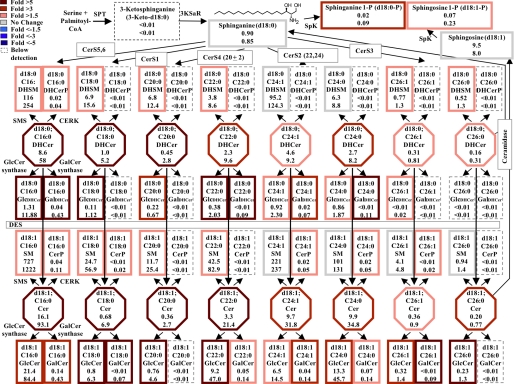
As part of the characterization of the mouse macrophage lipidome by the LIPID MAPS Consortium, the major sphingolipid subspecies of the mouse macrophage-like cell line, RAW264.7, have been quantified from the first detectable biosynthetic intermediate (sphinganine) through the branch point where Cer is partitioned into SM, Cer-1-P, GlcCer, and GalCer using liquid chromatography electrospray ionization-tandem mass spectrometry (LC ESI-MS/MS) (18). The Consortium has also investigated the effects of activation of these cells with Kdo2-lipid A (KLA), a chemically defined substructure of bacterial lipopolysaccharide (LPS) that is specifically recognized by the TLR4 receptor (19). LPS has been previously reported to stimulate SL biosynthesis in liver (20) and extrahepatic tissues (21) and to elevate Cer in RAW264.7 cells by induction of turnover of pre-existing SLs (22). Our studies have found that KLA nearly doubles the SL content of RAW264.7 cells, with increases in many of the SL subspecies summarized in the pathway scheme shown in Fig. 1. This study notes that two of the reasons that stimulated RAW264.7 cells have more SLs are that KLA increases de novo biosynthesis but inhibits cell division; therefore, the size of the cells increases, and they contain large numbers of intracellular vacuoles (autophagosomes). Induction of autophagy has previously been noted upon TLR4 activation and is thought to be important in phagocytosis and regulation of the inflammatory response (23–25). This study has additionally established that de novo SL biosynthesis is required for autophagy and that Cer are associated with autophagosomes, implying that they play structural and/or signaling roles in this important biochemical process.
FIGURE 1.
KLA induces substantial increases in the amounts of multiple cellular sphingolipids. RAW264.7 cells were incubated with vehicle control (PBS) or KLA (100 ng/ml). Following 24 h of treatment, cells were harvested for lipid extraction and analysis by LC ESI-MS/MS. The number of million molecules per cell for each sphingolipid species is shown for control (upper number) and KLA (lower number)-treated cells with heat map coloration to illustrate the fold change of each subspecies. Data represent the means (n = 9).
EXPERIMENTAL PROCEDURES
Materials
The suppliers for the reagents were as follows: Kdo2-lipid A and the internal standard mixture for SL analysis by LC ESI-MS/MS (ceramide/sphingoid internal standard mixture II, LM-6005) (Avanti Polar Lipids, Alabaster, AL); [U-13C]palmitic acid (98%) (Cambridge Isotopes, Andover, MA); fatty acid-free BSA (Calbiochem)6; Hoechst 33342 (Invitrogen); ISP1 (Biomol, Plymouth Meeting, PA); mouse monoclonal antibody to SPT1 (anti-LCB1), anti-BiP/GRP78, and anti-GM130 (BD Biosciences); rabbit monoclonal anti-HA tag and rabbit polyclonal LC3B antibody (Cell Signaling Technology, Boston); mouse monoclonal anti-Cer antibody clone 15B4 (Alexis Biochemicals, San Diego) This antibody clone has been successfully used in immunocytochemistry applications with no indication of nonspecific reactions with other lipids (26–31) The secondary Alexa Fluor-conjugated F(ab)2 fragment goat anti-mouse antibody and goat anti-rabbit antibody were from Molecular Probes, Inc. (Eugene, OR.). The sources for liquid chromatography (LC) columns, solvents, and other reagents used for mass spectrometry were the same as in the published method (18).
Cells and Cell Culture
RAW264.7 cells were obtained from the American Type Culture Collection (Manassas, VA) and grown in DMEM (MediaTech, Manassas, VA) supplemented with 10% heat-inactivated fetal calf serum (HyClone Logan, UT) and penicillin (100 units/ml) plus streptomycin (0.1 mg/ml). The cells were maintained in a 37 °C, 90% relative humidity, 5% CO2 environment. All cell culture conditions, unless otherwise noted, followed the standard protocol adopted by the LIPID MAPS Consortium, which has been provided in the supplemental material.
Lipid Extraction and Analysis by LC ESI MS/MS
The extraction and analysis method has been thoroughly described (18, 32). The mass spectrometry data were collected using a PE Sciex API 3000 triple quadrupole and a 4000 quadrupole linear-ion trap mass spectrometer. For quantification, the samples were spiked with the internal standard mixture (Avanti Polar Lipids, Alabaster, AL). DNA was quantified using the Quant-iT DNA assay kit, broad range (Molecular Probes), and the relationship, 3 μg of DNA = 1 × 10⁶ RAW264.7 cells, was empirically determined by comparison of DNA amount and number of cells counted using a hemocytometer.
Immunofluorescence Confocal Microscopy
RAW264.7 cells stably expressing GFP-LC3 were cultured on glass coverslips (VWR, Inc., West Chester, PA) in 24-well plates. Following treatment, cells were fixed with 4% formaldehyde for 15 min. Fixed cells were rinsed in PBS, and the nucleic acids were stained by incubating fixed cells with 1 μg/ml Hoechst 3342 for 7 min at room temperature. Stained cells were rinsed in PBS and mounted in Fluoromount G (Southern Biotechnology Associates, Inc., Birmingham, AL) prior to observation under a Zeiss LSM 510 inverted laser scanning confocal microscope (Heidelberg, Germany). Images were collected with the resident Zeiss confocal microscope software and analyzed using ImageJ version 1.41a (National Institutes of Health). The ImageJ Plug-in analyze particles was used to identify “autophagosomes” as defined by a threshold value of 159–255 (33) and a particle size of 0.07–7 μm2 (34). Statistical analysis was performed using a two-tailed Student's t test.
Additional Methods
All other materials and methods are described in the supplemental material.
RESULTS
Fig. 1 depicts the early steps of SL biosynthesis with the average number of molecules per cell for each subspecies that has been quantified in RAW264.7 cells with and without KLA activation. These averages have been calculated using the 24-h data from the LIPID MAPS time course studies, and information about the reproducibility of replicates, other time points, etc. can be obtained from the LIPID MAPS web site. The sum of all of these SL in RAW264.7 cells without KLA stimulation is ∼1.5 × 10⁹ molecules/cell (in other units 0.82 nmol/μg DNA, 2.4 nmol/106 cells), which is a slight underestimation of the total SL content because it does not include small amounts of more complex glyco-SLs. For comparison, the sum of all of the lipids in RAW264.7 cells is 6.2 × 10⁹ molecules per cell (3.4 nmol/μg DNA, 10.3 nmol/106 cells) (calculated from the LIPID MAPS web site, exempting triacylglycerols, cholesterol esters, and diacylglycerols because they are likely to be found mostly in lipid droplets). Therefore, SL constitute approximately one-fourth of the membrane lipid of these cells.
It is noteworthy that SM (1,200 × 106 molecules) and dihydro-SM (240 × 106 molecules) account for a large fraction of this total (Fig. 1, upper numbers). In contrast, 3-ketosphinganine, the first intermediate of de novo SL biosynthesis, is too low to detect, which is consistent with previous estimates that it is rapidly reduced to sphinganine (35, 36). Other intermediates of SL biosynthesis and turnover are present in more substantial amounts; for example, each RAW264.7 cell has, on average, 0.9 × 10⁶ molecules of sphinganine, 20 × 106 molecules of dihydroceramides (DHCer), 41 × 106 molecules of Cer, and 9.5 × 10⁶ molecules of sphingosine. In contrast, the amounts of sphinganine- and sphingosine 1-phosphate are very low (0.02 and 0.07 × 10⁶ molecules), and ceramide 1-phosphate is intermediate (0.4 × 10⁶ molecules). GlcCer is relatively prevalent (52.5 × 10⁶ molecules), but RAW264.7 cells have much lower amounts of GalCer (0.3 × 10⁶ molecules).
KLA Induces Substantial Increases in the Amounts of Multiple Cellular Sphingolipids7
After 24 h of stimulation with KLA (Fig. 1, lower numbers), almost every SL subspecies was higher than in the control, with about half increasing by ≥1.5-fold, as depicted by a heat map style coloration of the borders (red reflects the increases). The SL sum increased to 2.7 × 10⁹ molecules per cell (1.8-fold) at this time point. Interestingly, total lipids also increased 1.8-fold, from 6.2 to 10.9 × 10⁹ molecules/cell (data not shown). This fold increase was calculated by the summation of all lipid species measured by the LIPID MAPS Consortium.8
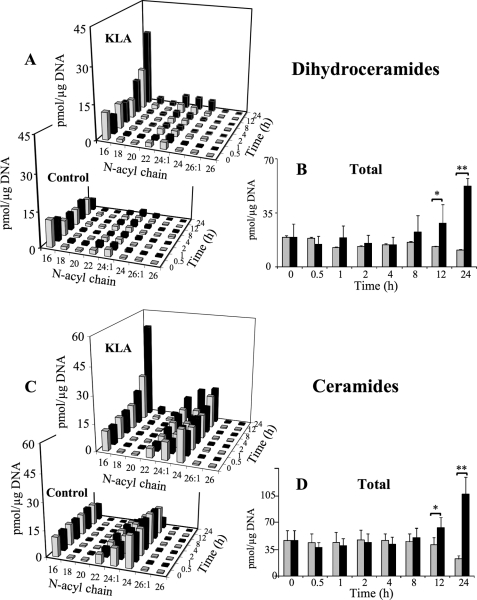
The time course changes for each subspecies of DHCer and Cer are shown in Fig. 2, with sums for all the chain lengths in Fig. 2, B and D. Significant differences in total DHCer and Cer for the KLA-treated and control cells were found 12 h after KLA addition, and both were ∼5-fold higher for the KLA-treated cells at 24 h (Fig. 2, B and D). It is interesting that control cells displayed a decrease in total DHcer and Cer over the time course. Although the reason for this decrease is unclear, it is expected to be the result of continued growth resulting in increases in cell density similar to decreases in cholesterol metabolism as cells reach confluency (37). This decrease in control cell lipids has also been found in other lipid categories, analyzed by the LIPID MAPS Consortium, such as certain species of fatty acids, glycerophospholipids, and sterol lipids.
FIGURE 2.
KLA induces time-dependent increases in ceramide and dihydroceramide. RAW264.7 cells were incubated with vehicle control (PBS) or KLA (100 ng/ml). Following treatment, cells were harvested at the indicated time points for lipid extraction and analysis by LC ESI-MS/MS. A, amounts of the major chain length subspecies of DHCer. Data represent the means (n = 9). B, amounts of total DHCer (a summation of all chain lengths) in KLA versus control conditions. Data represent the means ± S.E. (n = 9); *, p ≤ 0.05; **, p ≤ 0.001. C, amounts of the major chain length subspecies of Cer. Because of the difficulties in visualization, the quantities of ceramide subspecies in control treated cells at the 24-h time point are as follows: C16 (9 pmol/μg DNA); C18 (0.4 pmol/μg DNA); C20 (0.2 pmol/μg DNA); C22 (1.9 pmol/μg DNA); C24:1 (5.4 pmol/μg DNA); C24 (5.5 pmol/μg DNA); C26:1 (0.2 pmol/μg DNA); and C26 (0.1 pmol/μg DNA). Data represent the means ± S.E. (n = 9). D, amounts of total Cer (a summation of all chain lengths) in KLA versus control conditions. Data represent the means ± S.E. (n = 9); *, p ≤ 0.05; **, p ≤ 0.001.
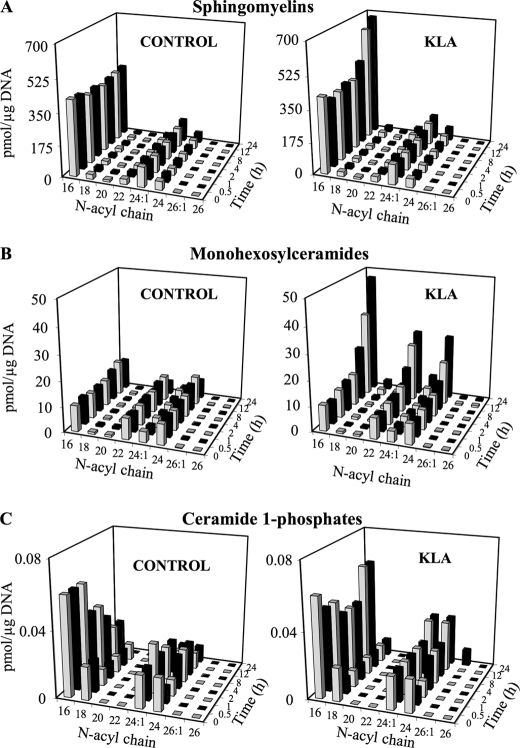
Elevations in the C16 subspecies of DHCer and Cer were evident at 8 h (Fig. 2, A and C), and these subspecies were also the highest at 24 h (Fig. 2, A and C, and supplemental Fig. S1). A similar time course profile (i.e. with at least the C16 subspecies being elevated at 8 h) was seen for SM (Fig. 3A), monohexosyl-Cer (i.e. GlcCer and GalCer, which were analyzed together because the amounts of GalCer are very small, ≤5%) (Fig. 3B), and Cer-1-P (Fig. 3C), but the latter was not elevated versus time 0, but rather against the time-matched control because the control cells displayed a curious decrease in Cer-1-P that occurred less in the KLA-treated cells. DHSM and monohexosyl-DHCer also increased for the KLA-treated cells versus the control, but the amounts were much smaller (supplemental Fig. S2).
FIGURE 3.
KLA induces time-dependent increases in ceramide metabolites. RAW264.7 cells were incubated with vehicle control (PBS) or KLA (100 ng/ml). Following treatment, cells were harvested at the indicated time points for lipid extraction and analysis by LC ESI-MS/MS. Amounts of the major chain length subspecies of Cer metabolites as follows: sphingomyelins (A), monohexosylceramides (B), and ceramide 1-phosphates (C) are shown. Data represent the means (n = 9).
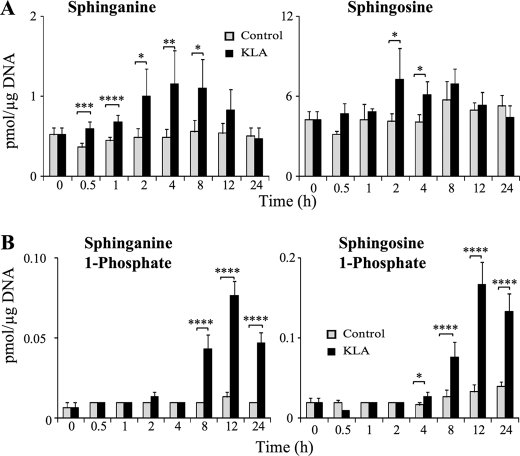
The SL that responded most rapidly to KLA was sphinganine (Fig. 4A), which was significantly different from the control at the earliest time point (0.5 h) and elevated by >2-fold between 2 and 8 h, when it began to decline and equaled the control at 24 h. Sphingosine also increased, as did sphinganine 1-phosphate and S1P, but the sphingoid base 1-phosphates increased later (i.e. at 4 h for S1P and 8 h for sphinganine 1-phosphate) (Fig. 4B).
FIGURE 4.
KLA alters the amount of sphingoid bases and sphingoid base phosphates. RAW264.7 cells were incubated with vehicle control (PBS) or KLA (100 ng/ml). Following treatment, cells were harvested at the indicated time points for lipid extraction and analysis by LC ESI-MS/MS. A, amounts of sphingoid bases, sphinganine and sphingosine. Data represent the means (n = 9). B, amounts of sphingoid base phosphates, sphinganine 1-phosphate and sphingosine 1-phosphate. Data represent the means ± S.E. (n = 9); *, p ≤ 0.05; **, p ≤ 0.01; ***, p ≤ 0.005; ****, p ≤ 0.001.
These changes are consistent with de novo SL biosynthesis being higher for KLA-stimulated RAW264.7 cells because sphinganine is the first detectable pathway intermediate, followed by DHCer and then Cer (Fig. 1). Cer might be elevated due to turnover of more complex SL (as discussed below); however, the increase in DHCer is not likely to come from turnover because this is not equivalent to the decrease in DHSM (cf. Fig. 2, A and B, with supplemental Fig. S2).
Correlation of Gene Expression with Metabolite Changes in KLA-treated RAW264.7 Cells3
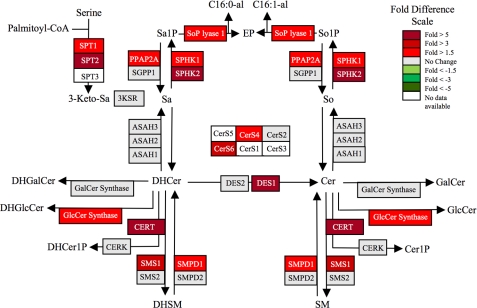
As part of the LIPID MAPS studies, the Consortium has also analyzed changes in the mRNAs for many of the enzymes of this pathway by microarray analysis (supplemental Fig. S3), and the results for the 24-h time point are displayed in Fig. 5 using a web-based display tool, GenMAPP version 2.1, that was expanded to include most of the genes currently known for these steps of de novo SL biosynthesis (38). According to this analysis, KLA caused relative increases in mRNAs for both of the major subunits of serine palmitoyltransferase (SPT1 and -2), at least one of the Cer synthases (CerS4), DHCer desaturase (DES1), and synthases for SM (sphingomyelin synthase) and GlcCer. The microarray data also suggest that KLA-stimulated RAW264.7 cells have elevated mRNAs for acid sphingomyelinase, sphingosine kinase (SphK1 and -2), and S1P lyase (Fig. 5), which are consistent with the previous report that LPS induces SM turnover (22, 39) and the elevation of sphingoid base phosphates (Fig. 4) (although elevation of S1P lyase might also indicate that there is elevated cleavage of the latter). Mindful of the caveats inherent in microarray analysis, these results suggest that KLA affects expression of mRNAs for multiple steps of the pathway, which is consistent with the changes in essentially all subcategories of SLs (Figs. 1–4) and the previous literature on the effects of LPS on SL metabolism (20–22, 40).
FIGURE 5.
KLA increases mRNA expression of genes involved in sphingolipid biosynthesis. Gene expression data for the sphingolipid metabolic enzymes following 24 h of treatment with KLA (100 ng/ml) using the KEGG-based microarray analysis tool (GenMAPP version 2.1) that has been modified to display this pathway more completely. The coloration is log2-fold change in expression following treatment with KLA (100 ng/ml) for 24 h from microarray data generated by the LIPID MAPS Consortium. The sphingolipid metabolites and genes (with the gene abbreviations shown in boxes or enzyme names where gene names are ambiguous) are given for the condensation of serine and palmitoyl-CoA to form 3-ketosphinganine (3-ketoSa) by serine palmitoyltransferase (SPT), which is reduced to sphinganine (Sa), acylated to dihydroceramides (DHCer) by (DH)Cer synthases (CerS), and incorporated into more complex DH-sphingolipids (the 1-phosphate (DHCer-1-P) sphingomyelins (DHSM), glucosylceramides (DHGlcCer), galactosylceramides (DHGalCer)) or desaturated to Cer followed by headgroup addition. Also included are a number of the catabolic genes, e.g. sphingomyelinases (SMPD), ceramidases (ASAH), sphingosine kinases (SphK) for the formation of sphinganine 1-phosphate (Sa1P) and sphingosine 1-phosphate (So1P), and phosphatases for the reverse reaction and the lyase that cleaves sphingoid base 1-phosphates to ethanolamine phosphate (EP), hexadecanal (C16:0al), and hexadecenal (C16:1al).
Analysis of de Novo Sphingolipid Biosynthesis in KLA-treated RAW264.7 Cells
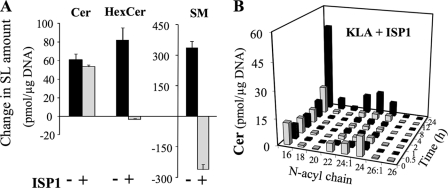
For further insight into the effect of KLA on sphingolipid metabolism, the serine palmitoyltransferase inhibitor ISP1/myriocin (41) was used to block de novo SL biosynthesis. As shown in Fig. 6A, ISP1 reduced the KLA-induced elevation of Cer somewhat, completely eliminated the increase in HexCer, and actually decreased SM (reflecting SM turnover that was not evident in the original analysis of SM amount, Fig. 3A, because the rate of SM biosynthesis is greater than turnover). Fig. 6B shows the effect of ISP1 on KLA-treated cells over time as well as the individual Cer chain lengths. ISP1 caused an initial decrease in all of the Cer subspecies, but only slightly blunted the increase in Cer between 12 and 24 h (cf. Figs. 6B and 2C). One of the most interesting features of these Cer data is that they display different acyl chain profiles for the Cer of the cells treated for 24 h with ISP1 + KLA versus those treated with KLA alone. The Cer of KLA-induced RAW264.7 cells is relatively similar to that of the controls (i.e. C24:0 > C24:1 > C22:0) (Fig. 2C), whereas the profile in cells treated with ISP1 + KLA has C24:1 as the predominant very long chain subspecies (Fig. 6B). The latter subspecies distribution is similar to that for SM (i.e. C24:1 > C24:0) (cf. Fig. 6B with Figs. 3A and 2C).
FIGURE 6.
Effect of ISP1 on sphingolipid biosynthesis in KLA-treated RAW264.7 cells. RAW264.7 cells were incubated for 24 h with vehicle control (PBS), KLA (100 ng/ml), ISP1 (1 μm), or KLA + ISP1. For cells treated with KLA + ISP1, ISP1 was added 1 h prior to the addition of KLA. Following treatment, cells were harvested for lipid extraction and analysis by LC ESI-MS/MS. A, change in the amounts of Cer, HexCer, and SM for cells treated with KLA or KLA + ISP1. Data represent the means ± S.E. (n = 3). B, amounts of the major chain length subspecies of ceramide in cells treated with KLA + ISP1. Data represent the means (n = 3).
Thus, these results suggest that some of the increases in Cer are due to de novo biosynthesis (i.e. ISP1-inhibited). The portion that is not inhibited is likely to come from turnover of more complex SLs. It is likely that this ceramide is derived from SM because of the decrease in SM amounts and the N-acyl chain length distribution of the Cer in the cells treated with ISP1 + KLA for 24 h. A third factor that might affect the Cer subspecies distribution of these SL is our observation that KLA alters the fatty acyl-CoA composition of the cells (supplemental Fig. S4). Therefore, stable isotope labeling was used to monitor the compounds that are made de novo versus via turnover.
Analysis of de Novo Sphingolipid Biosynthesis RAW264.7 Cells by [13C]Palmitate Labeling
The most direct way to monitor de novo SL biosynthesis is to follow the incorporation of [U-13C]palmitate because this precursor is converted into [U-13C]palmitoyl-CoA and utilized in the first step of sphingoid base biosynthesis as well as for the N-acylation of sphingoid bases (Fig. 1). Thus, cells will contain four isotopically distinct compounds, all of which can be analyzed by LC ESI-MS/MS as follows: SL with only 12C (plus natural abundance 13C, which has been corrected for this as well as the other species described here), which reflect pre-existing SL and those made with endogenous unlabeled palmitate; SL labeled in only the sphingoid base backbone (which we term “base-labeled”); SL with a labeled sphingoid base plus an amide-linked 13C-fatty acid (which we term “dual labeled”); and SL labeled in only the amide-linked fatty acid, which are likely to be composed of at least some 12C-sphingoid bases that have been released by turnover and then reacylated using 13C-fatty acyl-CoA. The base-labeled and dual-labeled SL are unambiguously made by de novo biosynthesis and therefore have been examined in control and KLA-treated cells.
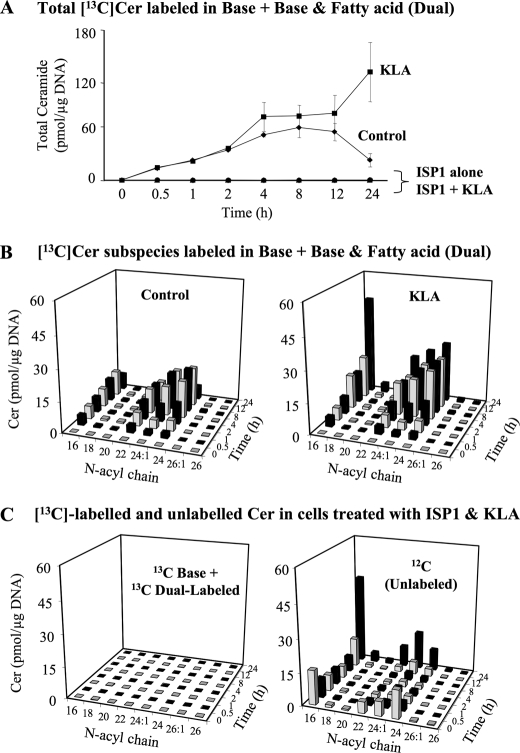
The sum of base and dual-labeled [13C]Cer increases over time for both control and in KLA-treated RAW264.7 cells (Fig. 7A), with a plateau between 4 and 12 h and then decreasing for the control cells, whereas label incorporation continues approximately linearly for the entire 24 h for the KLA-treated cells. Label incorporation has a similar subspecies distribution pattern for the control and the KLA-treated cells for the first 12 h (Fig. 7B) (even though the amounts of labeled Cer are greater in the KLA-treated cells, as also displayed in Fig. 7A), but the patterns diverge at 24 h, where the C16-Cer subspecies predominates in the KLA-treated cells. As predicted, all of these backbone and dual-labeled SL arise from de novo biosynthesis because ISP1 completely eliminated the incorporation (Fig. 7, A and C, left graph). In contrast, the right graph of Fig. 7C shows the unlabeled (12C-) Cer in the same cells, which is almost identical to Fig. 6B, i.e. the Cer amounts decrease over the first ∼8 h but afterward increase despite the presence of ISP1. Therefore, this later increase in [12C]Cer must reflect the appearance of unlabeled Cer from another source.
FIGURE 7.
Analysis of de novo sphingolipid biosynthesis in RAW264.7 cells by [13C]palmitate labeling. RAW264.7 cells were incubated with 0.1 mm [U-13C]palmitic acid (as the BSA complex) with vehicle control (PBS), KLA (100 ng/ml), ISP1 (1 μm), or KLA+ ISP1. For cells treated with KLA + ISP1, ISP1 was added 1 h prior to the addition of KLA for the times shown. The appearance of 13C in newly synthesized sphingolipids was quantified by mass spectrometry as described under supplemental “Materials and Methods”. A, summation of base (backbone)-labeled and dual (backbone and fatty acid)-labeled Cer subspecies. Data represent the means ± S.E. (n = 3). B, summation of base (backbone)-labeled and dual (backbone and fatty acid)-labeled Cer species in cells treated with control (left) or KLA (right), Data represent the means (n = 3). Because of the difficulties in visualization, the quantities of ceramide subspecies in control treated cells at the 24-h time point are as follows: C16 (7.6 pmol/μg DNA); C18 (0.7 pmol/μg DNA); C20 (0.3 pmol/μg DNA); C22 (3.2 pmol/μg DNA); C24:1 (6 pmol/μg DNA); C24 (6.4 pmol/μg DNA); C26:1 (0.2 pmol/μg DNA); C26 (0.1 pmol/μg DNA). C, summation of base (backbone)-labeled and dual (backbone and fatty acid)-labeled Cer species (left) and 12C (unlabeled) Cer species (right) in cells treated with KLA + ISP1. Data represent the means (n = 3).
Overall, these results confirm that de novo biosynthesis accounts for initial increases in Cer in KLA-treated RAW264.7 cells and a portion of the increase at 12 and 24 h, but at 12 and 24 h, Cer also arises from an unlabeled pool(s), i.e. from turnover of pre-existing SL (and most likely SM, because turnover of SM has been shown in Fig. 6A, and the N-acyl-chain distributions of SM and this Cer are similar (cf. Figs. 3A versus 6B and 7C, as discussed above)).
KLA Inhibits Growth and Increases the Size of RAW264.7 Cells
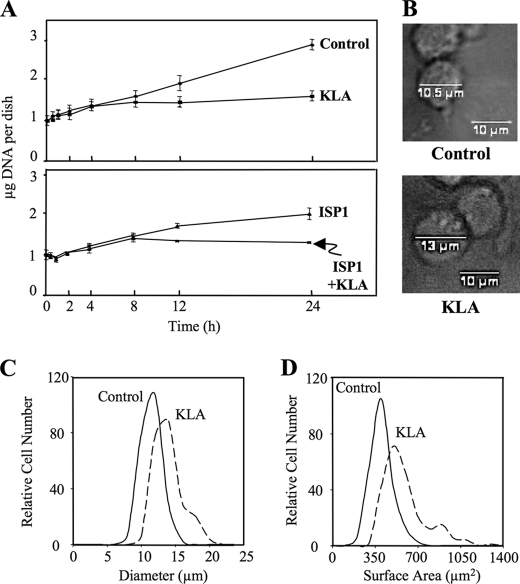
In contemplating why the RAW264.7 cells acquire such substantial amounts of additional SL (and lipids overall) upon activation, as well as why the 13C-labeled SL of the control cells decrease on a per cell basis between 12 and 24 h (Fig. 7A), it occurred to us that this might be related to cell growth, i.e. that SL biosynthesized by growing cells will be distributed into multiple daughter cells upon division, whereas growth-inhibited cells that continue to synthesize SL will accumulate them unless turnover is more rapid. Activation of RAW264.7 cells by LPS is known to inhibit cell growth (42), and Fig. 8A shows that this also occurs with KLA. Based on the measured micrograms of DNA per dish, the KLA-treated cells cease to grow after 4–6 h (during which the micrograms of DNA increases from 1 to 1.6 μg of DNA, or 3.3–5.3 × 10⁵ cells, and remains at this number throughout the rest of the 24-h time course), whereas the control cells triple (i.e. from ∼1 to 2.9 μg of DNA corresponding to an increase in cell number from 3.3 to 9.6 × 10⁵ cells) in 24 h. Therefore, the major contributor to the increase in SL in the KLA-treated cells is that the biosynthesized lipids remain with the original cells rather than being divided into daughter cells. The lower graph in Fig. 8A shows that ISP1 is also partially growth-inhibitory.
FIGURE 8.
KLA reduces cell number and increases cell size in RAW264.7 cells. A, μg of DNA per dish following treatment with vehicle control (PBS), KLA (100 ng/ml), ISP1 (1 μm), or KLA+ ISP1 for various times. Data represent the means ± S.E. (n = 3). B, representative bright field images with measured cellular diameter for control and KLA-treated cells. For each experimental condition, 225 cells were analyzed. Data represent the means. The relative cellular diameter (C) and relative cellular surface area (D) distribution patterns are shown. For each experimental condition, 225 cells were analyzed.
The greater amount of lipid in KLA-activated RAW264.7 cells would be predicted to increase cell size, and LPS has been reported to increase the diameter of this cell line (43). The diameter of the RAW264.7 cells with and without KLA treatment for 24 h was estimated by measuring the cell size distribution using bright field microscopy. As shown in Fig. 8B, the KLA-treated cells appear somewhat larger, and a graph of the relative distribution of the measured diameters (Fig. 8C) shows that the distribution curve is shifted to the right for KLA-treated cells and shows a non-Gaussian distribution. From these data, the average cell diameters for the control and KLA-activated cells were calculated to be ∼10.5 and ∼13.0 μm, respectively. An increase in diameter of this magnitude (24%) would correspond to an ∼53% increase in surface area (Fig. 8D), which is similar to that estimated following LPS treatment of RAW264.7 cells (44).
Thus, continued SL biosynthesis with an expansion of membrane area (and cell size) in RAW264.7 cells that are growth-inhibited by KLA is a major contributor to the increase in SL content of these cells, and probably the increase in lipid amount overall. The difference between the change in cell surface area (1.5×, although this is only a rough approximation) and the change in lipid amount (1.8×) probably reflects an accompanying increase in intracellular membranes. Activation of the TLR4 receptor of RAW264.7 cells by LPS is known to induce the formation of the vacuolar structures referred to as autophagosomes (24, 25), and therefore, these were examined next.
KLA Induces Autophagy in RAW264.7 Cells, and KLA-induced Autophagy Is Dependent on de Novo SL Biosynthesis
Autophagosomes are particularly interesting from a SL perspective because exogenously added Cer, or cellular accumulation of Cer due to disruption of SL metabolism, has been shown to induce autophagy in other cell types (45–47). Studies of autophagy frequently use cells that stably or transiently express a green fluorescent protein (GFP)-tagged LC3 protein (microtubule-associated protein 1 light chain 3) (48) that, like wild-type LC3, is recruited from the cytosol to become part of the autophagosome due to conjugation of the C-terminal glycine with phosphatidylethanolamine (48, 49); therefore, the appearance and accumulation of GFP-LC3 puncta is widely used to assess autophagy (48).
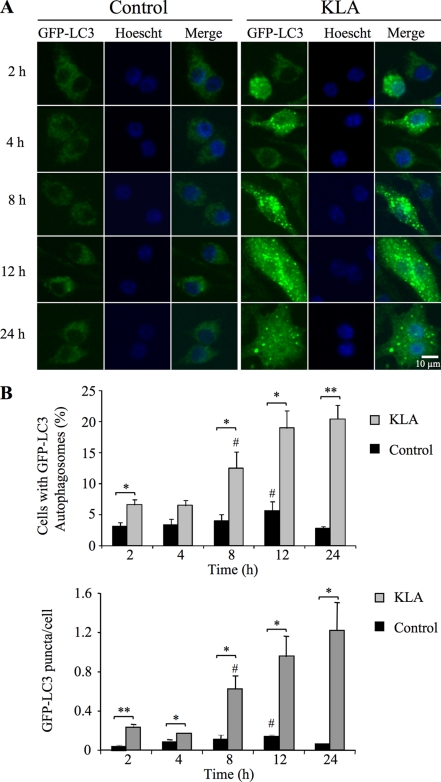
As shown in Fig. 9, KLA treatment of RAW264.7 cells stably expressing GFP-LC3 induced the characteristic redistribution of GFP-LC3 from diffuse fluorescence throughout the cytosol (left panels of Fig. 9A) to numerous punctate fluorescent vesicles (right panels of Fig. 9A). A quantitative analysis of the confocal microscopic images revealed that a small but statistically significant increase in the number of cells expressing GFP-LC3 puncta and the number of GFP-LC3 puncta/cell following KLA treatment can be seen as early as 2 h, but the largest differences are seen later (Fig. 9B).
FIGURE 9.
KLA induces autophagy in RAW264.7 cells. RAW264.7 cells stably expressing GFP-LC3 were incubated for various times with vehicle control (PBS) or KLA (100 ng/ml). A, representative images. B, number of cells displaying GFP-LC3 puncta (upper panel) and the number of GFP-LC3 puncta/cell (lower panel) were quantified using ImageJ. For each experimental condition, a minimum of 260 cells/experiment was counted. Data represent mean ± S.E. (n = 3); # (n = 2); *, p ≤ 0.05; **, p ≤ 0.01.
Consistent with these findings, the LIPID MAPS microarray data set for the RAW264.7 cells reveal that KLA elevates the mRNAs for Atg8/LC3 and Atg12, which are positively correlated with autophagy (supplemental Fig. S5A) (50, 51), and an elevation in the lipidated form of LC3 (LC3II) was detected by Western blot analysis in both RAW264.7 cells stably transfected with GFP-LC3 and untransfected RAW264.7 cells (supplemental Fig. S5B) (48, 52). Taken together, the above data establish that KLA induces autophagy in RAW264.7 cells.
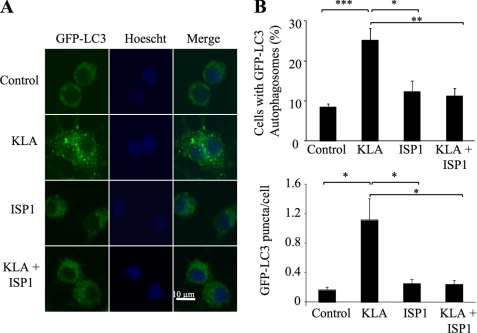
To determine whether de novo SL biosynthesis is required for the induction of autophagy by KLA, RAW264.7 cells stably expressing GFP-LC3 were treated with ISP1 for 1 h, and then KLA was added, and the numbers of autophagosomal puncta were analyzed (Fig. 10). By both visual inspection (Fig. 10A) and quantitative analysis of the confocal images (Fig. 10B), it is evident that inhibition of de novo SL biosynthesis by ISP1 blocked the appearance of GFP-LC3-associated autophagosomes. This is doubly interesting because it not only links de novo SL biosynthesis with KLA-induced autophagy but also establishes that the elevation of Cer due to SL turnover (which was minimally affected by ISP1) (Figs. 6B and 7C) is not sufficient to induce autophagy.
FIGURE 10.
KLA-induced autophagy is dependent on de novo sphingolipid biosynthesis. RAW264.7 cells stably expressing GFP-LC3 were incubated for 24 h with vehicle control (PBS), KLA (100 ng/ml), ISP1 (1 μm), or KLA + ISP1. For cells treated with KLA + ISP1, ISP1 was added 1 h prior to the addition of KLA. A, representative images. B, number of cells displaying GFP-LC3 puncta (upper panel) and the number of GFP-LC3 puncta/cell were quantified using ImageJ. For each experimental condition, a minimum of 195 cells/experiment were counted. Data represent mean ± S.E. (n = 4). *, p ≤ 0.05; **, p ≤ 0.01; ***, p ≤ 0.001.
Confirmation That de Novo Sphingolipid Biosynthesis Is Required for Autophagy Using CHO-LYB Cells
Because conditions for complete knockdown of de novo SL biosynthesis using siRNA have not been established yet for these RAW264.7 cells, the requirement for de novo SL biosynthesis for autophagy induction was confirmed using another cell model, the CHO-LYB cell line, which lacks serine palmitoyltransferase activity due to mutation of SPT1 (53). When these cells were transfected with GFP-LC3 and treated with a reagent known to induce autophagy, fenretinide (4-hydroxyphenylretinamide) (45, 54, 55), there was no increase in fluorescent puncta versus the control (supplemental Fig. S6). However, when this cell line has been stably transfected with SPT1 (CHO-LYB-LCB1 cells) to restore de novo SL biosynthesis (53), it responds to fenretinide with robust accumulation of GFP-LC3 punctate autophagosomes (supplemental Fig. S6), as has been seen in other cell lines (45, 54, 55). Therefore, these results confirm that de novo SL biosynthesis is required for induction of autophagy.
Evidence That KLA Promotes the Co-localization of Cer with Autophagosomes
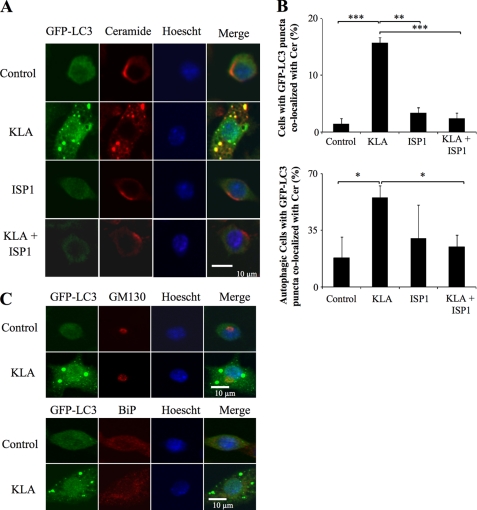
SL biosynthesis de novo originates in the endoplasmic reticulum (ER) (56) followed by trafficking of Cer (and other metabolites) to the Golgi complex (GC) by vesicular and ceramide transporter-mediated processes (57). Because the ER and Golgi are thought to be membrane components for autophagosome formation (58–61), it is possible that de novo biosynthesized Cer and/or other SL are incorporated into autophagosomes for structural and/or signaling purposes. To determine whether Cer is associated with autophagosomes, we examined RAW264.7 cells using an anti-Cer antibody that has been previously characterized for subcellular localization studies (26–31). In unstimulated RAW264.7 cells, this antibody co-localized mainly in the perinuclear Golgi region, as has been previously observed for other cells using anti-Cer antibodies (26) and fluorescent Cer analogs (Fig. 11A) (62). However, following addition of KLA, the immunofluorescence clearly shifts to punctate vesicles that co-localize with the autophagosomal marker, GFP-LC3 (Fig. 11A). Furthermore, inhibition of de novo SL biosynthesis with ISP1 had no noticeable effect on the anti-Cer antibody immunofluorescence associated with the GC (in control or KLA-treated cells) but blocked the KLA-induced co-localization of Cer with autophagosomes (Fig. 11A). The quantitative analysis of multiple confocal images shows that this suppression was highly significant (Fig. 11B) whether expressed as the total number of cells with GFP-LC3 puncta co-localized with Cer (Fig. 11B, upper panel) or as the number of autophagic cells (i.e. those cells with five or more GFP-LC3 puncta) with GFP-LC3 puncta co-localized with Cer (Fig. 11B, lower panel). The lack of effect of ISP1 on the GC localization is not surprising because Cer from SL turnover is known to reach the GC by retrograde trafficking (63, 64). Thus, these findings are strongly suggestive that the anti-Cer antibody immunofluorescence reflects Cer (and possibly related compounds such as DHCer) incorporation into autophagosomes in KLA-activated RAW264.7 cells.
FIGURE 11.
KLA promotes the co-localization of ceramide with the autophagosome. RAW264.7 cells stably expressing GFP-LC3 were incubated for 24 h with vehicle control (PBS), KLA (100 ng/ml), ISP1 (1 μm), or KLA + ISP1. For cells treated with KLA + ISP1, ISP1 was added 1 h prior to the addition of KLA. A, following treatment, the extra- and intracellular Cer was stained for all conditions. Representative images. B, number of cells displaying GFP-LC3 puncta co-localized with ceramide (upper panel) was quantified using ImageJ. For each experimental condition, a minimum of 150 cells/experiment were analyzed for ceramide co-localization. Data represent mean ± S.E. (n = 4). Lower panel, number of autophagic cells displaying GFP-LC3 puncta co-localized with Cer was quantified using ImageJ. For each experimental condition, a minimum total of 40 autophagic cells were analyzed for Cer co-localization. Data represent mean ± S.E. (n = 4). *, p ≤ 0.05; **, p ≤ 0.01; ***, p ≤ 0.001. C, RAW264.7 cells stably expressing GFP-LC3 were incubated for 24 h with vehicle control (PBS) or KLA (100 ng/ml). Following treatment, the Golgi complex and endoplasmic reticulum were stained using antibodies against GM130 and BiP, respectively.
Cer accumulation has been noted to cause disassembly of the GC (65); therefore, to determine whether the punctate structures seen in these studies might be due to disorganization/fragmentation of the ER/GC network, we also used antibodies against GM130, a resident protein found in the cis-Golgi, and BiP/GRP78, a chaperone protein found in the ER, to examine the structure of the GC and ER. As shown in Fig. 11C, KLA did not significantly alter the localization of GM130 or BiP/GRP78 suggesting that association of ceramide with the autophagosome is not due to its ability to disrupt the ER/GC (Fig. 11C). Together, these findings are strongly suggestive that de novo biosynthesized Cer (and possibly related compounds such as DHCer) are incorporated into autophagosomes but not via a general recruitment of the ER or GC.
DISCUSSION
These studies have determined the cellular amounts of the SL of RAW264.7 cells from the first detectable intermediate (sphinganine) through Cer and its initial metabolites (SM, GlcCer, etc.) and established how KLA, a TLR4 receptor agonist, alters the amounts of many of these compounds. Through the use of an inhibitor of de novo SL biosynthesis and stable isotope labeling, we found that both control and KLA-stimulated RAW264.7 cells are actively engaged in de novo SL biosynthesis; however, soon after KLA treatment, the cells stop dividing, resulting in an increase in the cell size and SL content.
Most of the changes in SL were due to de novo biosynthesis and are reminiscent of the induction of SL biosynthesis in liver (20) and a number of extrahepatic tissues (21). Increases in Cer are an interesting exception because it was also derived from another source, most likely the turnover of cellular SM, which is also in agreement with previously noted activation of sphingomyelinase and production of Cer in LPS-treated cells (22). It is intriguing that the amount of Cer that can be attributed to de novo biosynthesis when the cells are incubated with [13C]palmitate is similar to the total Cer in experiments without stable isotope labeling, and when cells are treated with ISP1 in addition to KLA (Figs. 2, 6, and 7). This suggests that the cells have mechanism(s) to maintain some form of “Cer homeostasis” by coordination of the formation and removal of this compound to/from multiple sources.
We think that one of the most important findings of these studies is that activation of RAW264.7 cells not only increased the cellular SL content but also cell size (∼24%), surface area (∼53%), and the production of the intracellular membrane vacuoles termed autophagosomes. Furthermore, de novo SL biosynthesis was shown to be necessary for autophagosome formation, which, to the best of our knowledge, is the first demonstration of the requirement for SL for a “normal” biological process for induction of autophagy, although exogenous addition of SL, or their endogenous accumulation when SL metabolism has been disrupted, has been noted to induce autophagy in other cell types (45–47, 66, 67). Consistent with a requirement for de novo SL biosynthesis for autophagy, we found that CHO-LYB cells are refractory to induction of autophagy by fenretinide until a functional SPT1 was reintroduced into the cells (supplemental Fig. S5). Therefore, SL may play an essential role in many, if not all, forms of autophagy.
It is not yet known with certainty if the de novo biosynthesized SL(s) required for autophagy is (are) (DH)Cer per se, although the anti-Cer antibody co-localization studies suggest that this might be the case. This raises the possibility that the production of (DH)Cer and possibly other SL (66) by de novo biosynthesis in the ER might be a driving force for formation of the autophagosomal vacuole, in what has been referred to as the “membrane extension” step (68) that occurs after many of the associated autophagosomal proteins have been recruited. If this process requires participation by the ER, this might explain why elevation of Cer by SL turnover did not appear to be adequate for induction of autophagy by KLA in RAW264.7 cells, which is also consistent with the previous observation that treatment of HT29 cells with bacterial sphingomyelinase to generate Cer had no effect on autophagy induction (46). Furthermore, because the enzymes for de novo Cer biosynthesis reside in the ER (56), it is conceivable that they might be recruited into autophagosomes and, perhaps, continue to produce SL there. However, a preliminary experiment using antibodies against the first two enzymes in de novo SL biosynthesis, serine palmitoyltransferase subunit 1 (SPT1, also called “LCB1”) and 3-ketosphinganine reductase, found no evidence that the enzymatic machinery for de novo SL biosynthesis is recruited to the autophagosome. Therefore, the idea of how ceramide becomes associated with the autophagosome is an interesting area for continued study.
There are additional reasons to suspect that Cer might play a role in autophagy. First, Cer has been identified as a mediator in the ER-localized dissociation of the Beclin-Bcl-2 complex, which facilitates autophagosomal vesicle nucleation (47, 69, 70). Second, activation of macrophages invokes ER stress (71), which is one of the up-regulators of autophagy (72) and might involve SL as intermediaries or modulators (73). Third, Cer has been shown to inhibit the activation of the Akt/mammalian target of rapamycin cascade resulting in the induction of autophagy (46), and the microarray analysis by the LIPID MAPS Consortium suggests that KLA decreases mammalian target of rapamycin mRNA; therefore, KLA might induce autophagy through repression of the Akt/mammalian target of rapamycin signaling pathway at multiple levels. All of the above might be inter-related or mean that there are multiple roles for SL in autophagy, as has often proven to be the case in other biological processes.
There is a strong likelihood that additional SL (66) and other lipid categories (e.g. phosphatidylethanolamine) (48, 49) are involved in autophagy and that the categories differ among organisms. In yeast, sterol glycoside appears to be critical for membrane extension (68), which suggests that future studies should explore if, by “lipid homology,” Cer-monohexoses (GlcCer and/or GalCer) might play a role in induction of autophagy in mammalian cells. Balances among lipid categories might also be important, as illustrated by the induction of autophagy by cholesterol overloading (74). Considering how many lipid categories are changed by KLA in RAW264.7 cells, there are many other possibilities to be explored. The studies described in this study have, at least, mapped the changes in SL metabolism in activated RAW264.7 cells and demonstrated a direct link between de novo SL biosynthesis and autophagy, one of the important cell behaviors of cells of the innate immune system.
Supplementary Material
Acknowledgments
We thank the members of LIPID MAPS for their analysis of the other lipid categories, Dr. Eoin Fahy for organizing the lipid and gene expression data on the LIPID MAPS web site, and Dr. Yury Miller for testing BSA for endotoxin contamination. We also thank Dr. Ken Hanada for providing the CHO-LYB and CHO-LYB-LCB1 cells and advice regarding their maintenance in cell culture and Dr. Erhard Beiberich for assistance with the ceramide staining protocol.
This work was supported, in whole or in part, by National Institutes of Health Grant GM069338 (to LIPID MAPS).

The on-line version of this article (available at http://www.jbc.org) contains supplemental “Materials and Methods,” Figs. S1–S6, and additional references.
Solutions containing BSA were tested for endotoxin contamination because we noted that fatty acid-free BSA from some suppliers was contaminated or became so during incubation at 37 °C during preparation of the fatty acid-BSA complex.
The KLA time course data (sphingolipid amounts as picomoles/μg DNA and microarray data) described here are also shown on the LIPID MAPS website as required by the National Institutes of Health as part of the data sharing requirement for this Consortium and in Ref. 76.
- SL
- sphingolipid
- Cer
- ceramide
- Cer-1-P
- ceramide 1-phosphate
- DHCer
- dihydroceramide
- ER
- endoplasmic reticulum
- GalCer
- galactosylceramide
- GlcCer
- glucosylceramide
- GC
- Golgi complex
- KLA
- Kdo2-lipid A
- LC ESI-MS/MS
- liquid chromatography-electrospray ionization-tandem mass spectrometry
- LC3
- microtubule-associated light chain 3
- LPS
- lipopolysaccharide
- S1P
- sphingosine 1-phosphate
- SM
- sphingomyelin.
REFERENCES
- 1.Merrill A. H., Jr., Wang M. D., Park M., Sullards M. C. (2007) Trends Biochem. Sci. 32, 457–468 [DOI] [PubMed] [Google Scholar]
- 2.Hannun Y. A., Obeid L. M. (2008) Nat. Rev. Mol. Cell Biol. 9, 139–150 [DOI] [PubMed] [Google Scholar]
- 3.Maceyka M., Milstien S., Spiegel S. (2009) J. Lipid Res. 50, S272–S276 [DOI] [PMC free article] [PubMed] [Google Scholar]
- 4.Monick M. M., Mallampalli R. K., Bradford M., McCoy D., Gross T. J., Flaherty D. M., Powers L. S., Cameron K., Kelly S., Merrill A. H., Jr., Hunninghake G. W. (2004) J. Immunol. 173, 123–135 [DOI] [PubMed] [Google Scholar]
- 5.Weigert A., Weis N., Brüne B. (2009) Immunobiology 214, 748–760 [DOI] [PubMed] [Google Scholar]
- 6.Knapp K. M., English B. K. (2000) J. Leukocyte Biol. 67, 735–741 [DOI] [PubMed] [Google Scholar]
- 7.Gangoiti P., Granado M. H., Wang S. W., Kong J. Y., Steinbrecher U. P., Gómez-Muñoz A. (2008) Cell. Signal. 20, 726–736 [DOI] [PubMed] [Google Scholar]
- 8.Gutierrez M. G., Gonzalez A. P., Anes E., Griffiths G. (2009) Cell. Microbiol. 11, 406–420 [DOI] [PubMed] [Google Scholar]
- 9.Grabowski G. A. (2006) Expert Opin. Drug. Deliv. 3, 771–782 [DOI] [PubMed] [Google Scholar]
- 10.Schaade L., Ritter K., Schiebel H. M., Thomssen R., Kleines M. (1999) IUBMB Life 48, 353–358 [DOI] [PubMed] [Google Scholar]
- 11.Berenson C. S., Gallery M. A., Smigiera J. M., Rasp R. H. (2002) J. Leukocyte Biol. 72, 492–502 [PubMed] [Google Scholar]
- 12.Stamatos N. M., Liang F., Nan X., Landry K., Cross A. S., Wang L. X., Pshezhetsky A. V. (2005) FEBS J. 272, 2545–2556 [DOI] [PubMed] [Google Scholar]
- 13.Cho J. Y. (2007) Biol. Pharm. Bull. 30, 2105–2112 [DOI] [PubMed] [Google Scholar]
- 14.Park T. S., Panek R. L., Rekhter M. D., Mueller S. B., Rosebury W. S., Robertson A., Hanselman J. C., Kindt E., Homan R., Karathanasis S. K. (2006) Atherosclerosis 189, 264–272 [DOI] [PubMed] [Google Scholar]
- 15.Blom T., Bäck N., Mutka A. L., Bittman R., Li Z., de Lera A., Kovanen P. T., Diczfalusy U., Ikonen E. (2010) Circ. Res. 106, 720–729 [DOI] [PMC free article] [PubMed] [Google Scholar]
- 16.Goldsmith M., Avni D., Ernst O., Glucksam Y., Levy-Rimler G., Meijler M. M., Zor T. (2009) Mol. Immunol. 46, 1979–1987 [DOI] [PubMed] [Google Scholar]
- 17.Emoto M., Yoshida T., Fukuda T., Kawamura I., Mitsuyama M., Kita E., Hurwitz R., Kaufmann S. H., Emoto Y. (2010) Infect. Immun. 78, 2667–2676 [DOI] [PMC free article] [PubMed] [Google Scholar]
- 18.Shaner R. L., Allegood J. C., Park H., Wang E., Kelly S., Haynes C. A., Sullards M. C., Merrill A. H., Jr. (2009) J. Lipid Res. 50, 1692–1707 [DOI] [PMC free article] [PubMed] [Google Scholar]
- 19.Raetz C. R., Garrett T. A., Reynolds C. M., Shaw W. A., Moore J. D., Smith D. C., Jr., Ribeiro A. A., Murphy R. C., Ulevitch R. J., Fearns C., Reichart D., Glass C. K., Benner C., Subramaniam S., Harkewicz R., Bowers-Gentry R. C., Buczynski M. W., Cooper J. A., Deems R. A., Dennis E. A. (2006) J. Lipid Res. 47, 1097–1111 [DOI] [PubMed] [Google Scholar]
- 20.Memon R. A., Holleran W. M., Uchida Y., Moser A. H., Ichikawa S., Hirabayashi Y., Grunfeld C., Feingold K. R. (1999) J. Biol. Chem. 274, 19707–19713 [DOI] [PubMed] [Google Scholar]
- 21.Memon R. A., Holleran W. M., Uchida Y., Moser A. H., Grunfeld C., Feingold K. R. (2001) J. Lipid Res. 42, 452–459 [PubMed] [Google Scholar]
- 22.MacKichan M. L., DeFranco A. L. (1999) J. Biol. Chem. 274, 1767–1775 [DOI] [PubMed] [Google Scholar]
- 23.Delgado M. A., Deretic V. (2009) Cell Death Differ. 16, 976–983 [DOI] [PMC free article] [PubMed] [Google Scholar]
- 24.Xu Y., Jagannath C., Liu X. D., Sharafkhaneh A., Kolodziejska K. E., Eissa N. T. (2007) Immunity 27, 135–144 [DOI] [PMC free article] [PubMed] [Google Scholar]
- 25.Delgado M. A., Elmaoued R. A., Davis A. S., Kyei G., Deretic V. (2008) EMBO J. 27, 1110–1121 [DOI] [PMC free article] [PubMed] [Google Scholar]
- 26.Krishnamurthy K., Dasgupta S., Bieberich E. (2007) J. Lipid Res. 48, 968–975 [DOI] [PubMed] [Google Scholar]
- 27.Wang G., Silva J., Krishnamurthy K., Tran E., Condie B. G., Bieberich E. (2005) J. Biol. Chem. 280, 26415–26424 [DOI] [PubMed] [Google Scholar]
- 28.Grassmé H., Jendrossek V., Riehle A., von Kürthy G., Berger J., Schwarz H., Weller M., Kolesnick R., Gulbins E. (2003) Nat. Med. 9, 322–330 [DOI] [PubMed] [Google Scholar]
- 29.Rotolo J. A., Zhang J., Donepudi M., Lee H., Fuks Z., Kolesnick R. (2005) J. Biol. Chem. 280, 26425–26434 [DOI] [PubMed] [Google Scholar]
- 30.Grassmé H., Riehle A., Wilker B., Gulbins E. (2005) J. Biol. Chem. 280, 26256–26262 [DOI] [PubMed] [Google Scholar]
- 31.Yin X., Zafrullah M., Lee H., Haimovitz-Friedman A., Fuks Z., Kolesnick R. (2009) Cell. Physiol. Biochem. 24, 219–230 [DOI] [PMC free article] [PubMed] [Google Scholar]
- 32.Sullards M. C., Allegood J. C., Kelly S., Wang E., Haynes C. A., Park H., Chen Y., Merrill A. H., Jr. (2007) Methods Enzymol. 432, 83–115 [DOI] [PubMed] [Google Scholar]
- 33.Iwata A., Riley B. E., Johnston J. A., Kopito R. R. (2005) J. Biol. Chem. 280, 40282–40292 [DOI] [PubMed] [Google Scholar]
- 34.Eskelinen E. L. (2008) Methods Mol. Biol. 445, 11–28 [DOI] [PubMed] [Google Scholar]
- 35.Merrill A. H., Jr., Wang E. (1986) J. Biol. Chem. 261, 3764–3769 [PubMed] [Google Scholar]
- 36.Merrill A. H., Jr., Wang E., Mullins R. E. (1988) Biochemistry 27, 340–345 [DOI] [PubMed] [Google Scholar]
- 37.Gal D., MacDonald P. C., Porter J. C., Smith J. W., Simpson E. R. (1981) Cancer Res. 41, 473–477 [PubMed] [Google Scholar]
- 38.Dahlquist K. D., Salomonis N., Vranizan K., Lawlor S. C., Conklin B. R. (2002) Nat. Genet. 31, 19–20 [DOI] [PubMed] [Google Scholar]
- 39.Sakata A., Ochiai T., Shimeno H., Hikishima S., Yokomatsu T., Shibuya S., Toda A., Eyanagi R., Soeda S. (2007) Immunology 122, 54–64 [DOI] [PMC free article] [PubMed] [Google Scholar]
- 40.Rozenova K. A., Deevska G. M., Karakashian A. A., Nikolova-Karakashian M. N. (2010) J. Biol. Chem. 285, 21103–21113 [DOI] [PMC free article] [PubMed] [Google Scholar]
- 41.Hanada K., Nishijima M., Fujita T., Kobayashi S. (2000) Biochem. Pharmacol. 59, 1211–1216 [DOI] [PubMed] [Google Scholar]
- 42.Raschke W. C., Baird S., Ralph P., Nakoinz I. (1978) Cell 15, 261–267 [DOI] [PubMed] [Google Scholar]
- 43.Saxena R. K., Vallyathan V., Lewis D. M. (2003) J. Biosci. 28, 129–134 [DOI] [PubMed] [Google Scholar]
- 44.Funk J. L., Feingold K. R., Moser A. H., Grunfeld C. (1993) Atherosclerosis 98, 67–82 [DOI] [PubMed] [Google Scholar]
- 45.Zheng W., Kollmeyer J., Symolon H., Momin A., Munter E., Wang E., Kelly S., Allegood J. C., Liu Y., Peng Q., Ramaraju H., Sullards M. C., Cabot M., Merrill A. H., Jr. (2006) Biochim. Biophys. Acta 1758, 1864–1884 [DOI] [PubMed] [Google Scholar]
- 46.Scarlatti F., Bauvy C., Ventruti A., Sala G., Cluzeaud F., Vandewalle A., Ghidoni R., Codogno P. (2004) J. Biol. Chem. 279, 18384–18391 [DOI] [PubMed] [Google Scholar]
- 47.Pattingre S., Bauvy C., Carpentier S., Levade T., Levine B., Codogno P. (2009) J. Biol. Chem. 284, 2719–2728 [DOI] [PMC free article] [PubMed] [Google Scholar]
- 48.Kabeya Y., Mizushima N., Ueno T., Yamamoto A., Kirisako T., Noda T., Kominami E., Ohsumi Y., Yoshimori T. (2000) EMBO J. 19, 5720–5728 [DOI] [PMC free article] [PubMed] [Google Scholar]
- 49.Sou Y. S., Tanida I., Komatsu M., Ueno T., Kominami E. (2006) J. Biol. Chem. 281, 3017–3024 [DOI] [PubMed] [Google Scholar]
- 50.Nara A., Mizushima N., Yamamoto A., Kabeya Y., Ohsumi Y., Yoshimori T. (2002) Cell Struct. Funct. 27, 29–37 [DOI] [PubMed] [Google Scholar]
- 51.Kouroku Y., Fujita E., Tanida I., Ueno T., Isoai A., Kumagai H., Ogawa S., Kaufman R. J., Kominami E., Momoi T. (2007) Cell Death Differ. 14, 230–239 [DOI] [PubMed] [Google Scholar]
- 52.Barth S., Glick D., Macleod K. F. (2010) J. Pathol. 221, 117–124 [DOI] [PMC free article] [PubMed] [Google Scholar]
- 53.Momin A. A., Park H., Allegood J. C., Leipelt M., Kelly S. L., Merrill A. H., Jr., Hanada K. (2009) Lipids 44, 725–732 [DOI] [PMC free article] [PubMed] [Google Scholar]
- 54.Tiwari M., Bajpai V. K., Sahasrabuddhe A. A., Kumar A., Sinha R. A., Behari S., Godbole M. M. (2008) Carcinogenesis 29, 600–609 [DOI] [PubMed] [Google Scholar]
- 55.Fazi B., Bursch W., Fimia G. M., Nardacci R., Piacentini M., Di Sano F., Piredda L. (2008) Autophagy 4, 435–441 [DOI] [PubMed] [Google Scholar]
- 56.Mandon E. C., Ehses I., Rother J., van Echten G., Sandhoff K. (1992) J. Biol. Chem. 267, 11144–11148 [PubMed] [Google Scholar]
- 57.Yamaji T., Kumagai K., Tomishige N., Hanada K. (2008) IUBMB Life 60, 511–518 [DOI] [PubMed] [Google Scholar]
- 58.Yoshimori T., Noda T. (2008) Curr. Opin. Cell Biol. 20, 401–407 [DOI] [PubMed] [Google Scholar]
- 59.Mijaljica D., Prescott M., Devenish R. J. (2006) Traffic 7, 1590–1595 [DOI] [PubMed] [Google Scholar]
- 60.Axe E. L., Walker S. A., Manifava M., Chandra P., Roderick H. L., Habermann A., Griffiths G., Ktistakis N. T. (2008) J. Cell Biol. 182, 685–701 [DOI] [PMC free article] [PubMed] [Google Scholar]
- 61.Hamasaki M., Yoshimori T. (2010) FEBS Lett. 584, 1296–1301 [DOI] [PubMed] [Google Scholar]
- 62.Hanada K., Kumagai K., Yasuda S., Miura Y., Kawano M., Fukasawa M., Nishijima M. (2003) Nature 426, 803–809 [DOI] [PubMed] [Google Scholar]
- 63.Rosenwald A. G., Pagano R. E. (1993) Adv. Lipid Res. 26, 101–118 [PubMed] [Google Scholar]
- 64.Hoffmann P. M., Pagano R. E. (1993) Eur. J. Cell Biol. 60, 371–375 [PubMed] [Google Scholar]
- 65.Hu W., Xu R., Zhang G., Jin J., Szulc Z. M., Bielawski J., Hannun Y. A., Obeid L. M., Mao C. (2005) Mol. Biol. Cell 16, 1555–1567 [DOI] [PMC free article] [PubMed] [Google Scholar]
- 66.Lavieu G., Scarlatti F., Sala G., Carpentier S., Levade T., Ghidoni R., Botti J., Codogno P. (2006) J. Biol. Chem. 281, 8518–8527 [DOI] [PubMed] [Google Scholar]
- 67.Daido S., Kanzawa T., Yamamoto A., Takeuchi H., Kondo Y., Kondo S. (2004) Cancer Res. 64, 4286–4293 [DOI] [PubMed] [Google Scholar]
- 68.Yamashita S., Oku M., Wasada Y., Ano Y., Sakai Y. (2006) J. Cell Biol. 173, 709–717 [DOI] [PMC free article] [PubMed] [Google Scholar]
- 69.Pattingre S., Tassa A., Qu X., Garuti R., Liang X. H., Mizushima N., Packer M., Schneider M. D., Levine B. (2005) Cell 122, 927–939 [DOI] [PubMed] [Google Scholar]
- 70.Maiuri M. C., Le Toumelin G., Criollo A., Rain J. C., Gautier F., Juin P., Tasdemir E., Pierron G., Troulinaki K., Tavernarakis N., Hickman J. A., Geneste O., Kroemer G. (2007) EMBO J. 26, 2527–2539 [DOI] [PMC free article] [PubMed] [Google Scholar]
- 71.Nakayama Y., Endo M., Tsukano H., Mori M., Oike Y., Gotoh T. (2010) J. Biochem. 147, 471–483 [DOI] [PubMed] [Google Scholar]
- 72.He C., Klionsky D. J. (2009) Annu. Rev. Genet. 43, 67–93 [DOI] [PMC free article] [PubMed] [Google Scholar]
- 73.Senkal C. E., Ponnusamy S., Bielawski J., Hannun Y. A., Ogretmen B. (2010) FASEB J. 24, 296–308 [DOI] [PMC free article] [PubMed] [Google Scholar]
- 74.Xu K., Yang Y., Yan M., Zhan J., Fu X., Zheng X. (2010) J. Lipid Res. 51, 2581–2690 [DOI] [PMC free article] [PubMed] [Google Scholar]
- 75.Feingold K. R., Kazemi M. R., Magra A. L., McDonald C. M., Chui L. G., Shigenaga J. K., Patzek S. M., Chan Z. W., Londos C., Grunfeld C. (2010) Atherosclerosis 209, 81–88 [DOI] [PubMed] [Google Scholar]
- 76.Dennis E. A., Deems R. A., Harkewicz R., Quehenberger O., Brown H. A., Milne S. B., Myers D. S., Glass C. K., Hardiman G. T., Reichart D., Merrill A. H., Sullards M. C., Wang E., Murphy R. C., Raetz C. R., Garrett T., Guan Z., Ryan A. C., Russell D. W., McDonald J. G., Thompson B. M., Shaw W. A., Sud M., Zhao Y., Gupta S., Maurya M. R., Fahy E., Subramaniam S. (October5, 2010) J. Biol. Chem. 10.1074/jbc.M110.182915 [DOI] [PMC free article] [PubMed] [Google Scholar]
Associated Data
This section collects any data citations, data availability statements, or supplementary materials included in this article.


