Abstract
Objective
The purpose of the study was to assess the risk of CHD associated with excess weight measured by BMI and waist circumference (WC) in two large cohorts of men and women.
Design, Setting, Subjects
Participants in two prospective cohort studies, the Health Professionals Follow-up Study (N = 27,859 men; age range 39–75 years) and the Nurses’ Health Study (N = 41,534 women; 39–65 years) underwent 16-year follow-up through 2004.
Results
1,823 incident cases of CHD among men and 1,173 cases among women were documented. Compared to men with BMI 18.5 to 22.9 kg/m2, those with a BMI > 30.0 kg/m2 had a multivariate-adjusted RR of CHD of 1.81 (95% CI 1.48 – 2.22). Among women, those with a BMI > 30.0 kg/m2 had a RR of CHD of 2.16 (95% CI 1.81 – 2.58). Compared to men with a WC < 84.0 cm, those with WC of greater than 102.0 cm had a RR of 2.25 (95% CI 1.77 – 2.84). Among women, the RR of CHD was 2.75 (95% CI 2.20 – 3.45) for those with WC of greater than 88.0 cm.
Conclusions
In these analyses from two large ongoing prospective cohort studies, both BMI and WC strongly predicted future risk of CHD. Furthermore, WC thresholds as low as 84.0 cm in men and 71.0 cm in women may be useful in identifying those at increased risk of developing CHD. The findings have broad implications in terms of CHD risk assessment in both clinical practice and epidemiologic studies.
Keywords: obesity, overweight, coronary disease, men, women
Introduction
Coronary heart disease remains the leading cause of mortality in the United States. 1 Obesity is a major public health problem in this country, as its prevalence continues to rise. 2,3 While the relationship between excess weight and the risk of coronary heart disease (CHD) is complex, abdominal obesity is considered to play a fundamental role in the etiology of CHD through adversely affecting several established risk factors. 3–5 Historically, body mass index (BMI) has been used in epidemiologic studies and by public health organizations to define the degrees of overweight and obesity. 6,7 For example, a recent report on BMI and mortality from the CDC found increased cardiovascular disease mortality associated with obesity (BMI ≥ 30 kg/m2), though not with overweight (BMI 25–29.9 kg/m2). 8
However, BMI does not directly assess body fat distribution and is not as good as circumference measures for the measurement of the most metabolically-active intra-abdominal fat. 9 Lean muscle mass also can greatly influence BMI, particularly in athletes. 9 The gradual decrease in lean muscle mass with aging also affects the validity and interpretability of BMI as a marker of adiposity among older populations. 9 Waist circumference (WC) is more strongly correlated to intra-peritoneal adipose tissue mass, as measured by computed tomography (CT) or dual energy x-ray absorptiometry (DXA). 10,11 Furthermore, WC is easy to measure, is feasible to assess in a clinical setting, and contains relatively little measurement error.
The purpose of the current study was to assess the risk of CHD associated with excess weight measured by BMI and WC in two large prospective cohorts of men and women with 16 years of follow-up, overall and by age, and also to determine the threshold for minimum risk associated with abdominal adiposity.
Materials and Methods
Study populations
The Health Professionals Follow-up Study (HPFS) is a prospective closed cohort of 51,529 male health professionals ranging in age from 40 to 75 years at enrollment in 1986, with follow-up data through 2004 available for these analyses In 1986 study participants completed a baseline mailed survey with detailed information about medical history, dietary intake, lifestyle, and demographic information. Every two years subsequently, follow-up questionnaires containing information on interim medical history, dietary intake, and lifestyle were completed. In a 1987 mailing, distinct from the biennial questionnaire mailing, participants were sent a tape measure and instructions for measuring their waist circumference to the nearest ¼ inch. Non-responders received follow-up mailings to increase response, though not to the extent possible with the biennial questionnaire. Criteria for exclusion were 1) known acute myocardial infarction or self-reported angina in 1986 or before, 2) cancer diagnosis, or 3) missing data on BMI (height or weight) or waist circumference. After exclusions, we had WC available on 27,859 (65.8%) of the 42,351 otherwise eligible men. Compared to the full cohort, men who provided WC were slightly older (mean age at baseline 53.9 years vs. 53.6 years for the cohort), thinner (BMI 25.3 kg/m2 vs. 25.5 kg/m2), and less likely to be current smokers (8.8% vs. 9.9%).
The Nurses’ Health Study cohort was established in 1976 with the enrollment of 121,700 female nurses aged 30 to 55 years of age at study entry, with follow-up through 2004 for these analyses. Participants completed baseline and follow-up questionnaires, reporting medical history and health-related behaviors. Beginning in 1980, detailed dietary intake information was assessed by food frequency questionnaire (FFQ) and subsequently updated approximately every two years. On the 1986 questionnaire, participants were asked to use a measuring tape to report their waist circumference to the nearest ¼ inch. Criteria for exclusion from the current analyses were 1) known CHD in 1988 or before, 2) cancer diagnosis, 3) missing data on BMI (height or weight), or waist circumference, 4) death or withdrawal from follow-up prior to 1986. After these exclusions, we had WC available on 41,534 (54.1%) of the 76,834 otherwise eligible women. Compared to the full cohort, women who provided WC were also older (54.6 years vs. 53.9 years), thinner (BMI 24.7 kg/m2 vs. 25.3 kg/m2), and less likely to be current smokers (19.7% vs. 20.5%).
Exposure Measurement
In the HPFS, height and weight were self-reported at baseline. BMI was calculated as weight (kg)/(height (m))2. Similarly, in the NHS, height was reported at study entry in 1976, and combined with the weight reported on the 1986 questionnaire to calculate BMI. In studies of validity of self-report by men and women in the HPFS and other samples, the correlations between self-reported height and weight and direct measurements have been high, r > 0.9. 12–14 BMI was categorized using standard World Health Organization categories for healthy weight, overweight and three categories of obese. The categories of obesity were collapsed into a single category of BMI ≥ 30.0 kg/m2 in the interest of preserving precision of effect estimates. In joint effects analyses the 3 standard categories of healthy 18.5 to 24.9 kg/m2, overweight 25.0 to 29.9 kg/m2, and obese ≥ 30.0 kg/m2 were used. For further analyses, the standard healthy BMI category of 18.5 to 24.9 kg/m2 was divided, to determine the risk associated with modestly increased BMI of 23.0 to 24.9 kg/m2 compared to a reference of 18.5 to 22.9 kg/m2.
As described above, waist circumference was reported via the 1986 questionnaire mailing in the NHS, and a supplementary 1987 mailing in the HPFS. The self-measured WC has been validated in both cohorts, by comparison with the average of two technician-measured WCs in a sample of 123 men and 140 women, with correlation coefficients of 0.95 for men and 0.89 for women. 14 WC was first categorized according to standard clinical guidelines for men (< 94 cm, 94–102 cm, ≥ 102 cm) and women (< 71 cm, 71–88 cm, ≥ 88 cm), corresponding to the standard clinical categories of BMI for healthy, overweight, and obese, respectively To refine these cutpoints and identify the category with lowest risk, the bottom category was further divided into < 84 cm (reference, cutoff approximating the 10th percentile) and modestly increased WC of 84–93.9 cm, while that for women was divided into < 71 cm (approximating the 20th percentile) and 71.0–79.9 cm. These lower WC cutpoints were selected based on the thresholds of risk increase observed in the results by decile, as such representing post-hoc subanalyses.
Outcome Measurement
Incident CHD was defined as any case of acute non fatal myocardial infarction (MI) or fatal CHD outcome occurring between February of 1988 and February of 2004. Physicians unaware of the self-reported risk factor status reviewed the records systematically. Participant deathswere identified from state vital statistics records and theNational Death Index or reported by participants’ families or the postoffice.15 Fatal CHD was determined to have occurred if fatal MIwas confirmed by an autopsy, hospital records or if CHD waslisted on the death certificate as the cause of death, or if itwas listed as an underlying cause ofdeath, and if evidence of previous CHD was present. Details of follow-up and outcome ascertainment have been previously reported. 16–18
Covariates
Information on potential confounding factors, preexisting health conditions and lifestyle behavior choices that have the potential to influence the relationship between obesity and CHD were ascertained from the 1986 questionnaires.
Family history of CHD was reported on the baseline questionnaire, and categorized based on myocardial infarction occurring in either parent prior to age 60 years. The use of hormone replacement therapy was reported among the NHS participants.
Cigarette smoking status was based on baseline survey and categorized as ‘Current’, ‘Former’ and ‘Never’. In the multivariate models, the current smokers were further classified according to three categories of daily cigarette consumption.
Information on dietary intake, saturated fat, polyunsaturated fat, trans fat, folate, vitamin E, and total energy were ascertained by semi-quantitative food frequency questionnaire (FFQ). 19 Total alcohol intake was assessed from beverage-specific questions on the FFQ and grouped into 5 categories based on average grams/day consumed. Intakes were categorized into quintiles and indicators coded for inclusion in the multivariate models. Physical activity was not included in final multivariate models because it is inextricably linked to adiposity and may also be in the causal pathway between adiposity and CHD.
The presence of the clinical conditions of hypertension, hypercholesterolemia, and diabetes were ascertained by self-report on the baseline questionnaire, categorized as present or absent. Validation studies of self-reported diagnoses among men have shown specificities of >85% for hypertension, hypercholesterolemia, and diabetes in comparison to medical record review. 20, 21 These baseline comorbid conditions were included in final multivariate models to adjust for confounding effects, with the intention of providing conservative estimates of the association between adiposity and CHD risk, recognizing that some degree of attenuation might be expected.
Statistical Analysis
Cox proportional hazard regression was used to model the relationship between adiposity and CHD outcome. Parallel but separate analyses were conducted with the data from the men’s and women’s cohorts. All analyses were adjusted for age. Potential confounding factors were considered a priori, based on known risk factors for CHD.
The main aim of the analyses was to characterize the relationship between overweight/obesity and subsequent risk of CHD, and steps were taken to minimize the possibility of including individual person-time representing weight loss due to pre-clinical, undiagnosed disease. To address concerns over this possible bias, or reverse causation, several strategies were undertaken. The measures of BMI and waist circumference were recorded at baseline (1986) only, and not updated during follow-up. To achieve a minimum two year lag in assignment of exposures and covariates during follow-up, cases and follow-up time for the first two years after baseline, that is from 1986 – 1988, were excluded from the analyses. Although all multivariate models included terms to adjust for the confounding effects of cigarette smoking, separate analyses were also conducted, restricted to never smokers, to address the possibility of residual confounding. 22
The assumption of proportional hazards was tested formally by introducing an interaction term for time by exposure, and assessing the contribution of this interaction to each final model, by likelihood ratio test.
BMI and WC, each in the three standard and corresponding clinical categories of healthy, overweight, and obese were first modeled jointly, controlling for covariates. Likelihood ratio tests (LRT) were used to assess the additional contribution of WC to models containing BMI, and vice versa, as well as to assess interaction. In all subsequent models and analyses, either BMI or WC terms were included, but not both.
To allow for direct comparison of BMI and waist circumference as predictors of CHD risk, these exposure variables were categorized on a decile scale, and relative risks estimated for each decile of BMI or WC, compared with the reference group of the first decile. Non-nested multivariate proportional hazard models, identically specified with the exception of the terms for either BMI or WC, were compared using Akaike’s Information Criterion (AIC), with the lower value of AIC indicating better model fit. 23 The AIC indicates which of two non-nested models better fits the data, though does not provide a statistical test result.
The baseline CHD-free survival functions were estimated using multivariate-adjusted proportional hazard models and the covariate-adjusted survivorship function, 24 run separately for men and women divided into three categories of age at baseline, < 55, 55–59.9, and ≥ 60 years.
Results
During the follow-up from 1988 through 2004, a total of 1,823 cases of CHD were recorded among the 27,859 eligible men, and 1,173 cases of CHD were recorded among the 41,534 eligible women. Table 1 shows the age- and multivariate-adjusted relative risks (RRs) of CHD by BMI category for both the HPFS men and the NHS women. The first multivariate model column shows the RRs associated with CHD for the model without controlling for likely biological mediators, including baseline hypertension, hypercholesterolemia, and diabetes. Addition of these terms did attenuate the effect estimates, as seen in the second multivariate column. Compared to men with BMI 18.5 to 22.9 kg/m2, those with a BMI 23.0 to 24.9 kg/m2 had a multivariate-adjusted RR of CHD of 1.22 (95 percent confidence interval (CI) 1.04 – 1.43). The multivariate-adjusted RR increased further with degree of excess weight, to 1.71 (95% CI 1.44 – 2.02) among men with BMI 27.0 to 29.9 kg/m2, and to 1.81 (95% CI 1.48 – 2.22) for BMI of ≥ 30.0 kg/m2. Compared to women with BMI 18.5 to 22.9 kg/m2, those with a BMI 23.0 to 24.9 kg/m2 had a multivariate-adjusted RR of CHD of 1.10 (95% CI 0.93 – 1.30). The RR increased further to 1.53 (95% CI 1.27 – 1.84) among women with BMI 27.0 to 29.9 kg/m2, and to 2.16 (95% CI 1.81 – 2.58) with obesity, BMI of ≥ 30.0 kg/m2.
Table 1.
Relative Risk of CHD, by category of BMI among men, the Health Professionals Follow-up Study*, and women, the Nurses’ Health Study#
| Men | ||||||
|---|---|---|---|---|---|---|
| BMI | Cases | Person-Years | Rate (105 P-Y)−1 | Age adjusted RR (95% CI) | Multivariate without baseline comorbidities RR (95% CI) | Multivariate RR* (95% CI) |
| 18.5–22.9 | 239 | 71,089 | 336 | 1.00 (Ref) | 1.00 (Ref) | |
| 23.0–24.9 | 461 | 108,924 | 423 | 1.23 (1.05–1.44) | 1.25 (1.06–1.46) | 1.22 (1.04–1.43) |
| 25.0–26.9 | 549 | 96,119 | 571 | 1.61 (1.38–1.88) | 1.58 (1.35–1.85) | 1.53 (1.31–1.78) |
| 27.0–29.9 | 397 | 60,933 | 652 | 1.86 (1.58–2.19) | 1.82 (1.54–2.15) | 1.71 (1.44–2.02) |
| 30.0+ | 177 | 24,439 | 724 | 2.18 (1.78–2.66) | 2.05 (1.67–2.51) | 1.81 (1.48–2.22) |
| Women | ||||||
| BMI | Cases | Person-Years | Rate (105 P-Y) −1 | Age adjusted RR (95% CI) | Multivariate without baseline comorbidities RR (95% CI) | Multivariate RR# (95% CI) |
| 18.5–22.9 | 350 | 261,302 | 134 | 1.00 (Ref) | 1.00 (Ref) | |
| 23.0–24.9 | 229 | 141,548 | 162 | 1.07 (0.90–1.27) | 1.11 (0.94–1.32) | 1.10 (0.93–1.30) |
| 25.0–26.9 | 176 | 88,048 | 200 | 1.31 (1.09–1.57) | 1.38 (1.15–1.66) | 1.34 (1.11–1.61) |
| 27.0–29.9 | 187 | 76,121 | 246 | 1.58 (1.32–1.89) | 1.62 (1.35–1.94) | 1.53 (1.27–1.84) |
| 30.0+ | 231 | 65,888 | 351 | 2.39 (2.02–2.83) | 2.42 (2.03–2.88) | 2.16 (1.81–2.58) |
Adjusted for age, baseline hypercholesterolemia, baseline hypertension, baseline diabetes, family history of myocardial infarction, smoking, height, marital status, profession, intake of alcohol, saturated fat, polyunsaturated fat, trans fat, folate, vitamin E, and total energy.
Adjusted for age, baseline hypercholesterolemia, baseline hypertension, baseline diabetes, family history of myocardial infarction, smoking, height, marital status, hormone replacement therapy, intake of alcohol, saturated fat, polyunsaturated fat, trans fat, folate, vitamin E, andtotal energy.
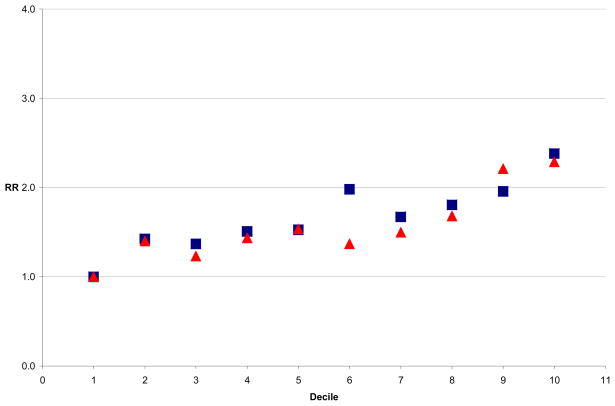
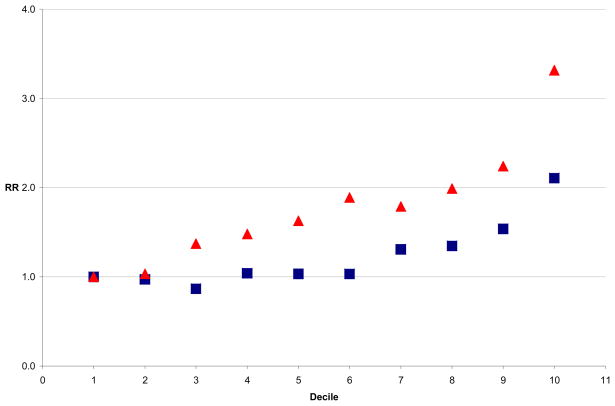
Table 2 shows the age- and multivariate-adjusted relative risks (RRs) of CHD in both the men and women, by standard categories of WC as well as RRs using a more restrictive reference group based on approximately the lowest 10% of the waist distribution for men and the lowest 20% for women. These lower cutpoints were selected following the observation of increased risk at these levels in analyses based on WC deciles, as in Figures 1 and 2. Again, inclusion of baseline hypertension, hypercholesterolemia, and diabetes in the final multivariate model resulted in attenuation of the RRs. Compared to men with a WC < 84.0 cm, those with WC of 84.0 to 93.9 cm had a multivariate-adjusted RR of CHD of 1.39 (95% CI 1.11 – 1.74) and those with WC of greater than 102.0 cm had a RR of 2.25 (95% CI 1.77 – 2.84). Among the women, compared to those with WC < 71.0 cm, the RR was 1.57 (95% CI 1.26 – 1.95) among those with WC of 71.0 to 79.9 cm and further increased to 2.75 (95% CI 2.20 – 3.45) among those with WC of greater than 88.0 cm. Of note, 40.4% (737/1,823) of the cases in the men occurred among individuals below the traditional WC threshold of 94.0 cm. In the women, 41.9% (491/1,173) of cases occurred in women with WC below 80.0 cm.
Table 2.
Relative Risk of CHD, by category of waist circumference among men, the Health Professionals Follow-up Study*, and women, the Nurses’ Health Study#
| Men | ||||||||
|---|---|---|---|---|---|---|---|---|
| WC | Cases | Person-Years | Rate (105 P-Y)−1 | Age adjusted RR (95% CI) | Multivariate without baseline comorbidities RR (95% CI) | Multivariate RR* (95% CI) | Multivariate without baseline comorbidities RR (95% CI) | Multivariate RR* (95% CI) |
| < 84.0 | 90 | 36,943 | 244 | 1.00 (Ref) | 1.00 (Ref) | 1.00 (Ref) | ||
| 84.0 – 93.9 | 647 | 159,130 | 407 | 1.41 (1.13–1.76) | 1.45 (1.15–1.81) | 1.39 (1.11–1.74) | ||
| 94.0 – 102.0 | 533 | 99,893 | 534 | 1.61 (1.29–2.02) | 1.67 (1.32–2.10) | 1.55 1.23–1.95) | 1.21 (1.08–1.36) | 1.16 (1.01–1.34) |
| > 102.0 | 553 | 65,538 | 844 | 2.49 (1.99–3.13) | 2.51 (1.99–3.17) | 2.25 (1.77–2.84) | 1.81 (1.61–2.04) | 1.68 (1.46–1.94) |
| Women | ||||||||
| WC | Cases | Person-Years | Rate (105 P-Y)−1 | Age adjusted RR (95% CI) | Multivariate without baseline comorbidities RR (95% CI) | Multivariate RR* (95% CI) | Multivariate without baseline comorbidities RR (95% CI) | Multivariate RR* (95% CI) |
| < 71.0 | 107 | 127,301 | 84 | 1.00 (Ref) | 1.00 (Ref) | 1.00 (Ref) | ||
| 71.0 – 79.9 | 384 | 255,900 | 150 | 1.50 (1.21–1.87) | 1.57 (1.26–1.96) | 1.57 (1.26–1.95) | ||
| 80.0 – 88.0 | 307 | 139,201 | 221 | 1.92 (1.53–2.40) | 1.97 (1.57–2.47) | 1.90 (1.51–2.38) | 1.40 (1.21–1.62) | 1.35 (1.17–1.56) |
| > 88.0 | 375 | 110,505 | 339 | 3.01 (2.42–3.74) | 2.99 (2.39–3.74) | 2.75 (2.20–3.45) | 2.12 (1.84–2.44) | 1.95 (1.69–2.26) |
Adjusted for age, baseline hypercholesterolemia, baseline hypertension, baseline diabetes, family history of myocardial infarction, smoking, height, marital status, profession, intake of alcohol, saturated fat, polyunsaturated fat, trans fat, folate, vitamin E, and total energy.
Adjusted for age, baseline hypercholesterolemia, baseline hypertension, baseline diabetes, family history of myocardial infarction, smoking, height, marital status, hormone replacement therapy, intake of alcohol, saturated fat, polyunsaturated fat, trans fat, folate, vitamin E, andtotal energy.
Figure 1.
Relative Risk of CHD by Decile of BMI and WC, HPFS Men
 BMI
BMI
 WC
WC
Figure 2.
Relative Risk of CHD by Decile of BMI and WC, NHS Women
 BMI
BMI
 WC
WC
Multivariate models containing both BMI and WC, each categorized in the three standard and corresponding clinical categories of healthy, overweight, and obese were run, demonstrating significant main effects contribution to the prediction of CHD by both BMI and WC among both HPFS men and NHS women (LRT, P<0.0001). In each case, addition of either WC or BMI to the model containing the other resulted in substantial attenuation of CHD risk estimates. Among men, addition of BMI contributed significantly (P=0.003) to the model containing WC, as did addition of WC (P<0.0001) to the model containing BMI. There was no significant interaction. Among women, addition of BMI contributed significantly (P=0.004) to the model containing WC, as did addition of WC (P=0.0002) to the model containing BMI, with no significant interaction. BMI and WC were highly correlated both in men (r=0.79) and women (r=0.81).
To compare BMI and WC directly across the whole distribution, we explored the RR of CHD by BMI and WC deciles. In the men, risk of CHD increased by decile of both BMI and WC. Figure 1 shows the multivariate adjusted relative risk (RR) of CHD by decile of BMI (in blue) and decile of WC (in red) among the men, with the first decile in each case serving as the reference category. We saw a similar pattern among women (Figure 2), although the WC was more consistently a stronger predictor of CHD risk. In both men and women, the model which included WC deciles fit the data better than that with BMI deciles, by the AIC method. These findings suggested that CHD risk began to increase with the second decile of WC (approximately 84 cm) in the men and with the third decile of WC (71 cm) in the women, prompting consideration of these lower thresholds for risk. In analyses restricted to never smokers among both the men and women, the results were similar (data not shown). Addition of aspirin intake or physical activity to multivariate models did not result in substantial change in estimates.
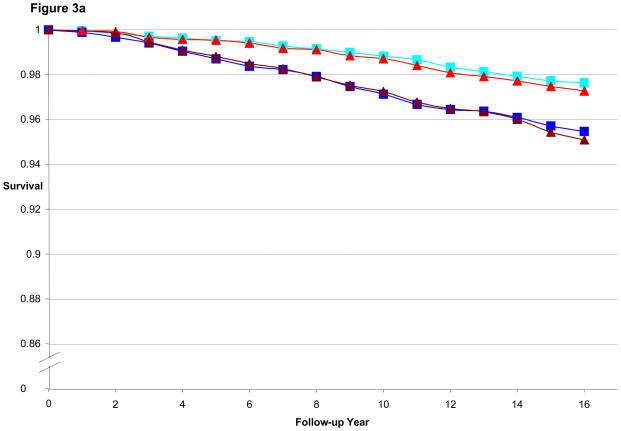
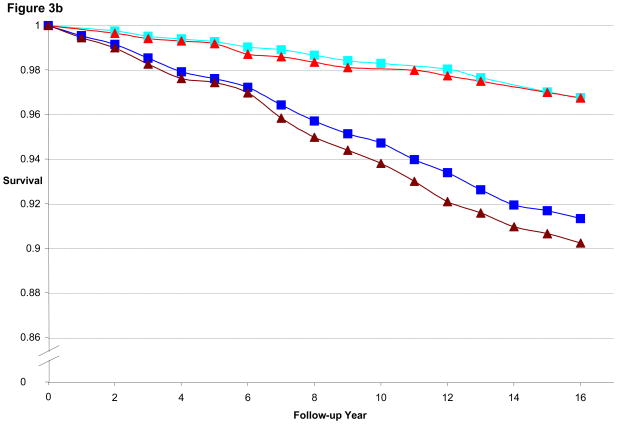
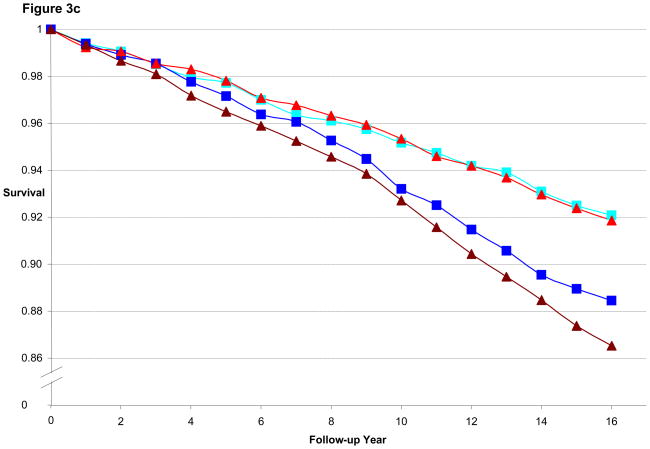
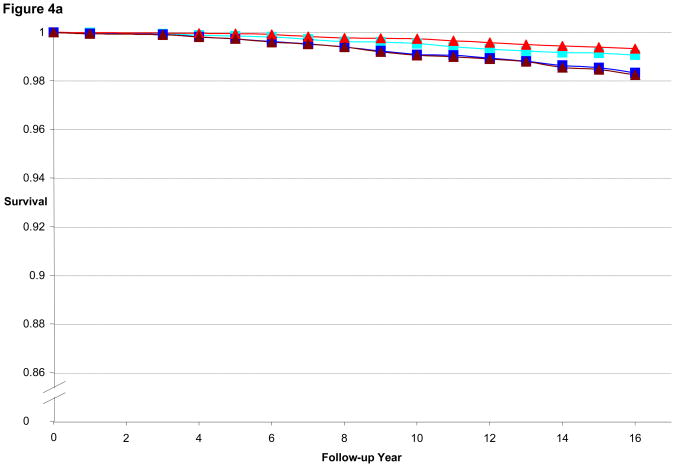
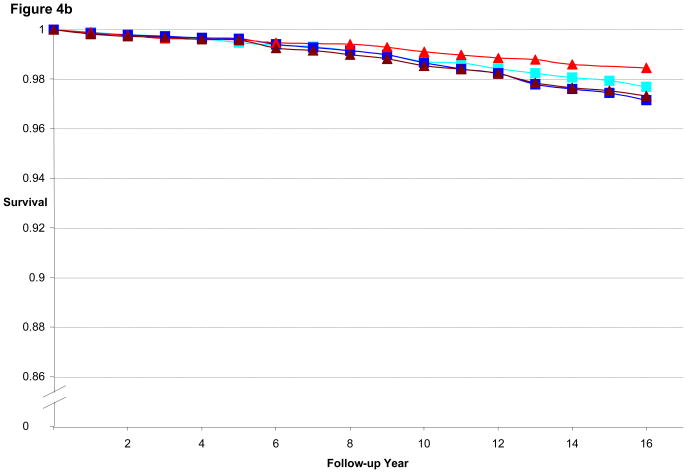
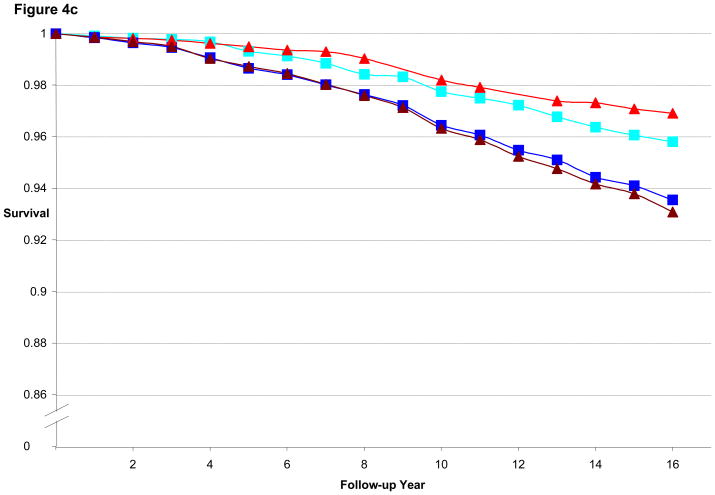
To address the possibility that using different reference groups could affect the direct interpretation of the comparison of BMI and WC, additional analyses were performed using the multivariate-adjusted proportional hazards regression models to estimate CHD-free survival during follow-up in each cohort. These analyses were conducted separately for men and women, using the age categories of <55, 55 to 59.9 and 60 and older at baseline, comparing CHD-free survival of highest vs. lowest quintile of BMI or WC.
Figure 3a illustrates the CHD-free survival curves for men < 55 years old at baseline in the HPFS, with fairly similar curves evident for the 1st quintile of BMI and WC as well as for 5th quintile of BMI and WC. Figure 3b is the CHD-free survival curves for men aged 55 to 59.9. We found a wider gap between 5th and 1st quintile for WC than for BMI, consistent with the better predictive performance of WC (by AIC) in that age group. Finally, Figure 3c is the CHD-free survival curves for men aged 60 and older. CHD-free survival decreases with age and the gap in survival between 5th and 1st quintile curves is again greater for WC than for BMI. In the women, similar to the men, the difference in curves between WC and BMI became more divergent with older age, as shown in Figures 4a–c.
Figure 3.
Figure 3a. Multivariate Adjusted 16-year CHD-free Survival Estimates by Quintile of BMI or Waist Circumference Among Men < 55 Years of Age in 1988, HPFS
Figure 3b. Multivariate Adjusted 16-year CHD-free Survival Estimates by Quintile of BMI or Waist Circumference Among Men 55 to 59.9 Years of Age in 1988, HPFS
Figure 3c. Multivariate Adjusted 16-year CHD-free Survival Estimates by Quintile of BMI or Waist Circumference Among Men ≥ 60 Years of Age in 1988, HPFS
 Q1 BMI
 Q5 BMI
 Q1 WC
Q1 WC
 Q5 WC
Q5 WC
Figure 4.
Figure 4a. Multivariate Adjusted 16-year CHD-free Survival Estimates by Quintile of BMI or Waist Circumference among Women < 55 Years of Age in 1988, NHS
Figure 4b. Multivariate Adjusted 16-year CHD-free Survival Estimates by Quintile of BMI or Waist Circumference among Women 55 to 59.9 Years of Age in 1988, NHS
Figure 4c. Multivariate Adjusted 16-year CHD-free Survival Estimates by Quintile of BMI or Waist Circumference among Women ≥ 60 Years of Age in 1988, NHS
 Q1 BMI
 Q5 BMI
 Q1 WC
Q1 WC
 Q5 WC
Q5 WC
Discussion
In these new analyses of BMI and waist circumference from two large ongoing prospective cohort studies with over 3,000 incident CHD endpoints combined, both BMI and WC strongly predicted future risk of CHD. In addition, both WC and BMI added significantly to models containing the other measure in predicting CHD-risk. WC appeared to predict CHD risk better than did BMI among men and women aged 60 years and older. Furthermore, our results suggest that lower WC cutoffs may be useful in identifying an ideal WC threshold, above which there is significantly greater risk of CHD.
The present study has several major strengths, which include its prospective design, the large study populations across a broad age range, the large number of incident cases of CHD among men and women without known CHD at baseline, the length of long term follow-up, and the use of validated measures of exposures and covariates. The HPFS and NHS cohorts are well suited for addressing concerns about possible reverse causation, 22 that is a change in BMI or WC due to preclinical or non-cardiac disease (that increases near term risk of MI). By lagging covariates and excluding incident cases in the first two years of follow-up, the impact on effect estimates should be minimized. 22,25 In addition, the relatively homogenous nature of these cohorts of health professionals reduces potential confounding factors, particularly those commonly associated with socio-economic status or access to medical care.
Adiposity is a strong independent risk factor for hypertension, 26 hypercholesterolemia, 27 and diabetes, 28 and each of these intermediates is associated with subsequent development of CHD. 29,30 While the basic mechanisms by which obesity leads to CHD have not been fully defined, there is evidence to suggest that chronic inflammation and cytokines secreted by adipocytes also may be involved. 27–29 Abdominal obesity, especially when measured by computed tomography scan or DXA, is associated with dyslipidemia, hypertension, hypercoagulable states, hyperglycemia and adipokine related insulin resistance, 31–33 all factors which increase CHD. WC is highly correlated with central fat mass as assessed by DXA methods. 34
Several authors have reported the CHD risk associated with BMI, WC, or both in prospective studies in men and/or women. 35–50 Some have found WC (or waist hip ratio) better than BMI, while others have been mixed. Few have compared BMI and WC risk performance on comparable (e.g. quantile) scales or modeled CHD-survival adjusting for potential confounding factors. Many previous studies have lacked the large numbers of cases that are required for precise estimates for various sub-groups and sub-analyses. In particular, the relative difference in CHD risk associated with anthropometric measures has not been adequately examined across age strata.
In our previous analyses of women and women from these cohorts with shorter follow-up, we also found WC measures to be modestly stronger predictors of CHD risk than BMI. 39,41,44,45 With further follow-up, larger numbers of older participants, and greater numbers of cases in each age category, the differences between WC and BMI persist and are stronger, especially among older participants.
The current report updates our follow-up through 2004, now including 1,823 CHD cases among men and 1,179 cases among women since 1988. The large number of incident cases of CHD allows greater power for analyses using relatively small category ranges of both WC and BMI, as well as age. By using the same analytic methods in the two cohorts, direct comparison of CHD risk in men and women is feasible, now with substantially longer follow-up. Examination of the covariate-adjusted CHD-free survivorship function curves for men and women in different age ranges allows a clearer appreciation of the relationships between WC, BMI and CHD risk for both sexes.
BMI might best be considered as a combined measure of both lean body mass and total fat mass. With a relatively small range of lean (muscle mass) in younger adults in most populations, variability in BMI reflects primarily variability in fat mass. BMI may not reflect adiposity as well in older adults, however, as loss of lean body mass with age may contribute substantially to variability in BMI. 9 Waist circumference may be considered a measure of both total and abdominal adiposity,49 and likely visceral obesity as well. Furthermore, WC is less affected by lean muscle mass loss with increasing age. As such, WC may provide a more appropriate and sensitive measure of CHD risk associated with the metabolic effects of chronic excess adiposity over the range observed in these cohorts of men and women.
The standard WC thresholds of 94.0 cm and 102.0 cm in men and 80.0 and 88.0 cm in women were originally selected based on their ability to identify individuals with overweight and obesity, respectively, as measured by BMI. 51 However, if WC is a better measure than BMI for classifying “at risk” individuals, then ideally BMI should not be used as a reference to define WC thresholds. These WC thresholds have since been broadly accepted and subsequently used as cut points for expert panel recommendations and clinical action criteria. 52 Our findings indicate that while men with WC above 94.0 cm and women above 80.0 cm are at greater risk of CHD, there is still a substantial gradient in risk of CHD associated with WC below these cut points. We suggest that these new lower WC thresholds of 84.0 cm for men and 71.0 cm for women be considered as the lowest risk category after confirmation in other studies with a different population base.
In summary, we found that in our study populations of middle aged and older men and women, both BMI and waist circumference were strongly associated with risk of CHD. WC may predict CHD risk better than does BMI among men and women 60 years of age and older. In post-hoc analyses, we report evidence that WC thresholds as low as 84.0 cm in men and 71.0 cm in women may be useful in identifying those at increased risk of developing CHD. The findings have broad implications in terms of CHD risk assessment in both clinical practice and epidemiologic studies. The potential applications of these findings are particularly important in the context of continued increases in the prevalence of overweight and obesity among both men and women on a population-wide basis. 53
Acknowledgments
Funding/Support
This work was funded by NIH grants HL34594 and CA55075, and by Sanofi-Aventis.
Footnotes
Disclosures
There are no conflicts of interest to disclose.
References
- 1.Williams CL, Hayman LL, Daniels SR, Robinson TN, Steinberger J, Paridon S, Bazzarre T. Cardiovascular health in childhood: A statement for health professionals from the Committee on Atherosclerosis, Hypertension, and Obesity in the Young (AHOY) of the Council on Cardiovascular Disease in the Young, American Heart Association. Circulation. 2002;106(1):143–60. doi: 10.1161/01.cir.0000019555.61092.9e. [DOI] [PubMed] [Google Scholar]
- 2.US Dept Health and Human Services. The Surgeon General’s Call to Action to Prevent and Decrease Overweight and Obesity. Rockville, MD: US Department of Health and Human Services, Public Health Service, Office of the Surgeon General; 2001. [Google Scholar]
- 3.National Institutes of Health. Clinical guidelines on the identification, evaluation, and treatment of overweight and obesity in adults — the evidence report. Obes Res. 1998;6 (suppl 2):51–209S. [PubMed] [Google Scholar]
- 4.Björntorp P. Abdominal fat distribution and the metabolic syndrome. J Cardiovasc Pharmacol. 1992;20 (suppl 8):S26–8. [PubMed] [Google Scholar]
- 5.National Task Force on the Prevention and Treatment of Obesity. Overweight, obesity, and health risk. Arch Intern Med. 2000;160:898–904. doi: 10.1001/archinte.160.7.898. [DOI] [PubMed] [Google Scholar]
- 6.NIH Publication No. 98–4083. U.S. Department of Health and Human Services; National Institutes of Health; 1998. Clinical Guidelines on the Identification, Evaluation, and Treatment of Overweight and Obesity in Adults: The Evidence Report. [Google Scholar]
- 7.World Health Organization. WHO technical report series. Vol. 894. Geneva: WHO; 2004. Obesity: preventing and managing the global epidemic. [PubMed] [Google Scholar]
- 8.Flegal KM, Graubard BI, Williamson DF, Gail MH. Cause-specific excess deaths associated with underweight, overweight, and obesity. JAMA. 2007;298(17):2028–37. doi: 10.1001/jama.298.17.2028. [DOI] [PubMed] [Google Scholar]
- 9.Willett WC. Nutritional Epidemiology. New York: Oxford University Press; 1998. [Google Scholar]
- 10.Jansen I, Heymsfield SB, Allison DB, et al. Body mass index and waist circumference independently contribute to the prediction of nonabdominal, abdominal subcutaneous, and visceral fat. Am J Clin Nutr. 2002;75:683–8. doi: 10.1093/ajcn/75.4.683. [DOI] [PubMed] [Google Scholar]
- 11.Chan DC, Watts GF, Barrett PHR, et al. Waist circumference, waist-hip ratio and body mass index as predictors of adipose tissue compartments in men. Q J Med. 2003;96:441–7. doi: 10.1093/qjmed/hcg069. [DOI] [PubMed] [Google Scholar]
- 12.Jeffrey R. Bias in reported body weight as a function of education, occupation, health and weight concern. Addict Behav. 1996;21:217–222. doi: 10.1016/0306-4603(95)00050-x. [DOI] [PubMed] [Google Scholar]
- 13.Spencer EA, Appleby PN, Davey GK, Key TJ. Validity of self-reported height and weight in 4808 EPIC-Oxford participants. Public Health Nutr. 2002;5(4):561–565. doi: 10.1079/PHN2001322. [DOI] [PubMed] [Google Scholar]
- 14.Rimm EB, Stampfer MJ, Colditz GA. Validity of self-reported waist and hip circumferences in men and women. Epidemiology. 1990;1:466–73. doi: 10.1097/00001648-199011000-00009. [DOI] [PubMed] [Google Scholar]
- 15.Stampfer MJ, Willett WC, Speizer FE, Dysert DC, Lipnick R, Rosner B, Hennekens CH. Test of the National Death Index. American Journal of Epidemiology. 1984;119(5):837–9. doi: 10.1093/oxfordjournals.aje.a113804. [DOI] [PubMed] [Google Scholar]
- 16.Grobbee DE, Rimm EB, Giovannuci E, Colditz GA, Stampfer MJ, Willett WC. Coffee, caffeine and cardiovascular disease in men. N Engl J Med. 1990;323:1026–1032. doi: 10.1056/NEJM199010113231504. [DOI] [PubMed] [Google Scholar]
- 17.Willett WC, Green A, Stampfer MJ, Speizer FE, Colditz GA, Rosner B, Monson RR, Stason W, Hennekens CH. Relative and absolute excess risks of coronary heart disease among women who smoke cigarettes. N Engl J Med. 1987;317:1303–1309. doi: 10.1056/NEJM198711193172102. [DOI] [PubMed] [Google Scholar]
- 18.Lopez-Garcia E, van Dam RM, Willett WC, Rimm EB, Manson JE, Stampfer MJ, Rexrode KM, Hu FB. Coffee consumption and coronary heart disease in men and women: a prospective cohort study. Circulation. 2006 May 2;113(17):2045–53. doi: 10.1161/CIRCULATIONAHA.105.598664. [DOI] [PubMed] [Google Scholar]
- 19.Rimm EB, Giovannucci EL, Stampfer MJ, Colditz GA, Litin LB, Willett WC. Reproducibility and validity of an expanded self-administered semiquantitative food frequency questionnaire among male health professionals. Am J Epidemiol. 1992;135(10):1114–26. doi: 10.1093/oxfordjournals.aje.a116211. [DOI] [PubMed] [Google Scholar]
- 20.Bowlin SJ, Morrill BD, Nafziger AN, Jenkins PL, Lewis C, Pearson TA. Validity of cardiovascular disease risk factors assessed by telephone survey: the Behavioral Risk Factor Survey. Clin Epidemiol. 1993;46(6):561–71. doi: 10.1016/0895-4356(93)90129-o. [DOI] [PubMed] [Google Scholar]
- 21.Colditz GA, Martin P, Stampfer MJ, Willett WC, Sampson L, Rosner B, Hennekens CH, Speizer FE. Validation of questionnaire information on risk factors and disease outcomes in a prospective cohort study of women. Am J Epidemiol. 1986;123(5):894–900. doi: 10.1093/oxfordjournals.aje.a114319. [DOI] [PubMed] [Google Scholar]
- 22.Willett WC, Hu FB, Colditz GA, Manson JE. Underweight, overweight, obesity, and excess deaths. JAMA. 2005;294:551. doi: 10.1001/jama.294.5.551-a. [DOI] [PubMed] [Google Scholar]
- 23.Lee ET, Wang W. Statistical Methods for Survival Data Analysis. 3. Hoboken, NJ: John Wiley & Sons; 2003. [Google Scholar]
- 24.Hosmer D, Lemeshow S. Applied Survival Analysis. John Wiley & Sons, Inc; New York: 1999. [Google Scholar]
- 25.Pradhan AD, Skerrett PJ, Manson JE. Obesity, diabetes, and coronary risk in women. J Cardiovasc Risk. 2002 Dec;9(6):323–30. doi: 10.1097/01.hjr.0000044513.34172.83. [DOI] [PubMed] [Google Scholar]
- 26.Hu G, Barengo NC, Tuomilehto J, Lakka TA, Nissinen A, Jousilahti P. Relationship of physical activity and body mass index to the risk of hypertension: a prospective study in Finland. Hypertension. 2004;43:25–30. doi: 10.1161/01.HYP.0000107400.72456.19. [DOI] [PubMed] [Google Scholar]
- 27.Gostynski M, Gutzwiller F, Kuulasmaa K, Doring A, Ferrario M, Grafnetter D, Pajak A. Analysis of the relationship between total cholesterol, age, body mass index among males and females in the WHO MONICA Project. Int J Obes Relat Metab Disord. 2004;28:1082–1090. doi: 10.1038/sj.ijo.0802714. [DOI] [PubMed] [Google Scholar]
- 28.Manson J, Colditz G, Stampfer M. A prospective study of maturity-onset diabtetes mellitus and risk of coronary heart disease and stroke in women. Arch Intern Med. 1991;151:1141–1147. [PubMed] [Google Scholar]
- 29.Stamler J, Stamler R, Neaton JD, et al. Low risk-factor profile and long-term cardiovascular and noncardiovascular mortality and life expectancy: findings for 5 large cohorts of young adult and middle-aged men and women. JAMA. 1999;282:2012–2018. doi: 10.1001/jama.282.21.2012. [DOI] [PubMed] [Google Scholar]
- 30.Khot UNKM, Bajzer CT, Sapp SK, Ohman EM, Brener SJ, Ellis SG, Lincoff AM, Topol EJ. Prevalence of conventional risk factors in patients with coronary heart disease. JAMA. 2003;290(7):898–904. doi: 10.1001/jama.290.7.898. [DOI] [PubMed] [Google Scholar]
- 31.Eckel RH, Grundy SM, Zimmet PZ. The metabolic syndrome. Lancet. 2005;365(9468):1415–28. doi: 10.1016/S0140-6736(05)66378-7. [DOI] [PubMed] [Google Scholar]
- 32.Sundell J. Obesity and diabetes as risk factors for coronary artery disease: from the epidemiological aspect to the initial vascular mechanisms. Diabetes Obes Metab. 2005 Jan;7:9–20. doi: 10.1111/j.1463-1326.2004.00375.x. [DOI] [PubMed] [Google Scholar]
- 33.Pou KM, Massaro JM, Hoffmann U, Vasan RS, Maurovich-Horvat P, Larson MG, Keaney JF, Jr, Meigs JB, Lipinska I, Kathiresan S, Murabito JM, O’Donnell CJ, Benjamin EJ, Fox CS. Visceral and subcutaneous adipose tissue volumes are cross-sectionally related to markers of inflammation and oxidative stress: the Framingham Heart Study. Circulation. 2007 Sep 11;116(11):1234–41. doi: 10.1161/CIRCULATIONAHA.107.710509. [DOI] [PubMed] [Google Scholar]
- 34.Ketel IJ, Volman MN, Seidell JC, Stehouwer CD, Twisk JW, Lambalk CB. Superiority of skinfold measurements and waist over waist-to-hip ratio for determination of body fat distribution in a population-based cohort of Caucasian Dutch adults. Eur J Endocrinol. 2007;156(6):655–61. doi: 10.1530/EJE-06-0730. [DOI] [PubMed] [Google Scholar]
- 35.Larsson B, Svardsudd K, Welin L, Wilhelmsen L, Bjorntorp P, Tibblin G. Abdominal adipose tissue distribution, obesity, and risk of cardiovascular disease and death: 13 year follow up of participants in the study of men born in 1913. Br Med J (Clin Res Ed) 1984;288:1401–1404. doi: 10.1136/bmj.288.6428.1401. [DOI] [PMC free article] [PubMed] [Google Scholar]
- 36.Lapidus L, Bengtsson C, Larsson B, Pennert K, Rybo E, Sjostrom L. Distribution of adipose tissue and risk of cardiovascular disease and death: a 12 year follow up of participants in the population study of women in Gothenburg, Sweden. Br Med J (Clin Res Ed) 1984;289:1257–1261. doi: 10.1136/bmj.289.6454.1257. [DOI] [PMC free article] [PubMed] [Google Scholar]
- 37.Higgins M, Kannel W, Garrison R, Pinsky J, Stokes J., III Hazards of obesity--the Framingham experience. Acta Med Scand Suppl. 1988;723:23–36. doi: 10.1111/j.0954-6820.1987.tb05925.x. [DOI] [PubMed] [Google Scholar]
- 38.Terry RB, Page WF, Haskell WL. Waist/hip ratio, body mass index and premature cardiovascular disease mortality in US Army veterans during a twenty-three year follow-up study. Int J Obes Relat Metab Disord. 1992;16:417–423. [PubMed] [Google Scholar]
- 39.Rimm EB, Stampfer MJ, Giovannucci E, Ascherio A, Spiegelman D, Colditz GA, Willett WC. Body size and fat distribution as predictors of coronary heart disease among middle-aged and older US men. Am J Epidemiol. 1995;141:1117–1127. doi: 10.1093/oxfordjournals.aje.a117385. [DOI] [PubMed] [Google Scholar]
- 40.Folsom AR, Stevens J, Schreiner PJ, McGovern PG. Body mass index, waist/hip ratio, and coronary heart disease incidence in African Americans and whites. Atherosclerosis Risk in Communities Study Investigators. Am J Epidemiol. 1998;148:1187–1194. doi: 10.1093/oxfordjournals.aje.a009608. [DOI] [PubMed] [Google Scholar]
- 41.Rexrode KM, Carey VJ, Hennekens CH, Walters EE, Colditz GA, Stampfer MJ, Willett WC, Manson JE. Abdominal adiposity and coronary heart disease in women. JAMA. 1998;280:1843–1848. doi: 10.1001/jama.280.21.1843. [DOI] [PubMed] [Google Scholar]
- 42.Fujimoto WY, Bergstrom RW, Boyko EJ, Chen KW, Leonetti DL, Newell-Morris L, Shofer JB, Wahl PW. Visceral adiposity and incident coronary heart disease in Japanese-American men. The 10-year follow-up results of the Seattle Japanese-American Community Diabetes Study. Diabetes Care. 1999;22:1808–1812. doi: 10.2337/diacare.22.11.1808. [DOI] [PubMed] [Google Scholar]
- 43.Folsom AR, Kushi LH, Anderson KE, Mink PJ, Olson JE, Hong CP, Sellers TA, Lazovich D, Prineas RJ. Associations of general and abdominal obesity with multiple health outcomes in older women: the Iowa Women’s Health Study. Arch Intern Med. 2000;160:2117–2128. doi: 10.1001/archinte.160.14.2117. [DOI] [PubMed] [Google Scholar]
- 44.Baik I, Ascherio A, Rimm EB, Giovannucci E, Spiegelman D, Stampfer MJ, Willett WC. Adiposity and mortality in men. American Journal of Epidemiology. 2000;152(3):264–71. doi: 10.1093/aje/152.3.264. [DOI] [PubMed] [Google Scholar]
- 45.Rexrode KM, Buring JE, Manson JE. Abdominal and total adiposity and risk of coronary heart disease in men. Int J Obes Relat Metab Disord. 2001;25:1047–1056. doi: 10.1038/sj.ijo.0801615. [DOI] [PubMed] [Google Scholar]
- 46.Welborn TA, Dhaliwal SS, Bennett SA. Waist-hip ratio is the dominant risk factor predicting cardiovascular death in Australia. Med J Aust. 2003;179:580–585. doi: 10.5694/j.1326-5377.2003.tb05704.x. [DOI] [PubMed] [Google Scholar]
- 47.Lakka HM, Lakka TA, Tuomilehto J, Salonen JT. Abdominal obesity is associated with increased risk of acute coronary events in men. Eur Heart J. 2002;23:706–713. doi: 10.1053/euhj.2001.2889. [DOI] [PubMed] [Google Scholar]
- 48.Heitmann BL, Frederiksen P, Lissner L. Hip circumference and cardiovascular morbidity and mortality in men and women. Obes Res. 2004;12:482–487. doi: 10.1038/oby.2004.54. [DOI] [PubMed] [Google Scholar]
- 49.Li TY, Rana JS, Manson JE, Willett WC, Stampfer MJ, Colditz GA, Rexrode KM, Hu FB. Obesity as compared with physical activity in predicting risk of coronary heart disease in women. Circulation. 2006;113:499–506. doi: 10.1161/CIRCULATIONAHA.105.574087. [DOI] [PMC free article] [PubMed] [Google Scholar]
- 50.Canoy D, Boekholdt SM, Wareham N, Luben R, Welch A, Bingham S, Buchan I, Day N, Khaw KT. Body Fat Distribution and Risk of Coronary Heart Disease in Men and Women in the European Prospective Investigation Into Cancer and Nutrition in Norfolk Cohort. A Population-Based Prospective Study. Circulation. 2007 Dec 10; doi: 10.1161/CIRCULATIONAHA.106.673756. [Epub ahead of print] [DOI] [PubMed] [Google Scholar]
- 51.Lean MEJ, Han TS, Morrison CE. Waist circumference as a measure for indicating need for weight management. BMJ. 1995;311:158–161. doi: 10.1136/bmj.311.6998.158. [DOI] [PMC free article] [PubMed] [Google Scholar]
- 52.Klein S, et al. A consensus statement from Shaping America’s Health: Association for Weight Management and Obesity Prevention; NAASO, the Obesity Society; the American Society for Nutrition; and the American Diabetes Association. Diabetes Care. 2007;30(6):1647–1652. doi: 10.2337/dc07-9921. [DOI] [PubMed] [Google Scholar]
- 53.Li C, Ford ES, McGuire LC, Mokdad AH. Increasing trends in waist circumference and abdominal obesity among U.S. adults. Obesity. 2007;15:216–224. doi: 10.1038/oby.2007.505. [DOI] [PubMed] [Google Scholar]


