Abstract
In calculations of temperature increase during MRI, it is typically assumed adequate to consider the Specific energy Absorption Rate (SAR) levels averaged over an entire repetition time (TR) rather than explicitly consider the heating (as it occurs in reality) during the RF pulses only. Here we investigate this assumption with numerical calculations of SAR and temperature increase for a human head in a volume coil at 64 MHz and 300 MHz during three very different pulse sequences, each having a TR of 200 ms and a time-average whole-head SAR of 3.0W/kg, as well as with semi-analytical calculations considering a gradient-echo sequence in a segment of tissue with SAR of 10W/kg delivered in a 1ms pulse with TR of up to 5000 ms. While it is possible to calculate a temporal effect of specific pulse sequence on temperature, the difference between pulse sequences is so small and so transient that it should typically be adequate to consider only the time-average SAR in each TR.
Keywords: MRI, pulse sequence, SAR, temperature
Introduction
In an MRI exam, the patient is exposed to numerous pulses of RF energy, which introduce heat into the tissue. In order to minimize the risk of inducing hyperthermic tissue damage, regulatory bodies have established limits on the specific energy absorption rate (SAR) averaged over any 10 gram region of tissue, the whole-body, whole-head, and/or partial body as appropriate for the region exposed to the RF fields (1). While SAR can serve as the driving source of tissue temperature elevation, it is not SAR itself, but the temperature experienced by the tissue over time that can cause damage. SAR and temperature can have a fairly complex relationship (2–6), and regulatory bodies have also recommended limits for local and core body temperature increases (1).
Recently some investigators have calculated temperature increase in the human body due to RF heating in MRI using numerical methods (2–6). It has been shown that concentrating all the RF energy into the first two minutes of consecutive six-minute intervals can result in significantly higher transient temperature elevations than when the energy is applied evenly over time (5). Although it is commonly assumed that the pulsatile nature of the RF energy during each repetition time (TR) during an MR pulse sequence should not similarly affect the temperature distribution, a dedicated study of this has not previously been published.
Method
Full-Maxwell calculations of the electromagnetic fields produced throughout the head were performed using a home-built implementation (7) of the finite difference time domain (FDTD) method for electromagnetics (8). Details of the FDTD calculations have been provided elsewhere (6). In brief, the head model had a resolution of 3mm in each dimension. The RF coil was modeled after a TEM resonator (9) with multiple sources to achieve a current distribution such that all rungs had equal current magnitude and current phase proportional to angle of location in the azimuthal plane. The coil had an inner diameter (distance between rungs on opposite sides of coil) of 28cm, an outer (shield) diameter of 33cm, and a length of 19cm. The geometry of the head in the coil on central axial, sagittal, and coronal planes is shown in Figure 1. Calculations were performed at 64 and 300 MHz corresponding to MRI at 1.5 and 7.0 Tesla static magnetic field strengths. Electrical properties of tissue were derived from the literature using a 4 Cole-Cole fitting technique and parameters published previously (10). The SAR was calculated from the electric field as
| [1] |
where E is the peak electric field strength, σ is the local tissue conductivity and ρ is the local tissue mass density.
Figure 1.
Coil and head model geometry on the axial, sagittal, and coronal planes passing through the coil center. Figures with greater detail have been published previously (6).
Temperature was calculated with a finite difference implementation of the Pennes Bio-heat equation (11)
| [2] |
and an established convection-based boundary condition (12). Here t is time, T is local temperature at time t, Cp is the local specific heat, K is the local thermal conductivity, B is local tissue perfusion coefficient, and Tb is the blood temperature, and A is the metabolic rate of heat production. In the finite difference implementation, 3mm spatial resolution and 0.1ms temporal resolution were used.
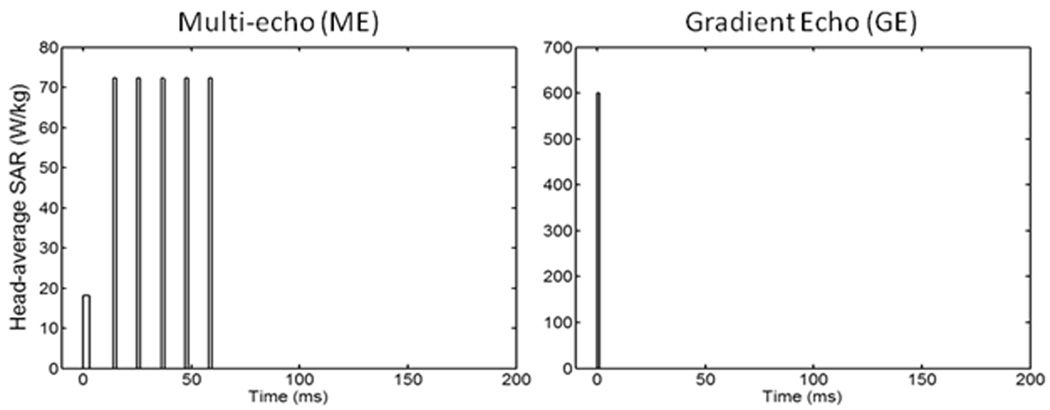
The different values for material density, heat capacity, thermal conductivity, perfusion by blood, and heat of metabolism for white matter, gray matter, blood, bone, muscle, fat, and skin were acquired from the literature (2–6, 12–14). It was assumed that the rate of perfusion was independent of time and temperature (15), the Tb was constant at 37°C, and ambient temperature was 24°C. An initial equilibrium temperature distribution was first calculated with SAR = 0W/kg. Then the RF field was normalized as to induce 3.0W/kg head-average SAR over time for each of three RF pulse sequences: 1) continuous wave (CW), 2) multi-spin echo (ME) having the RF energy concentrated into only six pulses (a 3ms excitation pulse and five 1.5ms refocusing pulses) during each 200 ms TR, and 3) Gradient-refocused echo (GE) having the energy concentrated into a single 1.0 ms pulse during each 200 ms TR. The temperature increase through time was calculated during 10 minutes of heating with each of the three RF pulse sequences at both 64MHz and 300MHz. The head average SAR during the pulse sequences is shown in Figure 2.
Figure 2.
Head-average SAR for different sequences simulated. Left: Multiple spin echo (ME) with TR=200ms and TE=11ms; the duration of 90° and 180° pulse are 3ms and 1.5ms, respectively. Right: Gradient echo (GE) at TR=200ms and pulse duration of 1ms. Also simulated (but not shown in this figure) was a continuous-wave (CW) excitation. For all sequences, the time-average SAR over the head is 3W/kg.
In addition to these purely numerical methods, semi-analytical calculations were performed to explore a conservative scenario of a gradient echo sequence with all the energy deposited during a 1ms pulse and TR ranging from 1 to 5000 ms with no thermal conduction allowed and with a time-average local SAR of 10 W/kg. In this case (K=0), Eq. 2 is reduced to a linear first-order differential equation yielding
| [3] |
where ts is the time of the last change in SAR. An expression for D (found by considering the case when t-ts in Eq. 3 approaches infinity) is seen to be the difference between the tissue temperature at ts (Ts) and the equilibrium value for T (when t-ts in Eq. 3 approaches infinity) with the current value of SAR:
| [4] |
Using Matlab (The Mathworks, Natick, MA), an algorithm was implemented to calculate T using these analytical equations as SAR was alternately set to 10W/kg multiplied by TR/1 ms for a duration of 1ms, then to 0W/kg for a period of TR minus 1ms. Starting with T at equilibrium for SAR=0 (T=Tb+A/B), for each value of TR, the calculation was performed until t reached two hours, and the maximum change in temperature during any single repetition for each value of TR was determined. This entire process was repeated for values of TR ranging from 1 ms (CW) to 5000 ms. For this analysis, properties of muscle tissue were used (6): ρ=1047 kg/m3, Cp=3600 W/kg/°C, A=480 W/m3, and B=3360 W/m3/°C. A constant Tb of 37°C was assumed.
Results and Discussion
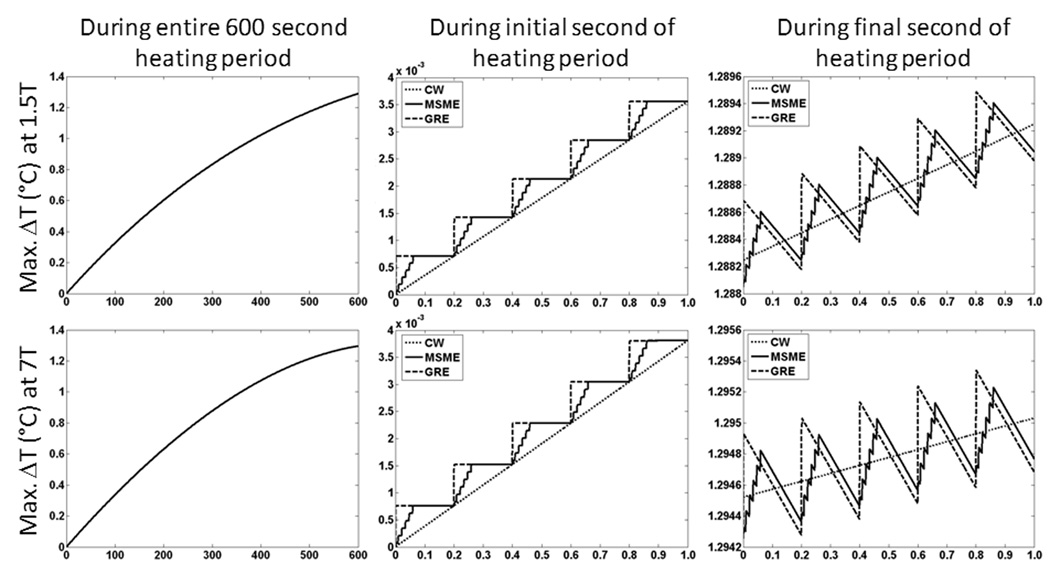
For any of the three pulse sequences simulated here, overall trends in the temperature distribution with time during application of SAR at each frequency were similar to those reported previously in similar calculations with a continuous wave sequence (6). In preliminary calculations we found that after 10 minutes of heating, the level of temperature increase at the center of the head was approximately 90% of the value at thermal equilibrium. Because in this work, head average SAR was the same at each frequency, no major increase in temperature when going from 3T to 7T is expected. If, alternatively, a certain B1 field strength were maintained, greater SAR values and temperature increases would certainly be expected at 7T than at 3T. Figure 3 shows the elevation of temperature above the baseline level with time for all three pulse sequences at the location of greatest temperature increase for both 64 MHz (1.5T) and 300 MHz (7T) excitations. When examining the entire 10-minute time course simulated (plots on left side of Fig. 3), no difference between the pulse sequences can be seen. Close examination of the time courses (such as during the first and last seconds of heating shown in center and right side plots of Fig. 3), however, reveal slight difference in temperature depending on the sequence. The magnitude of these differences is less than 1×10⁻³ °C. Effects of thermal conduction and perfusion have a greater cooling effect at the end of the exposure period, when the temperature is above the initial levels, so that at times when no RF energy is applied, the temperature in the GRE and MSME sequences can dip below that in the CW sequence. The location of greatest temperature increase occurs in the right-hand masticator space at the level of the zygomatic arch at 1.5T and in the neck near the right-hand trapezius muscle at 7T.
Figure 3.
The temperature rise above baseline at the location of maximum temperature change during the entire timecourse (left), during the first 1s (center), and during the last 1s (right) of a 10 minute exposure to 3.0 W/kg head-average SAR at 64 MHz (top) and 300 MHz (bottom).
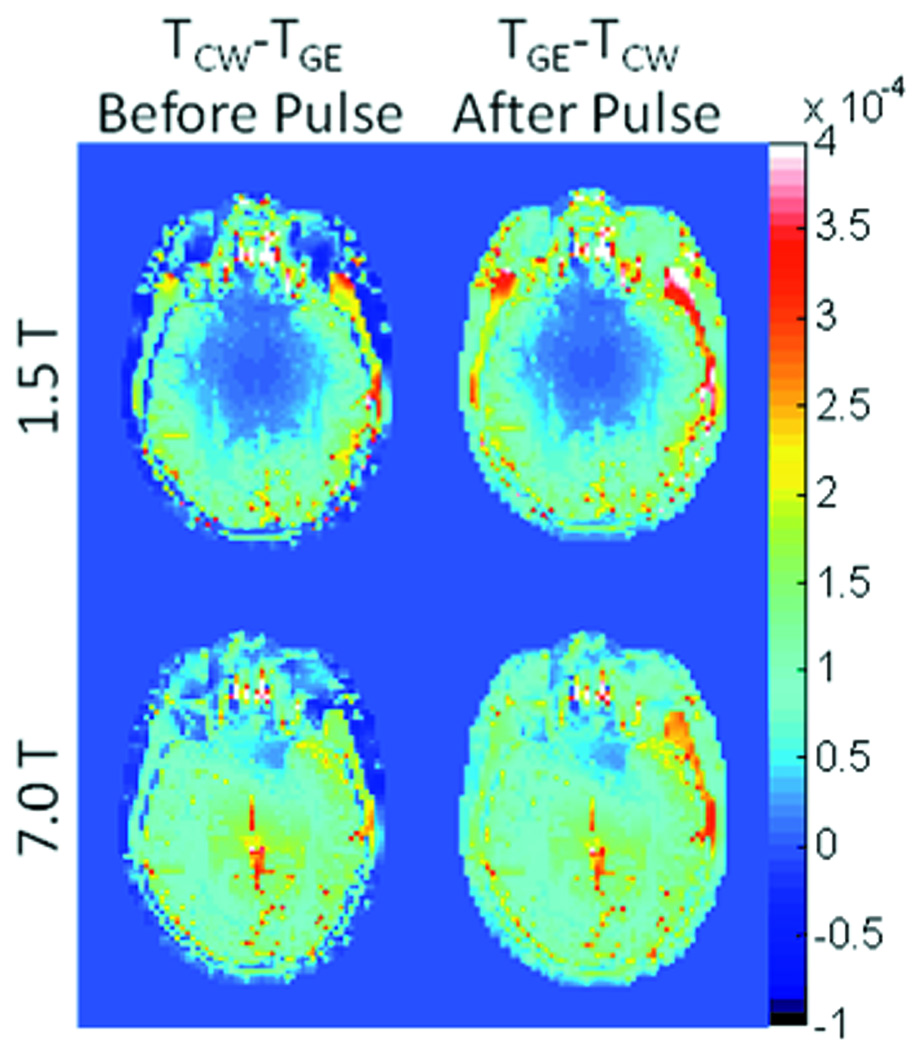
Figure 4 shows the difference in temperature distribution on an axial plane passing through the eyes between the CW and GE sequences immediately before and immediately after a single pulse in the GE sequence after 10 minutes of heating. In each case, the maximum differences are less than 0.001 °C.
Figure 4.
Temperature difference between CW and ME sequences on an axial plane passing through the eyes immediately before (left) and immediately after (right) a single RF pulse of the GE sequence applied near the end of the 10min period of heating at both 64MHz (top) and 300 MHz (bottom).
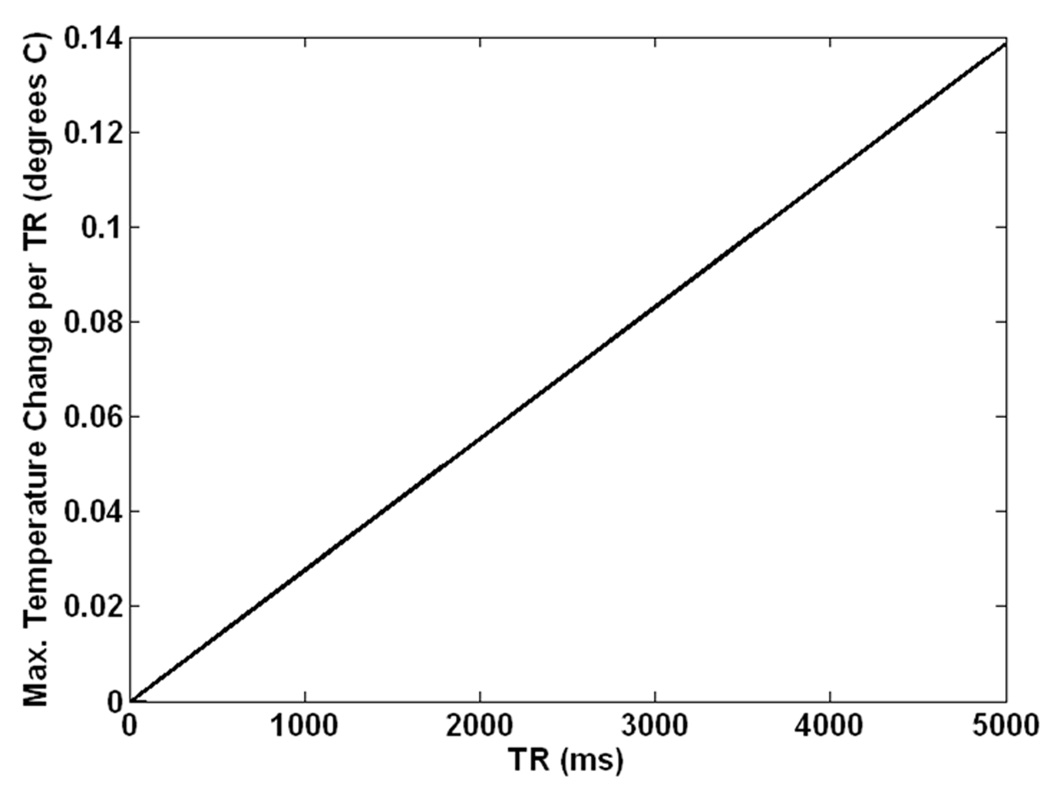
Time courses for the semi-analytical calculations at each individual value of TR followed asymptotic patterns overall with minor variations during each TR, not unlike those shown in Figure 3. Figure 5 shows the maximum change in temperature during any single repetition for a two-hour long gradient-echo sequence with a pulse duration of 1ms and a TR varying from 1ms (CW) to 5000 ms in muscle tissue with time-average SAR of 10W/kg and no thermal conduction. Even in this conservative case (high local SAR with no thermal conduction in tissue with moderate levels of perfusion) for the most extreme case (TR = 5000 ms with SAR of 50,000W/kg applied for 1/5000 of the time) the maximum temperature change during any repetition of less than 0.14 °C.
Figure 5.
Maximum change in temperature during any single repetition for a two-hour gradient-echo sequence with a pulse duration of 1ms and a value of TR varying from 1ms (CW) to 5000 ms in muscle tissue with time-average SAR of 10W/kg as calculated with conservative semi-analytical methods allowing for no thermal conduction.
Both Figures 3 and 4 indicate that the temperatures are slightly higher in the CW sequence immediately before the RF pulse in the GE sequence, and slightly higher in the GE sequence immediately following the RF pulse in that sequence. Figure 5 indicates temperature changes during a single repetition for extreme cases with no thermal conduction allowed. Because the maximum differences in temperature between pulse sequences with equivalent time-average SAR and reasonable values of TR shown here are miniscule for typical sequences, it should not typically be necessary to explicitly consider RF pulse sequences in calculation of temperature from RF heating in MRI. This ensures more general applicability of temperature calculation results and allows for larger time steps and faster calculations when using a time-domain approach like those most commonly used (2–6, 15).
Acknowledgments
Funding through NIH grant R01 EB000454 and R01 EB006563
References
- 1.International Electrotechnical Commission. International standard, medical equipment – part 2: particular requirements for the safety of magnetic resonance equipment for medical diagnosis, 2nd revision. Geneva: International Electrotechnical Commission; 2002. 601-2-33. [Google Scholar]
- 2.Hand JW, Lau RW, Lagendijk JJW, Ling J, Burl M, Young IR. Electromagnetic and thermal modeling of SAR and temperature fields in tissue due to an RF decoupling coil. J Magn Reson Imaging. 1999;42:183–192. doi: 10.1002/(sici)1522-2594(199907)42:1<183::aid-mrm24>3.0.co;2-i. [DOI] [PubMed] [Google Scholar]
- 3.Collins CM, Liu W, Wang J, Gruetter R, Vaughan JT, Ugurbil K, Smith MB. Temperature and SAR calculations for a human head within volume and surface coils at 64 and 300 MHz. J Magn Reson Imaging. 2004;19:650–656. doi: 10.1002/jmri.20041. [DOI] [PubMed] [Google Scholar]
- 4.Nguyen UD, Brown JS, Chang IA, Krycia J, Mirotznik MS. Numerical evaluation of heating of human head due to magnetic resonance image. IEEE T Biomed Eng. 2004;51:1301–1309. doi: 10.1109/TBME.2004.827559. [DOI] [PubMed] [Google Scholar]
- 5.Nadobny J, Szimtenings M, Diehl D, Stetter E, Brinker G, Wust P. Evaluation of MR-Induced Hot Spots for Different Temporal SAR Modes Using a Time-Dependent Finite Difference Method With Explicit Temperature Gradient Treatment. IEEE Trans Bio-med Eng. 2007;54:1837–1850. doi: 10.1109/TBME.2007.893499. [DOI] [PubMed] [Google Scholar]
- 6.Wang Z, Lin JC, Mao W, Liu W, Smith MB, Collins CM. SAR and Temperature: Simulations and Comparison to Regulatory Limits for MRI. J Magn Reson Imag. 2007;26:437–441. doi: 10.1002/jmri.20977. [DOI] [PMC free article] [PubMed] [Google Scholar]
- 7.Wang Z. PhD Dissertation. University of Illinois; 2005. MRI RF coil model design and numerical evaluation using the finite difference time domain method. [Google Scholar]
- 8.Taflove A, Hagness SC. Computational electrodynamics: the finite-difference time-domain method. Third Edition. ARTECH House press; 2005. [Google Scholar]
- 9.Vaughan JT, Hetherington HP, Harrison JG, Otu JO, Pan JW, Pohost GM. High frequency volume coils for clinical NMR imaging and spectroscopy. Magn Reson Med. 1994;32:206–218. doi: 10.1002/mrm.1910320209. [DOI] [PubMed] [Google Scholar]
- 10.Gabriel C. Compilation of the dielectric properties of body tissues at RF and microwave frequencies. Brooks Air Force Base: Air Force materiel command. 1996 AL/OE-TR-1996-0037; [Google Scholar]
- 11.Pennes HH. Analysis of tissue and arterial blood temperatures in the resting human forearm. J Appl Physiol. 1948;1:93–122. doi: 10.1152/jappl.1948.1.2.93. [DOI] [PubMed] [Google Scholar]
- 12.Wang J, Fujiwara O. FDTD computation of temperature rise in the human head for portable telephones. IEEE T Microw Theory. 1999;48:528–1534. [Google Scholar]
- 13.Wainwright P. Thermal effects of radiation from cellular telephones. Phys Med Biol. 2000;45:2363–2372. doi: 10.1088/0031-9155/45/8/321. [DOI] [PubMed] [Google Scholar]
- 14.Duck FA. Physical properties of tissue: a comprehensive reference book. London: Academic Press; 1990. [Google Scholar]
- 15.Wang Z, Collins CM. On Consideration of Physiological Response in Numerical Models of Temperature During MRI of the Human Head. J Magn Reson Imaging. 2008;28:1303–1308. doi: 10.1002/jmri.21556. [DOI] [PMC free article] [PubMed] [Google Scholar]


