Abstract
Cells generate traction stresses against their substrate during adhesion and migration, and traction stresses are used in part by the cell to sense the substrate. While it is clear that traction stresses, substrate stiffness, and cell area are related, it is unclear whether or how area and substrate stiffness affect force generation in cells. Moreover, multiple studies have investigated traction stresses of single cells, but few have focused on forces exerted by cells in contact, which more closely mimics the in vivo environment. Here, cellular traction forces were measured where cell area was modulated by ligand density or substrate stiffness. We coupled these measurements with a multilinear regression model to show that both projected cell area and underlying substrate stiffness are significant predictors of traction forces in endothelial cells, and interestingly, substrate ligand density is not. We further explored the effect of cell–cell contact on the interplay between cell area, substrate stiffness, and force generation and found that again both area and stiffness play a significant role in cell force generation. These data indicate that cellular traction force cannot be determined by cell area alone and that underlying substrate stiffness is a significant contributor to traction force generation.
Keywords: Endothelial cell, Polyacrylamide gel, Linear regression model, Cell–cell interaction, Traction force
INTRODUCTION
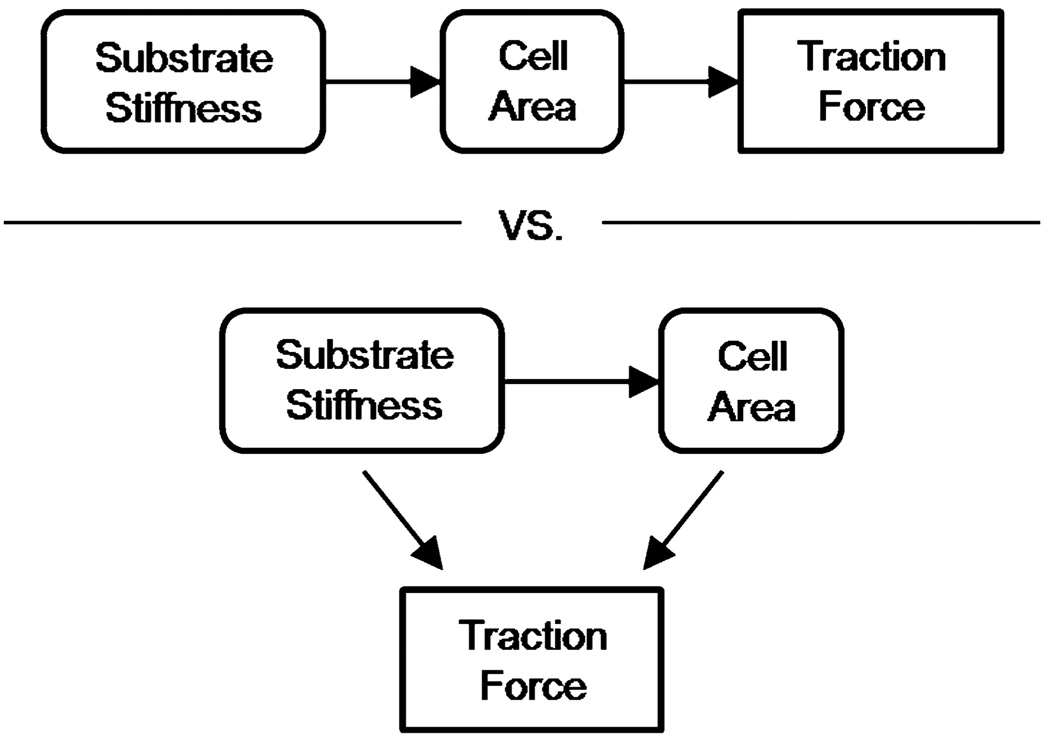
Cellular traction forces are involved in cell adhesion and migration,11,24 extracellular matrix (ECM) assembly and reorganization,12 and cellular mechanotransduction.3,4 The advent of multiple methods to measure cellular traction stresses has lead to numerous studies of the origin of force generation and its relationship to normal and pathologic conditions.1,18,21,22 Recent work suggests that cellular force generation is dictated in part by the elasticity of the surrounding matrix,33 where cell traction force increases with substrate stiffness.16 These studies imply that increased tissue stiffness increases the intrinsic force state of the cell. The ramifications of these studies have been far-reaching, as there are a number of pathological states where tissues stiffen, including cancer progression,22 wound healing,10 and atherosclerosis.3 However, in addition to increasing force generation, ECM stiffness also increases cell area.2,26 Together, these results suggest a potential relationship between substrate stiffness, cell area, and traction force generation; however, the specific interplay of these parameters is unknown. It is not clear whether increased ECM stiffness drives increases in cell area that increase cell force, or if ECM stiffness and cell area can drive increased force independently (Fig. 1).
FIGURE 1.
Proposed possible interplay between substrate stiffness, cell area, and traction force in ECs.
Much of what is known about cellular traction stress generation is based on studies of single cells in isolation. However, this does not accurately depict the physiological state in many cases. Many cells whose traction stresses have been studied extensively, such as epithelial and endothelial cells, are in contact with adjacent cells, however, much less is known about traction forces of cells in contact. Interestingly, there is mounting evidence to show that increased matrix stiffness disrupts cell–cell contacts,2,22 yet little is known about the changes in traction generation of cells in contact that accompany such changes in matrix stiffness. It is unclear if substrate mechanics plays a role in dictating cell forces once cells are in contact. There is evidence to suggest that substrate mechanics has a more pronounced effect on cell area and stress fiber formation when cells are in isolation. On compliant substrates, isolated cells exhibit fewer well-formed stress fibers and are typically less well spread. Upon cell–cell contact, stress fiber formation increases.32 Recent work investigating cells in contact indicate that monolayer geometry may influence the magnitude and orientation of traction forces across cell aggregates.14,19 However, it is not known whether or how cell area and substrate stiffness contribute to traction force generation of cells in contact, and whether these effects parallel the results found for single cells.
Using measures of cellular traction forces coupled with a multilinear regression model, we show that both cell area and substrate stiffness are significant predictors of traction force generation in single and two endothelial cells (EC) in contact. These data show for the first time that cell area is not the sole predictor of traction generation and that substrate stiffness plays a significant role in dictating force generation in cells even when they are in contact with other cells. Our study indicates that both substrate stiffness and cell area play an important role in contributing to the mechanical response of cells.
MATERIALS AND METHODS
Cell Culture
Bovine aortic endothelial cells (VEC Technologies) were maintained at 37 °C and 5% CO2 in Medium 199 (Invitrogen) supplemented with 10% FetalClone III (Fisher), and 1% each of penicillin–streptomycin, MEM amino acids (Invitrogen), and MEM vitamins (Mediatech). ECs were used up to passage 12.
Polyacrylamide Gel Synthesis
Variably compliant PA gels were prepared by altering the ratio of acrylamide to bis-acrylamide (BioRad) in the polymerization solution as described previously.2,31 Gels were functionalized with N-6-((acryloyl)amido)hexanoic acid (synthesized in our lab23) to allow covalent attachment of type I collagen (Sigma) to the gel surface. Gels were polymerized and covalently bound to activated glass coverslips as described previously,2 and were derivatized with an applied collagen concentration of 100 µg/mL for variable stiffness studies, and 0.01–100 µg/mL for variable concentration studies. Gels were synthesized with Young’s Moduli (E) of 1, 2.5, 5, and 10 kPa to mimic physiologically relevant tissue stiffness.9
PA Gel Stiffness Characterization
The stiffness of PA gels was confirmed by measuring Young’s Modulus (E) at the gel surface using Hertz theory,16 E = 3(1 − ν2)f/4d3/2r1/2, where d is the indentation depth of a steel ball with radius r exerting a buoyancy-corrected force f on the surface of a gel with Poisson’s ratio ν = 0.3.15 A steel ball (r = 0.32 mm, Abbott Ball Co.) was placed on gels embedded with fluorescent beads (Invitrogen, 500 nm diameter) and indentation depth was measured by focusing the microscope on beads that returned to their original position in the gel after removal of the ball as we have done previously to confirm E.25
Traction Force Microscopy
Traction force microscopy (TFM) was used to quantify cellular traction forces. TFM maps the magnitude and spatial orientation of traction stresses exerted by a cell on its substrate by tracking displacements created in the substrate domain by the cell.5 Cells were seeded on PA gels embedded with fluorescent beads, allowed to attach and spread overnight, and were imaged in a custom temperature, humidity, and CO2–controlled stage of a Zeiss Axio Observer Z1m microscope with a Hamamatsu ORCA-ER camera. Bead fields were imaged before (stressed configuration) and after removal (relaxed configuration) of the cell with trypsin (Invitrogen). These images allowed substrate displacements to be tracked with correlation-based optical flow.17 Substrate displacements were translated into a strain field that was used to compute traction stresses using Bayesian statistics that maximized the most likely traction field that describes the given strain field.6 The substrate strains were converted to traction stresses using the LIBTRC analysis library developed by Professor Micah Dembo of Boston University, who also invented the basic theory that underlies TFM. Images were processed with LIBTRC to determine the cellular traction vectors, T (stress vectors), the total magnitude of the force, |F|, and the projected cell area. |F| is an integral of the traction field magnitudes over the cell area, , where T(x, y) = [Tx(x, y), Ty(x, y)] is the continuous field of local cellular traction vectors defined at local spatial positions (x, y) in the projected cell area.26 Note that the mean traction vector over the entire cell area is assumed to be zero to satisfy a constraint of global force balance.
Statistics and Regression Modeling
Data for Figs. 3 and 5 were analyzed with analysis of variance (ANOVA) and Tukey’s Honestly Significant Difference test, or Student’s t for Fig. 7, after natural logarithm transformation to ensure assumptions of normality and equal variance. For regression modeling, force and area data were transformed by natural logarithm to ensure model assumptions of residual normality and equal variance. All regression model parameter residuals had a Cook’s distance less than one indicating that no data point influentially distorted the regression outcome, and all parameter estimate variance inflation factors were less than three indicating the regression model did not suffer from multicollinearity.20 ANOVA, Student’s t, and regression modeling were performed in JMP software (SAS Institute). Sample sizes (n) for single cells (Figs. 3, 5, and 7) were n = 24, 14, 25, and 38 for E = 1, 2.5, 5, and 10 kPa substrates, respectively, and n = 17, 23, 6, 15, and 12 for collagen concentrations of 0.01, 0.1, 1, 10, and 100 µg/mL, respectively (Fig. 5). Sample sizes for two-cells in contact (Fig. 7) were n = 16 and 20 (pairs of cells) for E = 1 and 10 kPa substrates, respectively. All analyses satisfied a statistical power of 0.8 or higher and a level of significance of 0.05 was assumed for all statistics.
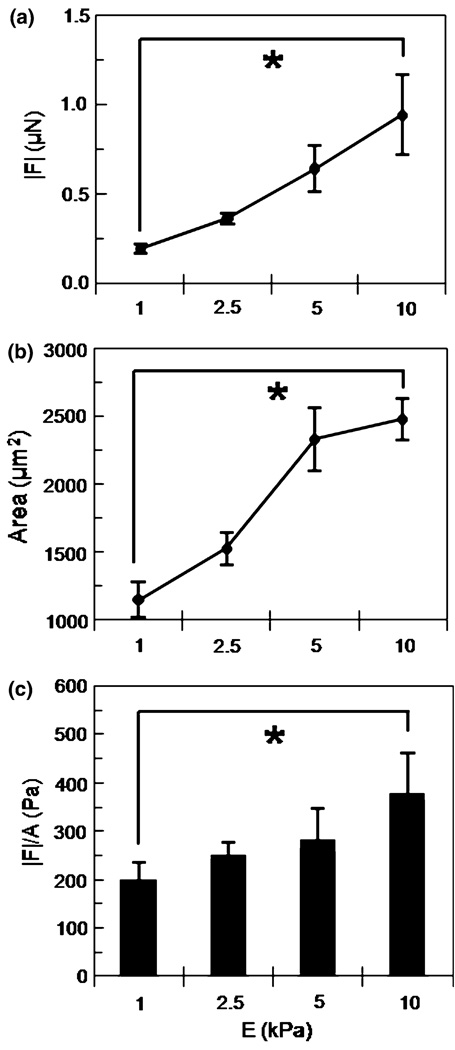
FIGURE 3.
Traction force |F| (a) and cell area (b) versus substrate stiffness over the range E = 1–10 kPa at constant collagen concentration (100 µg/ml). Mean ± standard error. |F| of each cell normalized by its projected area (|F|/A) and averaged for each substrate stiffness (c). Mean + standard error. * indicates p < 0.0001.
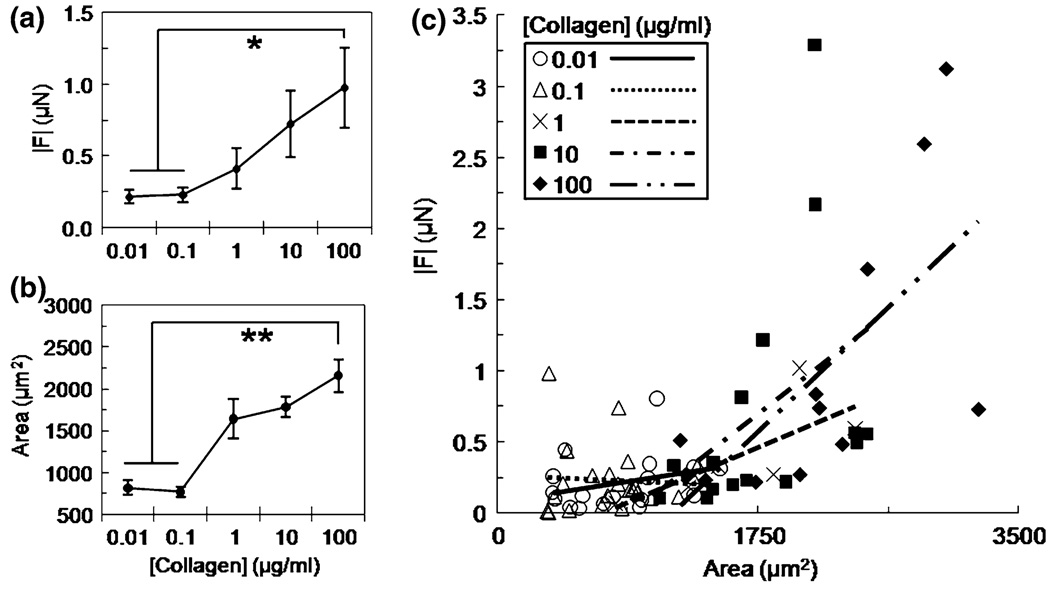
FIGURE 5.
Traction force |F| (a) and cell area (b) versus applied collagen concentration of 0.01–100 µg/ml at fixed substrate stiffness (E = 5 kPa). Mean ± standard error; * indicates p < 0.001; ** indicates p < 0.0001. Plot of |F| versus area for each collagen concentration on E = 5 kPa gels and fit with linear regression lines (c).
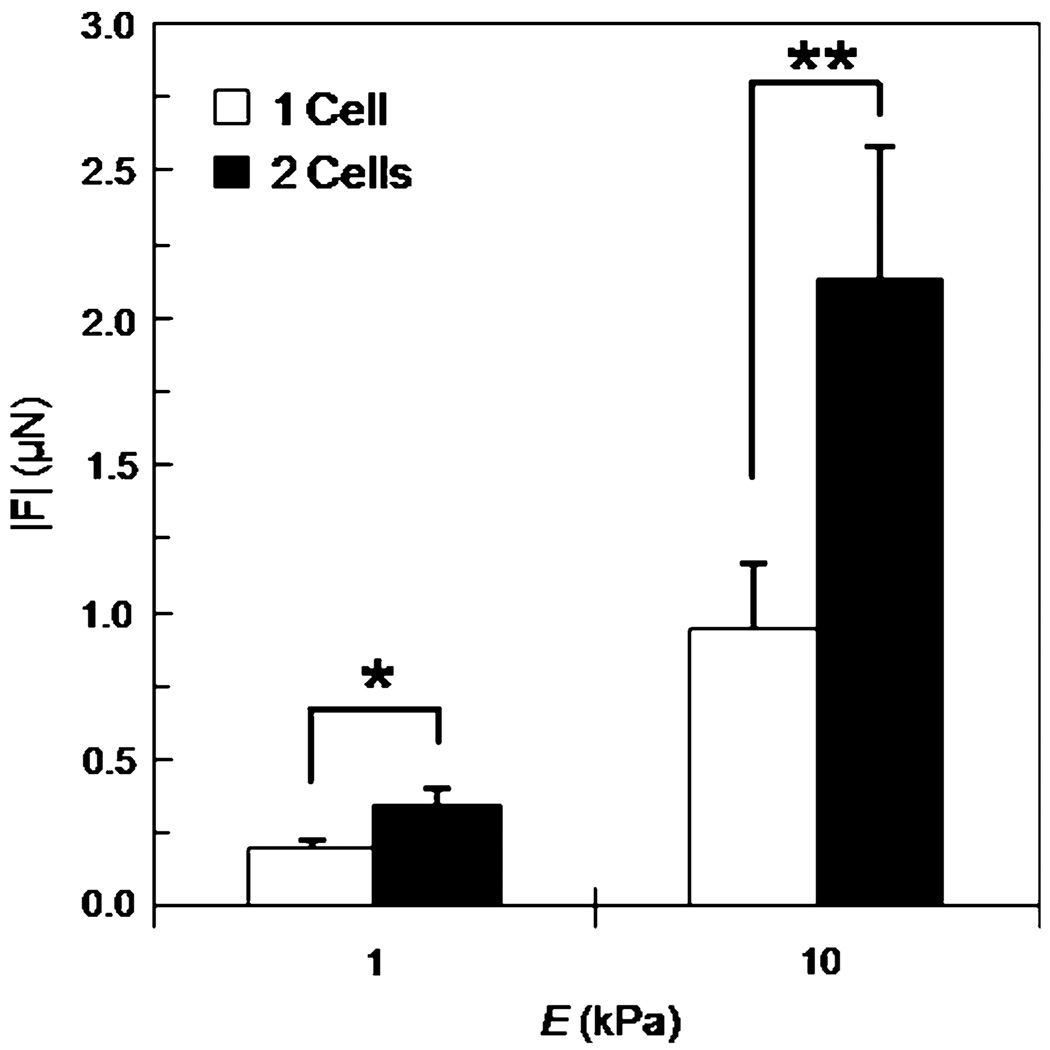
FIGURE 7.
Traction force |F| of single and two ECs in contact on E = 1 and 10 kPa substrates at constant collagen concentration (100 µg/ml). Relative increases in force between single and two ECs in contact are 76% on 1 kPa gels and 126% on 10 kPa gels. Mean + standard error; * indicates p < 0.005; ** indicates p < 0.001.
RESULTS
Endothelial Cell Traction Force and Area Increase with Increasing Substrate Stiffness
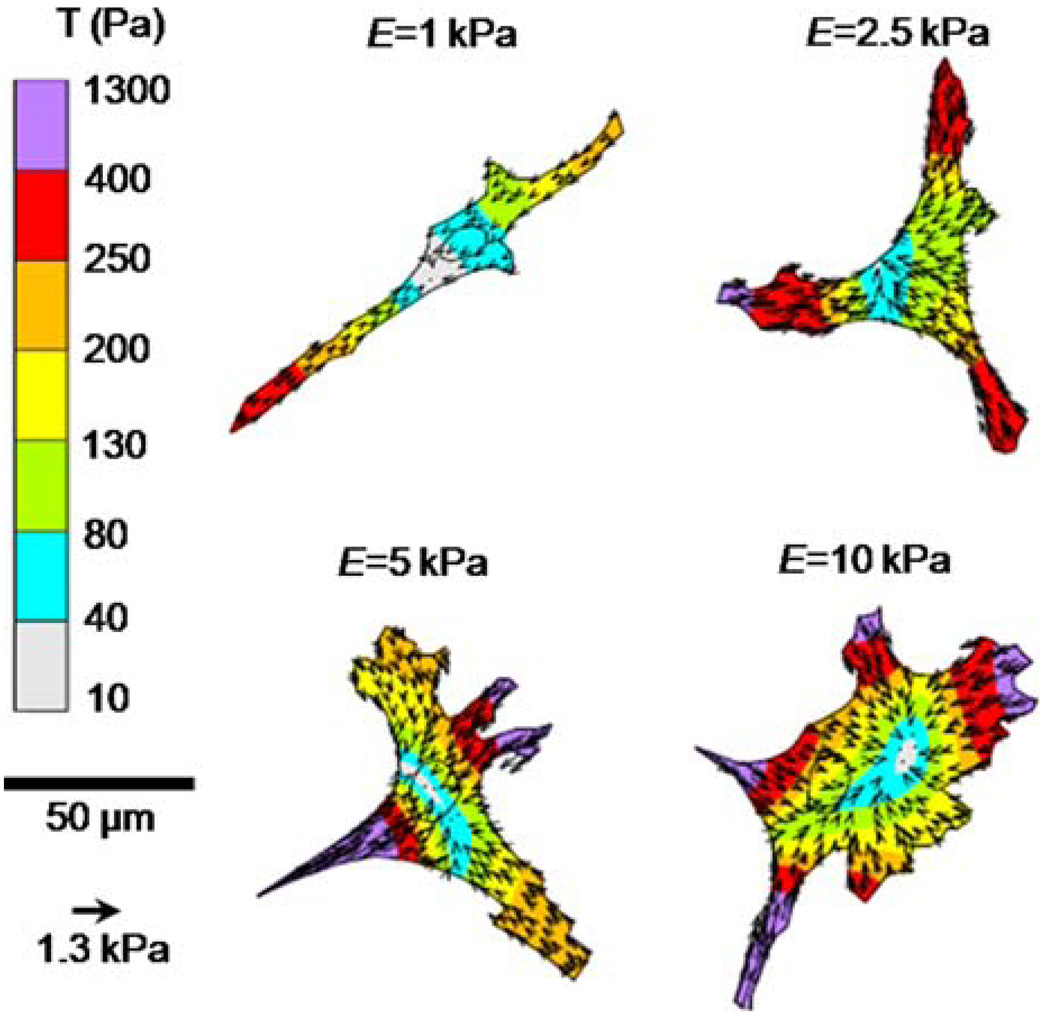
To investigate the role of substrate stiffness in mediating EC traction force generation, cells were seeded on PA substrates where the applied collagen concentration was fixed (100 µg/mL) across stiffness. Figure 2 shows representative traction maps of ECs on compliant to stiff (E = 1–10 kPa) PA substrates. The magnitude and orientation of the traction stresses, T, are shown by the color-coded vector plot over the projected cell area. Traction vectors are oriented toward the center of the cell (contractile) and are largest at the cell edge of lamellipodia. Note that cell morphology changes from spindle shaped on compliant gels toward more isotropic spreading with increasing substrate stiffness. Further analysis showed that the magnitude of the traction force, |F|, increased significantly (*) over the range of increasing substrate stiffness E = 1–10 kPa (Fig. 3a) with a concomitant significant increase in projected cell area with substrate stiffness at fixed applied collagen concentration (100 µg/mL) (Fig. 3b). A plot of the traction force of each cell normalized by its projected area and averaged for each substrate stiffness demonstrated the same statistically significant positive correlation suggesting substrate stiffness influenced traction force generation (Fig. 3c).
FIGURE 2.
Representative images of EC morphology and traction stresses, T, on poly(acrylamide) gel substrates of increasing substrate stiffness (E = 1–10 kPa). Inner circles depict localization of cell nuclei.
A Linear Regression Model Indicates Substrate Stiffness and Cell Area Are Predictors of Cellular Traction Force
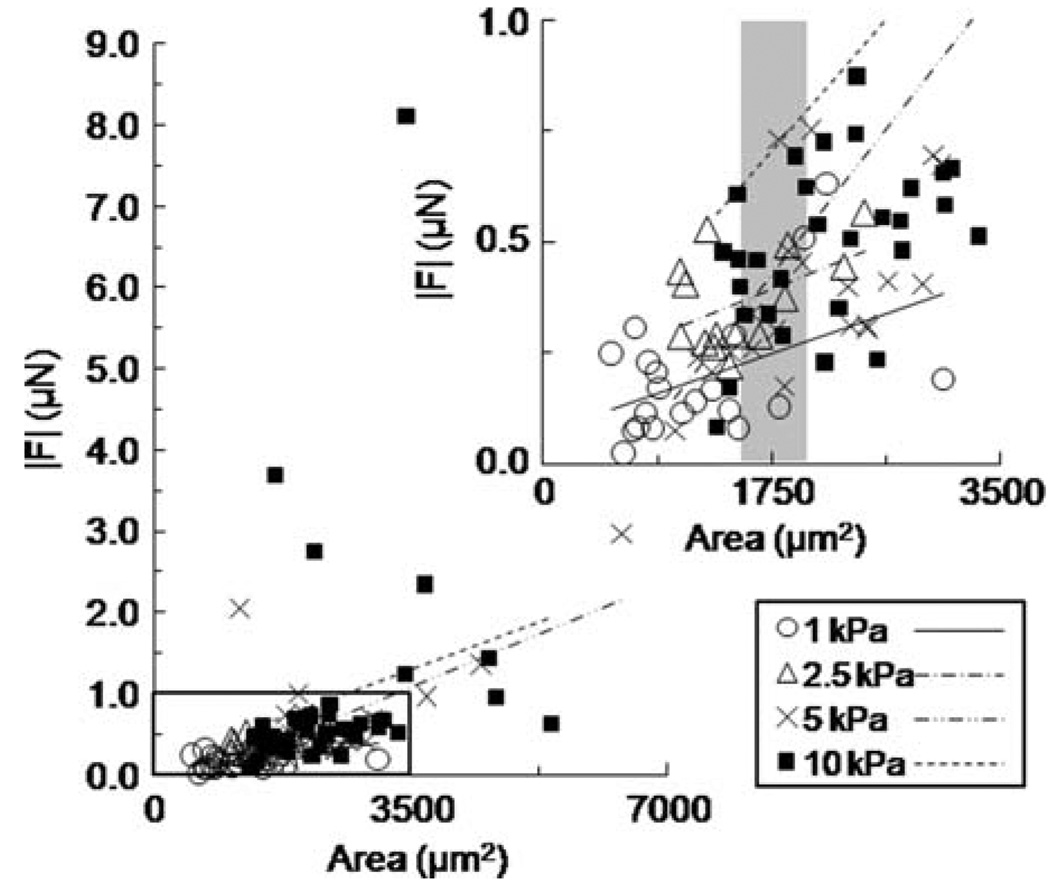
We established experimentally that cells of greater spread area exerted greater traction force, but it was not clear whether cells of a similar area exerted the same traction force across substrate stiffness levels. To determine if the ratio of traction force to spread cell area was independent of substrate stiffness, we plotted force vs. area for each stiffness level (E = 1–10 kPa), and fit the data with linear regression lines (Fig. 4; inset represents magnification of the boxed region to emphasize regression trends between stiffness levels). The data plot indicated that cell area alone could not always predict traction force. Small cell areas usually correlated with less traction forces on compliant 1 kPa gels (Fig. 4 inset—open circles); however, as cell area increased, the traction force magnitude output varied with substrate stiffness (Fig. 4 inset—e.g., see shaded region centered at 1750 µm2). Moreover, the slopes of the linear regression lines were non-parallel and increased with substrate stiffness suggesting that stiffness was a crucial parameter that contributed to the interaction between cell area and traction force. Re-plotting this data set as traction force normalized by cell area against substrate stiffness indicated a statistically significant positive association with increasing stiffness (Fig. 3c). To formally test whether substrate Traction Forces of Single Cells and Cells in Contact stiffness and cell area were significant predictors of traction force, we used a least-squares multiple linear regression model that related force to area and stiffness. We used an additive linear model of the form
| (1) |
where Y represents the response traction force, β0 is the intercept, β1 is the partial slope of quantitative variable x1 representing area, and βi is the partial slope of qualitative variable xi representing the parameter stiffness, where , represents the four levels of stiffness tested (1, 2.5, 5, and 10 kPa), and ε is random error. This regression model assumed a linear relationship between force and area25,29 and quantitatively assessed if the partial slopes representing the parameters area and stiffness were significant predictors of traction force. The p-values of the linear regression model parameters indicated that both cell area and substrate stiffness were significant predictors of EC traction force (Table 1). A comparison of p-values between parameters stiffness (p = 0.0187) and area (p < 0.0001) suggests that cell area may be more influential in driving traction forces in single ECs.
FIGURE 4.
Plot of traction force |F| versus cell area fit with linear regression lines for each stiffness level E = 1–10 kPa at constant collagen concentration (100 µg/ml). Inset represents magnification of the boxed region to clarify regression trends. Shaded region of inset highlights variable force output for cells of similar spread area.
TABLE 1.
List of p-values for significance of redictors E and Area on |F|.
Endothelial Traction Force and Area Increase with Increasing Matrix Ligand Concentration
Since increases in force correlate with both increases in substrate stiffness (Fig. 3a) and spread cell area (Fig. 3b), we asked whether force could be modulated by cell area when substrate stiffness was held constant and area was modulated using substrate ligand density. To test this, ECs were seeded on PA gels of constant stiffness (E = 5 kPa) with variable applied collagen concentration (0.01–100 µg/mL). EC traction force (Fig. 5a) and cell area (Fig. 5b) increased significantly (*) with increasing collagen concentration when substrate stiffness was held constant. To determine how cell area and ligand concentration contributed to force generation at constant stiffness, traction force vs. cell area was plotted for each collagen concentration and fit with linear regression lines (Fig. 5c). The data suggested that for a given collagen concentration, force increased with area. To formally test whether area and ligand concentration were predictors of force, we applied the model presented in Eq. (1) where βixi was summed over i = 2–5 to represent the five levels of collagen concentrations tested (0.01, 0.1, 1, 10, and 100 µg/mL), and all other parameters were as described above. The analysis indicated that cell area was a significant predictor of traction force (p = 0.0002), but that ligand density was not (p = 0.9404). Importantly, these data show that traction forces are driven by cell area, not ligand density. Together with the results presented in Fig. 3, these data indicate that traction force increased when cell area was increased through changes in either substrate stiffness (Fig. 3a) or ligand density (Fig. 5a).
Endothelial Two-Cell Aggregates Exert Increased Traction Forces
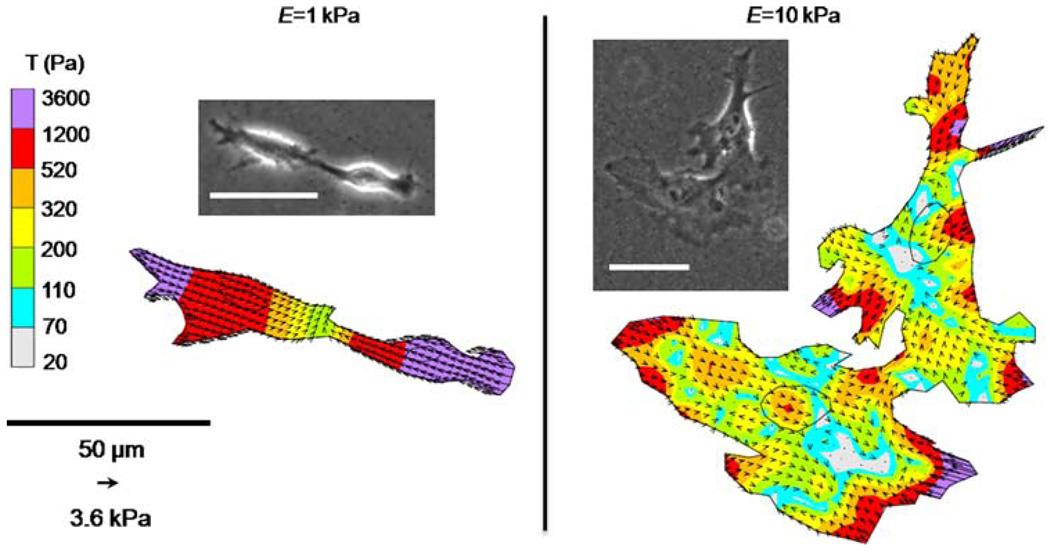
Cells do not typically reside in isolation in vivo. While our data indicate that substrate stiffness and cell area both play a role in cell force generation in single cells, it is not clear if these relationships are maintained while cells are in contact with other cells. Two ECs in contact on E = 1 and 10 kPa gels were analyzed with TFM and modeled as a single force-generating unit (Fig. 6). Note that cell–cell connections on compliant 1 kPa gels tend to be oriented end-to-end compared to cell–cell connections between cells on stiffer 10 kPa gels that exhibit increased spreading. Similarly to single cells (Fig. 2), traction forces of cells in contact are contractile and greatest at cell edges and in lamellipodia. As expected, |F| of two cells in contact was significantly greater (*) than the force generated by single cells across the two substrate moduli tested (Fig. 7). Notably the increase in traction force generation of two cells in contact compared to single cells is greater on stiff substrates (a 126% increase on 10 kPa gels compared to a 76% increase on 1 kPa gels).
FIGURE 6.
Representative images of two ECs with a portion of their membrane in contact on E = 1 and 10 kPa substrates were modeled as a single force generating unit with TFM. Inner circles depict localization of cell nuclei. Scale bars in phase images are 50 µm.
To determine if cell area and substrate stiffness were significant predictors of traction force of cells in contact, as we found for single cells, we used an additive linear model of the form
| (2) |
where Y, β0, β1, x1, and ε are as defined above for Eq. (1), β2 is the partial slope of qualitative variable x2 representing the parameter stiffness (1 and 10 kPa), and β3 is the partial slope of qualitative variable x3 representing the parameter number of cells (one-cell and two-cell aggregates). Similarly to model Eq. (1), this model assumed a linear relationship between force and area and quantitatively accounted for the parameters substrate stiffness, cell area, and cell number in mediating traction force. Again, the linear regression model indicated that both cell area and substrate stiffness were significant predictors of traction force (Table 1). A comparison of p-values indicated that substrate stiffness was a more significant predictor of traction force than area for cells in contact (p < 0.0001 for stiffness compared to p = 0.0010 for area) which was in contrast to our findings in single cells where area was more significant. Additionally, substrate stiffness was a more significant predictor of force for cells in contact compared to single cells (p < 0.0001 for cell pairs compared to p = 0.0187 for single cells). These data indicate that substrate stiffness plays a prominent role in directing traction forces of cells in contact.
DISCUSSION
In this study, we show for the first time that both cell spread area and substrate stiffness are significant predictors of cellular traction force in endothelial cells, and that substrate ligand density does not directly drive traction generation. Our previous data indicate that EC area increases with increasing substrate stiffness,2,26 and EC traction force positively correlates with greater cell spread area.13 Together, these findings support a model of interaction where traction force is driven by a coupling of cell area and substrate stiffness. Further, we demonstrate that traction force cannot be predicted by cell area alone—force also depends on underlying substrate stiffness (Fig. 1). These results are important because they show for the first time that substrate stiffness can alter cellular force profiles independently of changes in cell area. Because matrix stiffening occurs in a number of disease states including atherosclerosis, wound healing, and cancer, these results have important ramifications for understanding the baseline force profiles of cells as a function of their extracellular mechanical environment.
To investigate the relationship between cell area and traction generation, cell area was manipulated experimentally by changing substrate stiffness and increasing the density of ligand on the surface of the substrate. In both cases, we found a positive correlation between cell area and traction force magnitude. When substrate stiffness was varied, normalizing force by area showed an increase relative to stiffness, indicating that substrate stiffness (and not area alone) was driving an increase in force. When stiffness was held constant, cell area (and not ligand density) was driving an increase in force. Data from our lab and others indicates that increasing substrate stiffness or ligand density can lead to integrin clustering and increased focal adhesion number and size.8,26,32 Since ligand density is not a predictor of traction force, it is unclear whether we can attribute changes in force to differential integrin clustering when stiffness is held constant. While integrin clustering may contribute to increases in force generation, our data suggest that substrate stiffness and cell area (whether modulated by stiffness or ligand density) are prominent and significant contributors to force.
While our study specifically focused on endothelial cells, the results may translate to other cell types as well. Substrate stiffness and cell area have been shown to influence traction force generation in other cell types, and should be the subject of future investigations. It has been demonstrated in 3T3 fibroblasts and mammary epithelial cells that increases in traction force generation with substrate stiffness are accompanied by an increase in cell area.16,22 As was studied here, it would be interesting to investigate whether cell area, substrate stiffness, and traction stress generation are linked in other cellular systems and whether their interactions are universal.
In addition to studying single cell force generation, we also investigated the relationship between force, cell area, and substrate stiffness of cells in contact. Our goal in these studies was to determine whether the relationship we found for single cells, which indicated that both substrate stiffness and cell area were important determinants of force generation, holds once cells are in contact. Very few studies have tackled the question of traction stress distribution of cells in contact. Because cell contact occurs in the healthy physiological state, these studies are critical to understanding cell contractility and response to the mechanical properties of the extracellular matrix in vivo.
Our results of traction forces of cells in contact indicate that both substrate stiffness and cell area predict force in two-cell aggregates. Importantly, these data show that once in contact, cells maintain sensitivity to substrate stiffness. We demonstrate for the first time that once in contact with an adjacent cell, ECs exert greater traction forces compared to single cells. The increase in traction force output by cell assemblies compared to single cells suggests an increase in cellular contractility with contact. It was shown previously that stress fiber organization follows cell–cell contact on compliant substrates.32 An increase in actin fiber organization upon cell–cell contact likely facilitates increased cellular contractility thereby increasing traction force output compared to single ECs. An increase in traction force with cell contact has also been reported in epithelial cell monolayers that exert traction forces that are greater than stresses measured in single cells.7 Taken together, these data suggest that the increase in traction force generation that is initiated upon cell–cell contact may be sustained during tissue formation and depend significantly on substrate stiffness.
Interestingly, the increase in traction force with cell–cell contact on compliant gels was less than two-fold greater (76%) while the increase on stiff gels was more than two-fold (126%). We have previously established that ECs are capable of sensing the traction forces exerted by adjacent cells that drive cell–cell interactions, and that cell–cell connectivity changes with substrate stiffness; cells on compliant gels prefer cell–cell connections and cluster while those on stiffer substrates prefer cell–substrate interactions and migrate away from each other.27 The difference in magnitude of increased traction force output with substrate stiffness may result from an optimization of cell–substrate and cell–cell interactions. It has been shown that integrins and cadherins, mediators of cell–substrate and cell–cell connections, respectively, are involved in crosstalk with intracellular mediators of contractility28,30 that govern traction force. While our use of TFM to model two cells in contact did not account for changes in the temporal stability of cell–cell contacts with stiffness or potential effects of cadherin-mediated changes in cellular contractility, our measurements of traction forces during cell–cell contact further implicate substrate mechanics as an important modulator of cellular traction forces.
In summary, we have used TFM to quantify a relationship between cell spread area, substrate stiffness, and traction force generation. We have used a multilinear regression model to show for the first time that both cell area and substrate stiffness are significant predictors of traction force in endothelial cells. Our data underscore the importance of substrate stiffness and cell spreading as key contributors to the ability of cells to generate force.
ACKNOWLEDGMENTS
This work was supported by a Scientist Development Grant from the American Heart Association and funding from the National Institutes of Health to CRK, and a Grant-In-Aid of Research from Sigma Xi, The Scientific Research Society to JPC.
REFERENCES
- 1.An SS, et al. Do biophysical properties of the airway smooth muscle in culture predict airway hyperresponsiveness? Am. J. Respir. Cell Mol. Biol. 2006;35(1):55–64. doi: 10.1165/rcmb.2005-0453OC. [DOI] [PMC free article] [PubMed] [Google Scholar]
- 2.Califano JP, Reinhart-King CA. A balance of substrate mechanics and matrix chemistry regulates endothelial cell network assembly. Cel. Mol. Bioeng. 2008;1(2–3):122–132. [Google Scholar]
- 3.Califano JP, Reinhart-King CA. Exogenous and endogenous force regulation of endothelial cell behavior. J. Biomech. 2009 doi: 10.1016/j.jbiomech.2009.09.012. doi: 10.1016/j.jbiomech.2009.09.012. [DOI] [PubMed] [Google Scholar]
- 4.Chen CS. Mechanotransduction—a field pulling together? J. Cell Sci. 2008;121(Pt 20):3285–3292. doi: 10.1242/jcs.023507. [DOI] [PubMed] [Google Scholar]
- 5.Dembo M, et al. Imaging the traction stresses exerted by locomoting cells with the elastic substratum method. Biophys. J. 1996;70(4):2008–2022. doi: 10.1016/S0006-3495(96)79767-9. [DOI] [PMC free article] [PubMed] [Google Scholar]
- 6.Dembo M, Wang YL. Stresses at the cell-to-substrate interface during locomotion of fibroblasts. Biophys. J. 1999;76(4):2307–2316. doi: 10.1016/S0006-3495(99)77386-8. [DOI] [PMC free article] [PubMed] [Google Scholar]
- 7.du Roure O, et al. Force mapping in epithelial cell migration. Proc. Natl Acad. Sci. USA. 2005;102(7):2390–2395. doi: 10.1073/pnas.0408482102. [DOI] [PMC free article] [PubMed] [Google Scholar]
- 8.Engler A, et al. Substrate compliance versus ligand density in cell on gel responses. Biophys. J. 2004;86(1 Pt 1):617–628. doi: 10.1016/S0006-3495(04)74140-5. [DOI] [PMC free article] [PubMed] [Google Scholar]
- 9.Engler A, Richert L, Wong J, Picart C, Discher D. Surface probe measurements of the elasticity of sectioned tissue, thin gels and polyelectrolyte multilayer films: correlations between substrate stiffness and cell adhesion. Surf. Sci. 2004;570:142–154. [Google Scholar]
- 10.Georges PC, Janmey PA. Cell type-specific response to growth on soft materials. J. Appl. Physiol. 2005;98(4):1547–1553. doi: 10.1152/japplphysiol.01121.2004. [DOI] [PubMed] [Google Scholar]
- 11.Guo WH, et al. Substrate rigidity regulates the formation and maintenance of tissues. Biophys. J. 2006;90(6):2213–2220. doi: 10.1529/biophysj.105.070144. [DOI] [PMC free article] [PubMed] [Google Scholar]
- 12.Lemmon CA, Chen CS, Romer LH. Cell traction forces direct fibronectin matrix assembly. Biophys. J. 2009;96(2):729–738. doi: 10.1016/j.bpj.2008.10.009. [DOI] [PMC free article] [PubMed] [Google Scholar]
- 13.Lemmon CA, et al. Shear force at the cell-matrix interface: enhanced analysis for microfabricated post array detectors. Mech. Chem. Biosyst. 2005;2(1):1–16. [PMC free article] [PubMed] [Google Scholar]
- 14.Li B, et al. Spatial patterning of cell proliferation and differentiation depends on mechanical stress magnitude. J. Biomech. 2009;42(11):1622–1627. doi: 10.1016/j.jbiomech.2009.04.033. [DOI] [PMC free article] [PubMed] [Google Scholar]
- 15.Li Y, Hu ZB, Li CF. New method for measuring poisson ratio in polymer gels. J. Appl. Polym. Sci. 1993;50(6):1107–1111. [Google Scholar]
- 16.Lo CM, et al. Cell movement is guided by the rigidity of the substrate. Biophys. J. 2000;79(1):144–152. doi: 10.1016/S0006-3495(00)76279-5. [DOI] [PMC free article] [PubMed] [Google Scholar]
- 17.Marganski WA, Dembo M, Wang YL. Measurements of cell-generated deformations on flexible substrata using correlation-based optical flow. Methods Enzymol. 2003;361:197–211. doi: 10.1016/s0076-6879(03)61012-8. [DOI] [PubMed] [Google Scholar]
- 18.Munevar S, Wang Y, Dembo M. Traction force microscopy of migrating normal and H-ras transformed 3T3 fibroblasts. Biophys. J. 2001;80(4):1744–1757. doi: 10.1016/s0006-3495(01)76145-0. [DOI] [PMC free article] [PubMed] [Google Scholar]
- 19.Nelson CM, et al. Emergent patterns of growth controlled by multicellular form and mechanics. Proc. Natl Acad. Sci. USA. 2005;102(33):11594–11599. doi: 10.1073/pnas.0502575102. [DOI] [PMC free article] [PubMed] [Google Scholar]
- 20.Ott RL, Longnecker M. An Introduction to Statistical Methods and Data Analysis. Pacific Grove, CA: Duxbury Press; 2001. p. 1184. [Google Scholar]
- 21.Paszek MJ, Weaver VM. The tension mounts: mechanics meets morphogenesis and malignancy. J. Mammary Gland. Biol. Neoplasia. 2004;9(4):325–342. doi: 10.1007/s10911-004-1404-x. [DOI] [PubMed] [Google Scholar]
- 22.Paszek MJ, et al. Tensional homeostasis and the malignant phenotype. Cancer Cell. 2005;8(3):241–254. doi: 10.1016/j.ccr.2005.08.010. [DOI] [PubMed] [Google Scholar]
- 23.Pless DD, et al. Specific cell adhesion to immobilized glycoproteins demonstrated using new reagents for protein and glycoprotein immobilization. J. Biol. Chem. 1983;258(4):2340–2349. [PubMed] [Google Scholar]
- 24.Reinhart-King CA. Endothelial cell adhesion and migration. Methods Enzymol. 2008;443:45–64. doi: 10.1016/S0076-6879(08)02003-X. [DOI] [PubMed] [Google Scholar]
- 25.Reinhart-King CA, Dembo M, Hammer DA. Endothelial cell traction forces on RGD-derivatized polyacrylamide substrata. Langmuir. 2003;19(5):1573–1579. [Google Scholar]
- 26.Reinhart-King CA, Dembo M, Hammer DA. The dynamics and mechanics of endothelial cell spreading. Biophys. J. 2005;89(1):676–689. doi: 10.1529/biophysj.104.054320. [DOI] [PMC free article] [PubMed] [Google Scholar]
- 27.Reinhart-King CA, Dembo M, Hammer DA. Cell-cell mechanical communication through compliant substrates. Biophys. J. 2008;95(12):6044–6051. doi: 10.1529/biophysj.107.127662. [DOI] [PMC free article] [PubMed] [Google Scholar]
- 28.Tsai J, Kam L. Rigidity-dependent cross talk between integrin and cadherin signaling. Biophys. J. 2009;96(6):L39–L41. doi: 10.1016/j.bpj.2009.01.005. [DOI] [PMC free article] [PubMed] [Google Scholar]
- 29.Wang N, et al. Micropatterning tractional forces in living cells. Cell Motil. Cytoskeleton. 2002;52(2):97–106. doi: 10.1002/cm.10037. [DOI] [PubMed] [Google Scholar]
- 30.Wang Y, et al. Integrins regulate VE-cadherin and catenins: dependence of this regulation on Src, but not on Ras. Proc. Natl Acad. Sci. USA. 2006;103(6):1774–1779. doi: 10.1073/pnas.0510774103. [DOI] [PMC free article] [PubMed] [Google Scholar]
- 31.Wang YL, Pelham RJ., Jr Preparation of a flexible, porous polyacrylamide substrate for mechanical studies of cultured cells. Methods Enzymol. 1998;298:489–496. doi: 10.1016/s0076-6879(98)98041-7. [DOI] [PubMed] [Google Scholar]
- 32.Yeung T, et al. Effects of substrate stiffness on cell morphology, cytoskeletal structure, and adhesion. Cell Motil Cytoskeleton. 2005;60(1):24–34. doi: 10.1002/cm.20041. [DOI] [PubMed] [Google Scholar]
- 33.Zemel A, Safran SA. Active self-polarization of contractile cells in asymmetrically shaped domains. Phys. Rev. E Stat. Nonlin. Soft Matter Phys. 2007;76(2 Pt 1):021905. doi: 10.1103/PhysRevE.76.021905. [DOI] [PubMed] [Google Scholar]


