Abstract
Imaging of cellular structure and extended tissue in biological materials requires nanometer resolution and good sample penetration, which can be provided by current full-field transmission X-ray microscopic techniques in the soft and hard X-ray regions. The various capabilities of full-field transmission X-ray microscopy (TXM) include 3D tomography, Zernike phase contrast, quantification of absorption, and chemical identification via X-ray fluorescence and X-ray absorption near edge structure (XANES) imaging. These techniques are discussed and compared in light of results from imaging of biological materials including microorganisms, bone and mineralized tissue and plants, with a focus on hard X-ray TXM at ≤ 40 nm resolution.
Keywords: Full-field transmission X-ray microscopy, hard X-ray, bio-imaging, bone, yeast, microbes
INTRODUCTION
In order to view both subcellular and extensive intercellular structures in biological materials it is necessary to image them on the nanometer scale with sufficient penetration through the sample to obtain a 3D view. An advantage of synchrotron X-rays is their excellent transmission through biological material, high intensity to obtain images rapidly, and tunability of the X-rays for spectroscopy and/or chemical identification of absorbing elements of interest within the sample. Some of the X-ray imaging methods currently being used to obtain images of biological samples at resolutions less than 100 nm are (1) transmission X-ray microscopy (TXM) based on zone-plate focusing of the image using hard X-rays, both lab model (Tkachuk and others, 2007) and synchrotron-based (Andrews and others, 2010; Awaji and others, 2002; Chu and others, 2008; Kim and others, 2008; Neuhausler and Schneider, 2006; Neuhausler and others, 2003; Tang and others, 2006; Tian and others, 2008); (2) TXM with soft X-rays (Abraham-Peskir and others, 2002; Chao and others, 2005; Heim and others, 2009; Kim and others, 2005; Parkinson and others, 2008; Schneider and others, 2003), and (3) scanning probe microscopy using finely focused X-ray beams in both the soft X-ray (Boyce and others, 2004; Flynn and others, 2009) and hard-xray regions (Borca and others, 2009; Schmid and others, 2009). Hard X-ray fluorescence microprobe, or scanning transmission X-ray microscopy (STXM) is effective for trace element imaging, making it a useful method for chemical mapping of biological specimens (Harris and others, 2008). Using soft X-ray STXM it is possible to perform effective chemical speciation of carbon (Boyce and others, 2004) and other elements with micro-XANES (X-ray absorption near edge structure); however, fluorescence yields are very poor and thus multi-element mapping of trace components is not practical.
Full-field TXM imaging has been used to elucidate the nanoscale structure of a variety of biological samples. Soft X-ray transmission microscopy, using X-ray energies mainly in the water window above the carbon K-edge and below the O K-edge, has been used for imaging of biological materials such as such as virus membranes (Carrascosa and others, 2009), macrophages (Yamamoto and Shinohara, 2002), epithelial cells (Meyer-Ilse and others, 2001), yeast cells (Huang and others, 2009; Parkinson and others, 2008), algae (Weiss and others, 2000), spider silk (Glisovic and others, 2007) and insect attachments (Eimuller and others, 2008). Its main advantages are that C and N within the sample absorb strongly in the water window so that biological organic material has excellent contrast. It has better sample penetration than electron microscopy, on the order of 5–10 microns, facilitating 3D tomography of cells and other samples ≤ 10 microns thick.
Because of the deeper penetration of hard X-rays through biological material even thicker specimens can be imaged, enabling 2D imaging and tomography of extended tissue areas up to 40–60 microns thick. Hard X-ray transmission microscopy has been used to image biological materials such as yeast (Chen and others, 2010), hair (Jeon and others, 2008), human cells (Kim and others, 2008), as well as extended areas of bone and mineralized tissue (Andrews and others, 2010) and microbes in plant roots (Patty and others, 2009). In this paper we will focus on current transmission X-ray microscopic techniques being used for biological imaging, with an emphasis on hard X-ray TXM.
EXPERIMENTAL SETUP
Transmission X-ray Microscope
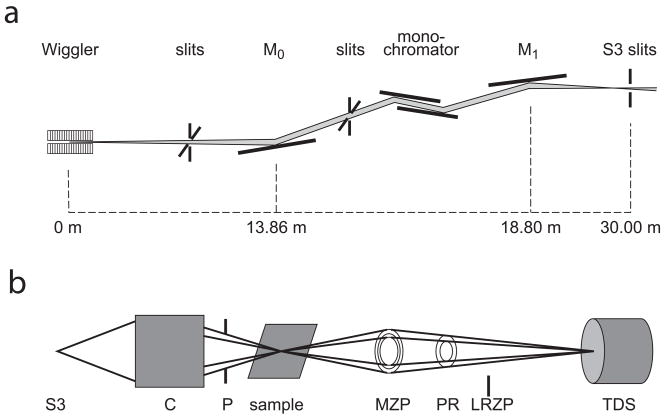
In a typical TXM synchrotron setup (Fig. 1) the X-ray beam is first focused with mirrors, and energy tuned with a monochromator. Because of the small field of view (FOV) it is very helpful to have a feedback system to adjust the mirrors to keep the beam vertically stable. TXM optics consist in general of a condenser to focus light upon the sample, and zone plate to magnify the image onto a detector (Zschech and others, 2008). The X-ray beam is typically focused onto the sample with a condenser using Kirkpatrick-Baez mirrors (Sakdinawat and Liu, 2008), Fresnel zone plate (Feng and others, 2007) or elliptical capillary (Zeng and others, 2008). A reflective capillary condenser has the advantage over a zone plate that it has increased numerical aperture and focusing efficiency. The condenser can be scanned to increase the field of view (FOV), which generally ranges from 10 to 30 microns. A pinhole removes any unfocused beam. The sample stage generally has x, y, z and theta motion for tomography, and may be incorporated into a cryostat for sample cooling and minimization of X-ray damage to the sample (Schneider and others, 2002). X-rays are focused onto the detector by a zone plate objective whose outer dimension determines the theoretical resolution of the instrument e.g. ΔrRayleigh = 1.22 Δr; whereΔrRayleigh is the Rayleigh resolution limit, and Δr is the outermost zone width. Resolution in practice can reach as low as half the Rayleigh limit (Chao and others, 2005). Zone plate efficiency decreases as the outermost dimension decreases, and increasing thickness e.g. with stacked zone plates (Feng and others, 2007) can increase efficiency.
Fig. 1.
Typical transmission X-ray microscope setup (a) includes monochromator, and mirrors to focus beam on slits (S3). Within microscope (b) is a condenser (C) to focus beam onto sample, pinhole (P) to remove unfocused beam, x-y-z-θ sample stage with or without cryostat, micro zone plate (MZP), and optional phase ring (PR) for Zernike phase contrast. A low resolution zone plate (LRZP) is used to align the phase ring, and is removed for imaging. Transmission detector system (TDS) consists of scintillator to convert X-rays to visible light, objective and CCD detector. Diagrams are not to scale. Figure reproduced from Andrews et al. Micros. Microanal. (2010) 16: 327-336.
To enhance contrast a phase ring may be added in the back focal plane of the zone plate for Zernike phase contrast (Momose, 2005; Sakdinawat and Liu, 2008; Schmahl and others, 1994). This is particularly useful for hard X-ray imaging of low-Z materials such as organic biological tissue that is relatively transparent to hard energy X-rays. The phase ring can be aligned using a low-resolution zone plate so that light undeflected by the sample is passed through it to alter its phase, enhancing contrast of the final image. Within the detector system a scintillator screen converts X-rays to visible light and an objective provides the final magnification onto the CCD camera, with ideal pixel size smaller than the overall resolution of the instrument, to provide the final image. Total magnification is on the order of 400–1000×, with resolutions well under 100 nm; as high as 20–40 nm for most biological applications. Imaging times are on the order of 1–100 seconds per image for synchrotron TXM, depending on source intensity, energy, optics and inherent contrast within the sample.
Sample preparation
An overall advantage of samples prepared for TXM is that they can be easily portable for imaging with complementary methods such as optical microscopy, microprobe, AFM, and TEM. For example, a fluorescent labeled frozen sample can be imaged first with optical microscopy followed by soft X-ray TXM (McDermott and others, 2009). TXM samples in solution are best imaged frozen, for example in a capillary system (Le Gros and others, 2005) which provides 180 degree rotation for tomography. For easy rotation firm material such as bone can also be mounted on the tip of a quartz or metal needle. Softer samples can be deposited onto a flat substrate such as a silicon nitride window or metal-free tape. They can be anchored within a c-shaped support or rectangular window to anchor the sample from above and below, in the case of longer flexible samples such as hair or fibers, or clamped directly onto a sample holder. Cells can be fixed and dried by critical point drying or lyophilization, or merely dried for imaging in ambient conditions. Because hard X-ray TXM does not image proteins, fixing of samples should not affect the overall image.
Sample thickness should be less than the depth of focus; typically 5 microns or less for soft X-ray microscopy, and as high as 40–60 microns for hard X-ray microscopy. Cross sections e.g. 1–20 microns thick can be sliced with microtomes or ultramicrotomes. Rigid samples such as mineralized tissue can be sliced followed by diamond wheel polishing to further decrease thickness. Softer tissues can be embedded in resin before slicing. Slices can be mounted on silicon nitride windows or metal-free tape, which are easily penetrated by hard X-rays. The overall sample length and width can be greater than the field of view because the sample stage can be raster scanned to provide a series of images compiled as a mosaic image to cover a wider area than the FOV (e.g. as seen in Fig. 4A and 6). By acquiring tomography data using mosaic images (e.g. as used for mineral density determination in bone, Fig. 6), thickness can exceed the FOV, although sample width and thickness should not exceed the depth of focus of the instrument so that the sample remains fully in focus at all imaging angles.
Fig. 4.
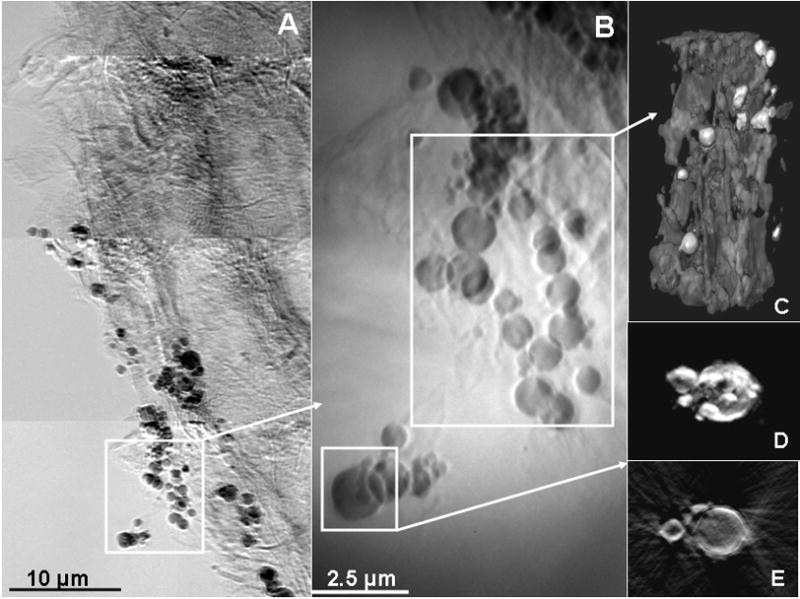
TXM mosaic transmission image of S. foliosa roots taken at 9 keV in absorption contrast shows dark particles and dark channels due to absorption by Hg (A). Blowup (B) shows greater detail. 2D stills (-ln(I/I0)) from tomography of particles from (B) show particles with greatest absorption (lightest), possibly surrounded by biofilms (C). 2D tomographic still (D) and reconstructed slice (E) of large particle indicate that highest Hg concentrations (lightest intensity) are on the outside of the fairly hollow particles. Figure reproduced from Patty et al. Environ. Sci. Technol. 2009, 43, 7397–7402.
Fig. 6.
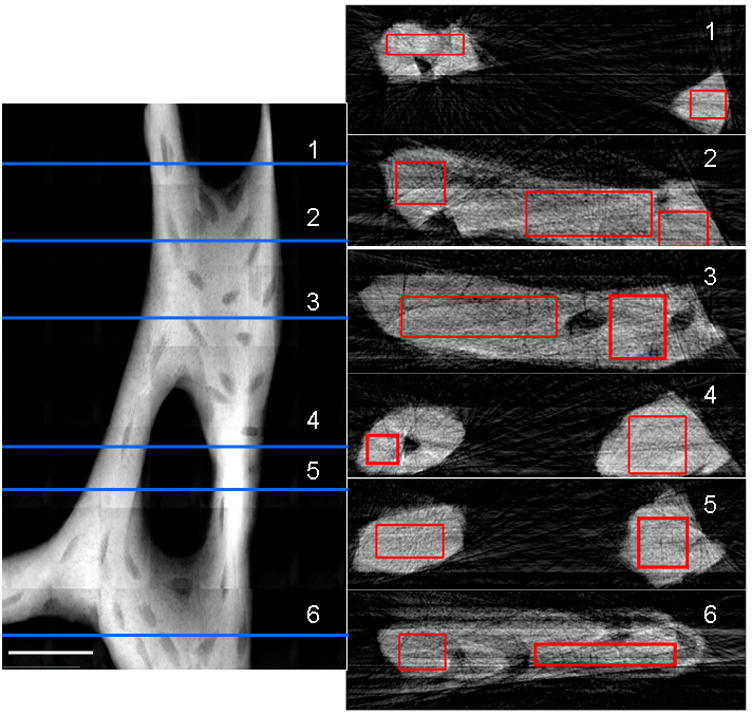
TXM 2D mosaic absorption (ln(I0/I)) image of trabecula from mouse tibia at 5.4 keV (left side). Trabecula was imaged every 5 degrees from −90 to 90 degrees to determine 3D geometry. Scale bar is 25 μm. Numbered slices (1–6) reconstructed at horizontal lines on the left are depicted on the right. Average attenuation values determined for the rectangular regions on the slices were 300–365 cm−1 in plate-like regions and 345–370 cm−1 in rod-like trabecular regions, or 44–53% and 51–54% of rod-like crystalline chlorapatite, respectively. Figure reproduced from Andrews et al. Micros. Microanal. (2010) 16: 327-336.
EXAMPLES OF FULL-FIELD X-RAY IMAGING OF BIOMATERIALS
Absorption and Zernike phase contrast
Using hard X-rays, extended regions of biological tissue such as microbes and plants can be viewed without Zernike phase contrast if they contain concentrations of heavier absorbing elements, as in the case of Saccharomyces cerevisiae treated with gold chloride to produce nanoparticles (Fig 2A) or mineralized tissue such as bone (Fig. 6). Gold immunolabeling and quantum dots (Stollberg and others, 2007) can also help to image structures bound to specific functional groups.
Fig. 2.
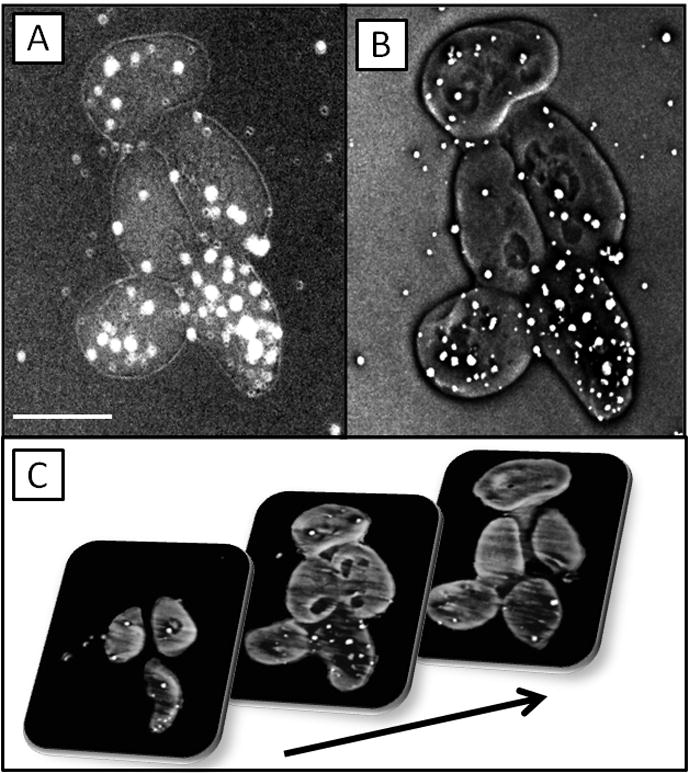
TXM images (-ln I/I0) of S. cerevisiae at 5.4 keV (A) in absorption contrast and (B) in Zernike phase contrast, and reconstructed slices from tomography (C) of the yeast cells imaged every 1 degree from −70 to 70 degrees. Scale bar in (A) is 4 microns. (Highest absorption = lightest gray). All images in this paper have been reference corrected.
Edges within a sample can be enhanced with Zernike phase contrast (Fig 2B), which is particularly useful for samples containing mainly low-Z elements that do not significantly attenuate hard X-rays, because it can increase contrast in these materials up to a factor of 1000. Phase and absorption contrast methods are complementary because it is convenient to map out the morphology of the organic material of a cell or tissue using Zernike phase contrast, and to compare this with the distribution of highly attenuating elements such as gold or other elements within a sample using absorption contrast. For example, in the Zernike phase contrast TXM image shown in Fig. 2B, interior organelles within the yeast are clearly visible. The gold nanoparticles can clearly be seen in the absorption contrast image (Fig 2A) to have significantly greater X-ray attenuation than the surrounding organic material containing mainly C, O, N and H. The absorption contrast reflects the true relative attenuation by elements within the sample, and artifacts such as the “halo effect” that can be seen at the edges of a sample in Zernike phase contrast are minimized.
Tomography
Because both hard and soft X-rays have significant penetration into biological tissue, samples can be imaged from various angles for tomography. Gold particles, typically about 0.5–1 micron in diameter, can be sprinkled on the sample for use as fiduciary markers for easier alignment of the images. Using methods such as filtered backprojection or an iterative method, a 3D image is reconstructed (Buzug, 2008) to provide quantitative information on arrangement and localized absorption within each component that appears within the original 2D view. In hard X-ray tomography of S. cerevisiae (Fig. 2C) reconstructed slices reveal that Au nanoparticles have penetrated the interior of yeast cells, which is difficult to determine from the 2D views (Figs. 2A and 2B). A 2D TXM image is a result of projection of X-rays transmitted through the entire sample, but from reconstructed slices a single-voxel thick map of X-ray attenuation by each individual component is obtained. Segmentation can be done by hand or using algorithms to distinguish components with different ranges of attenuation coefficients. 3D visualization and analysis of the final reconstruction can be done with commercial software such as Avizo (Visualization Sciences Group) or Amira (Visage Imaging).
Using soft X-rays in the water window, significant attenuation of the beam by C and N in the sample provides contrast. In reconstructed slices from soft X-ray tomography of Saccharomyces pombe (Fig. 3a-c) various cell organelles may be seen (Parkinson and others, 2008). The relative absorption in the image represents the actual X-ray attenuation by the particular organelle within the sample (darker corresponds to greater X-ray absorption). Because lipids have higher X-ray attenuation than proteins at this energy, the darker components most likely correspond to lipid-containing organelles.
Fig. 3.
S. pombe cells imaged by soft X-ray tomography. (a–c) One-voxel-thick slices through the reconstructed volumes of four cells (including mother and daughter cells which have not separated), with the gray value of each voxel corresponding to the X-ray absorption coefficient of the material (darker gray = higher absorption). The cell in (a) is 5 μm in length. Figure modified from D.Y. Parkinson et al./Journal of Structural Biology 162 (2008) 380–386.
In TXM imaging of roots of Spartina foliosa (cordgrass) that has absorbed mercury, several techniques are combined including 2D raster scanning (mosaics) and tomography (Patty and others, 2009). These plants are dominant florae in the San Francisco Bay Area, and TXM can provide insight into the biochemical transformations of mercury that occur in the microbes in their root zone. In the mosaic transmission image on the left, Hg can be seen in dark streaks through the root and root hairs and in the dark spheres surrounding the root (Fig. 4A). Hg localization was confirmed by imaging with micro X-ray fluorescence (μ-XRF) on another beam line. Tomography of the spheres (2D projection blow up in Fig 4B) revealed a cluster of microbes with an extended region of biofilm surrounding them (3D rendition in Fig. 4C). Slices from tomography of an individual particle (2D projection in Fig 4D) revealed that the particles are hollow (Fig 4E), consistent with microorganisms such as sulfate-reducing bacteria with Hg bound mainly to the cell wall. (In Fig. 4C-E images are −ln (I/Io) where I/I0 is the referenced corrected image, thus lightest gray = highest absorption.)
Quantification of mineral attenuation in bone
Using a combination of reference-corrected 2D absorption images (-ln I/Io), and tomography to determine exact thickness of the attenuating component at each pixel, it is possible to quantify concentration within a TXM image relative to a calibration standard. Quantitative information from hard X-ray tomography has been used to examine concentrations of apatite, the main material responsible for X-ray attenuation by bone and mineralized tissue, in mouse bone trabeculae via calibration of X-ray attenuation with pure crystalline apatite (Andrews and others, 2010). This method can be used to determine nanoscale differences in mineral content in different regions of bone, relevant in studies of bone disease and treatment.
A ratio of the absorption of pure crystalline apatite (−ln I/I0; Fig 5a) vs. thickness (Fig. 5b) creates a plot for X-ray attenuation by pure crystalline apatite at 5.4 keV (Fig. 4c). The attenuation coefficient (682 cm−1) for pure apatite determined from least-squares fitting was compared with attenuation coefficients from mouse bone trabeculae (e.g. Fig. 6) to determine the mineral density in the trabeculae compared with pure apatite. For tomography of the trabecula, which was thicker than the FOV, mosaic images were collected every 5 degrees from −90 to 90 degrees, and reconstructed slices were threshold filtered to create binary images from which thickness was measured. The plate-like regions of the trabecula in Fig. 6 were found to be less dense than rod-like regions, with attenuation coefficients of 300–365 cm−1 in plate-like regions and 345–370 cm−1 in rod-like regions; or 44–53% and 51–54% of rod-like crystalline chlorapatite, respectively.
Fig. 5.
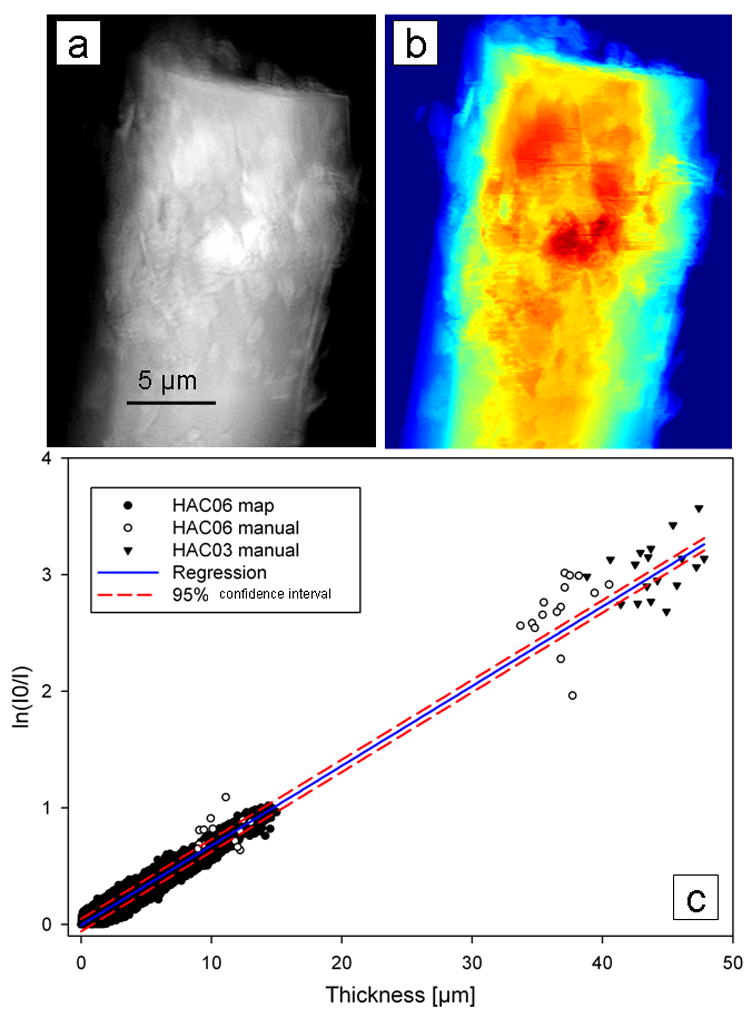
(a) Absorption (ln(I0/I)) image of rod-like crystalline chlorapatite samples (HAC06 and HACO3) and (b) thickness map from reconstructed slices. (c) Plot of absorption vs. thickness for 2 crystalline standards includes points determined manually and using MATLAB. Linear regression yielded an attenuation coefficient of 683 cm−1. Figure reproduced from Andrews et al. Micros. Microanal. (2010) 16: 327-336.
Localized density measurements such as these can provide ultrastructural information on densities near lacunae and canaliculi in bone, and can distinguish e.g. apatite density in new (post treatment) and older (pre-treatment) bone. The unique information provided from TXM imaging and quantification can be useful in studies of nanoscale effects of osteoporosis and other bone disease and their treatments.
Quantification of Hg absorption in plant root
Attenuation coefficients from TXM tomography can be used for identification and quantification of a variety of chemical elements. In any TXM image, within a 2D FOV the attenuation results from all components along the projection axis, and thus tomography is necessary to deconvolute these contributions, particularly in the case of mixed materials. An attenuation coefficient from tomographic slices of single-voxel thickness can be used to elucidate the chemistry of each unique component within a 2D FOV.
TXM was used for tomographic imaging (−90 to 90 degrees in 1-degree steps) of Hg in roots of Medicago sativa (alfalfa) at 5400 eV (particle indicated in the 2D projection image shown in Fig. 7A). Hg in the particles was confirmed with micro X-ray fluorescence (μ-XRF) (Carrasco-Gil, submitted for publication). A slice from tomographic reconstruction (Fig. 7B) and a matrix mesh reconstruction of the attenuation within the single slice (Fig. 7C) indicate that the particle is solid. Because the particle contains few pixels, least squares fitting was used to obtain an attenuation coefficient of 7395 ± 190 cm−1 from the plot (Fig. 8) of absorption (ln I0/I) vs. thickness from voxels of the single slice. Pure Hg at 5400 eV has an attenuation of 7895 cm−1 (Henke and others, 1993). Therefore the density of Hg in this particle in alfalfa root is approximately 94% of that for pure mercury, consistent with Hg bound to probably one other light element, possibly sulfur (HgS has attenuation of 7325 cm−1). Hg speciation in the particle can be determined more precisely using XANES imaging, in which TXM images are acquired as the monochromator is moved up an X-ray absorption edge. (XANES imaging is described further in the section below.) Initial XANES spectra created from TXM absorption images of the particles in alfalfa root are consistent with Hg-S bonding in the particle.
Fig. 7.
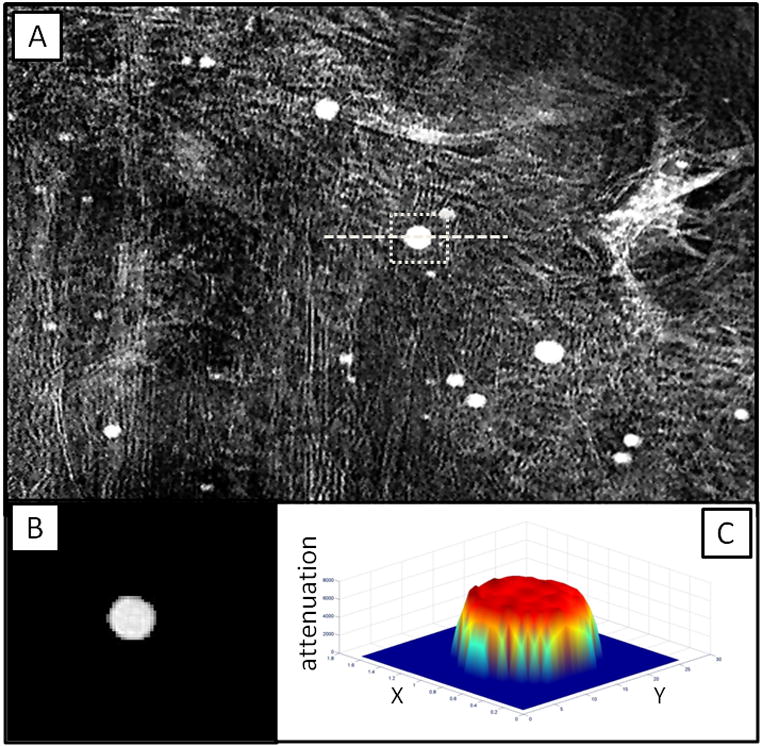
2D TXM projection image at 5400 eV in absorption contrast (A) of root zone of Medicago sativa (alfalfa) grown hydroponically with Hg. 3D tomography of spot indicated by square with dotted line in (A) was acquired from −70 to 70 degrees in 1 degree steps. Reconstructed slice taken along dashed line in (A) is shown in (B) along with matrix mesh reconstruction of X-ray attenuation across the slice (C).
Fig. 8.
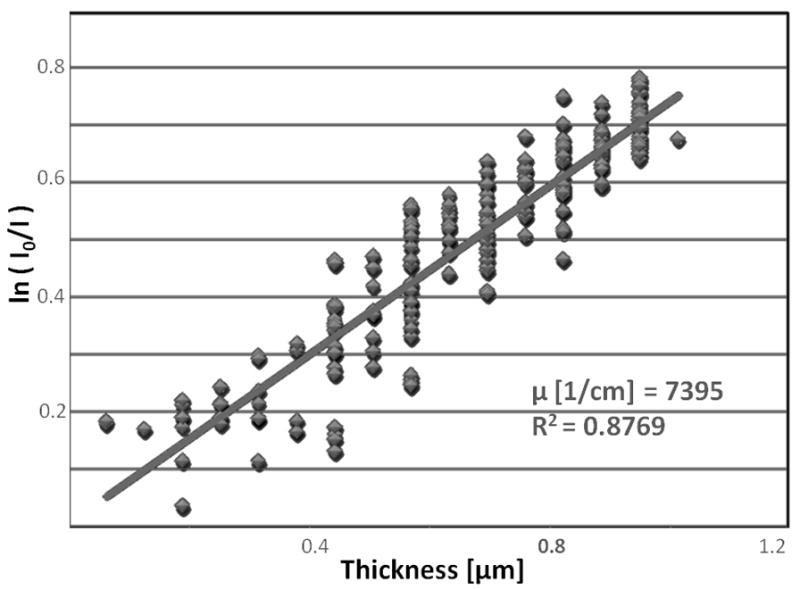
Plot of absorption from the single reconstructed slice (see Fig. 7B) from tomographic reconstruction of the sphere from alfalfa root vs. thickness of the reconstructed slice yields an attenuation coefficient of 7395 ± 190 cm−1 for Hg in that slice.
Further chemical information from XRF, spectroscopic and XANES imaging
TXM imaging can be used to elucidate elemental composition, location of particular elements within the FOV, and chemical speciation of absorbing elements with concurrent XRF, spectroscopic imaging and XANES imaging, respectively. XRF is collected from an additional detector positioned to intercept fluorescence from the sample during TXM imaging. Fluorescence multi-channel traces can be collected along with single 2D TXM images to determine elemental composition from an area within the FOV, and slits can be closed down for minimal spot size to localize the fluorescence area to 3–4 microns. XRF can also be collected during mosaic imaging to determine sample regions with the highest content of the element of interest. XRF collected along with tomography data can identify the main elements within a tomographic data set. Spot size is greater than for microprobe or nanoprobe imaging, but the final image retains the full TXM resolution. In addition, because X-rays are transmitted through the entire sample thickness in TXM, elemental information from XRF can be combined with 3D tomography which can be relatively quickly acquired (in as low as 20–30 minutes) from the full TXM FOV. Tomographic data collection would take much longer with a STXM due to the small spot size. X-ray absorption spectroscopy data, specifically X-ray absorption near edge structure (XANES) can also be collected with the fluorescence detector to obtain chemical information from the sample.
Chemical information can also be determined with spectroscopic imaging. This technique generally involves acquisition of TXM images at photon energies above and below an X-ray absorption edge for a particular element, in order to localize that particular element within a 2D or 3D FOV. For maximum spectroscopic differences, XANES can first be collected with an XRF detector as mentioned above to determine the monochromator energy for maximum absorption above the edge (“white line”) for best above/below edge contrast. Spectroscopic imaging has been used to identify Fe in comet dust particles (Andrews and others, 2009) and in mineral inclusions in synthetic diamond (Moore 2009). Spectroscopic imaging can be used with 3D tomography as well, for example to identify Ni components in solid oxide fuel cells using tomography above and below the Ni K-edge (Grew and others, 2010). Spectromicroscopy has also been used to map carbon species in polymers using soft X-rays (Hitchcock and others, 2005).
More detailed chemical speciation mapping at TXM resolution can be done with XANES imaging, in which TXM images are acquired as the monochromator is moved along an X-ray absorption edge. This is particularly important for biological samples because chemical speciation of a biologically active element such as Fe, Ca, etc. can point towards its role in physiological function. In full-field TXM the zone plate must also be moved as energy is changed for XANES imaging, because the focal length (f) is inversely proportional to wavelength (λ) as f = D Δr/λ, where D is the diameter of the zone plate and Δr is the outermost zone width. Images must be corrected for changes in alignment and magnification due to zone plate movement. XANES spectra can be composed from TXM images by plotting absorption values for single pixels, or from groups of pixels in various regions of the image, vs. photon energy. Energy steps for imaging can be taken finely enough to distinguish edge features, and can be compared with XANES spectra of model compounds for chemical speciation. Principal components analysis can be used to map different regions within the images with distinctly different XANES spectra, for spatial speciation of an element within a sample.
Summary and complementarities of TXM with other imaging methods
TXM is an excellent method for imaging of biological specimens in both Zernike phase contrast and absorption contrast, in 2D and 3D. It is a sensitive method for detecting most elements within biological tissue; mainly C, N, O for soft X-rays (although L and M edges for some metals can be detected in this range) and higher Z elements for hard X-rays. Hard X-rays can be used for imaging in absorption contrast particularly when a metal is clustered together as in the case of Hg in plant roots (Figs. 4 and 7) or when it is the main attenuating element (e.g. Ca) within the sample as in mineralized tissue and bone (Fig. 6). Nanoparticles that aggregate in clusters as small as 30–40 nm can be imaged (see e.g. Fig. 2). Identification of absorbing elements within the FOV can be verified with a combination of attenuation coefficients from tomography, X-ray fluorescence and spectroscopic and/or XANES imaging.
TXM imaging can provide detailed morphology and chemical and physiological information on biological samples. However, for more complete study of biological systems it is convenient to combine different imaging methods for complementary information. For example, using TXM the physical layout of biological tissue imaged in phase contrast can be compared with true absorption from X-ray elements within the sample imaged without the phase ring. Soft and hard X-rays can be combined similarly e.g. to provide local information on morphology and physiology by TXM imaging of biological cells with soft X-rays, and 3D information on more extensive tissue regions with hard X-rays. TXM imaging without a cryostat at any energy, however, involves fixed and/or dried samples, and causes more radiation damage than with frozen samples. Sample changing is relatively easy without the vacuum chamber generally required for cryo- imaging, however, so that various mounting methods can be tried to optimize imaging for a given sample, and samples can be portable to complementary methods such as microprobe and AFM.
Microprobe and optical microscopy can provide data complementary to TXM. The former can be used to map out elemental composition within a relatively large area of sample; and optical microscopy can be used, for example, to identify proteins by fluorescence labeling. With microprobe, XRF can be collected from significantly thicker samples over wide (mm to cm scale) regions of a sample. TXM can be used to determine nanoscale morphology of cells and other tissue contributing to the X-ray or optical fluorescence over a range of tens of microns (or hundreds wide, when mosaic imaging is done on thin enough slices). Microprobe hot spots of an element of interest such as Fe, Ca, etc., can be imaged on the nanoscale with TXM in order to better understand the morphology and biochemistry involved. TXM can supplement nanoprobe or microprobe and μ-XRF with 3D information from tomography, and with chemical speciation from full-field XRF or XANES imaging at nanometer resolution. No staining is required for imaging with either TXM or microprobe, thus the biochemistry of the original samples can be preserved. However, immunolabeling e.g. with gold nanoparticles can be used to identify regions of biological tissue with specific proteins or functional groups (Stollberg and others, 2007) for further insight into physiology.
Electron microscopy (EM) and AFM data can supplement TXM data by providing higher resolution images over specific smaller areas, albeit only with surface imaging in the case of AFM, or near-surface penetration in the case of EM. In comparison with TXM, SEM and TEM samples require significantly more sample preparation.
Future of transmission X-ray microscopy
With current research on finer zone plates, TXM imaging can approach resolution as high as 10 nm in the near future. With more sensitive CCD cameras with higher quantum efficiencies and smaller pixel sizes, TXM resolution can be further increased. “Flash” imaging at high brightness facilities such as the LCLS free electron laser (LCLS, 2010) will acquire images on time scales so small that sample movement and radiation damage can be minimal. Theoretically, repeated samples can be dropped through the FOV for imaging to provide a statistically averaged 3D view of very small structures, perhaps even on the molecular level.
More sophisticated software can be implemented to improve throughput with automated data collection to align and focus samples, follow features of interest, and collect 2D and 3D data sets on extended areas with intermittent reference frames. Improved data processing will include automated alignment and reconstruction of tomographic data sets including mosaic tomography, and segmentation of tomographic data sets by attenuation coefficient, which is now often done by hand. Algorithms can be used to locate specific features, such as smaller nanoparticles bound to physiologically functional groups (Stollberg and others, 2007). In addition, as more users grow familiar with the technique and perfect the preparation of samples (which although relatively simple can require significant forethought and trial imaging) even more useful and efficient data will emerge from TXM imaging. Overall, TXM has been a productive method for imaging of biological samples on the nanoscale, and the future looks even brighter.
Acknowledgments
We thank Sandra Carrasco-Gil for providing the alfalfa root for TXM imaging. We thank the publishers and contributors of the images we have used in this manuscript. The transmission X-ray microscope at SSRL has been supported by the National Institutes of Health (NIH)/National Institute of Biomedical Imaging and Bioengineering (NIBIB) grant number 5R01EB004321. SSRL is supported by the Department of Energy, Office of Basic Energy Sciences.
References
- Abraham-Peskir JV, Chantler E, Uggerhoj E, Fedder J. Response of midpiece vesicles on human sperm to osmotic stress. Hum Reprod. 2002;17(2):375–82. doi: 10.1093/humrep/17.2.375. [DOI] [PubMed] [Google Scholar]
- Andrews JC, Almeida EA, van der Meulen MCH, Alwood JS, Lee C, Liu Y, Chen J, Meirer F, Feser M, Gelb J, Rudati J, Tkachuk A, Yun W, Pianetta P. Nanoscale X-ray microscopic imaging of mammalian mineralized tissue. Microscopy and Microanalysis. 2010;16(3):327–336. doi: 10.1017/S1431927610000231. [DOI] [PMC free article] [PubMed] [Google Scholar]
- Andrews JC, Brennan S, Pianetta P, Ishii H, Gelb J, Feser M, Rudati J, Tkachuk A, Yun W. Full-field transmission X-ray microscopy at SSRL. Journal of Physics Conference Series. 2009;186:012002–1–012002–3. doi: 10.1088/1742-6596/186/1/012081. [DOI] [PMC free article] [PubMed] [Google Scholar]
- Awaji M, Suzuki Y, Takeuchi A, Takano H, Kamijo N, Tamura S, Yasumoto M. Zernike-type X-ray imaging microscopy at 25 keV with Fresnel zone plate optics. J Synchrotron Radiat. 2002;9(Pt 3):125–7. doi: 10.1107/s0909049502004223. [DOI] [PubMed] [Google Scholar]
- Borca CN, Grolimund D, Williman M, Meyer B, Jefimovs K, Vila-Comamala J, David C. The microXAS beamline at the Swiss Light Source: towards nano-scale imaging. Journal of Physics Conference Series. 2009;186:012003–1–012003–3. [Google Scholar]
- Boyce CK, Zwieniecki MA, Cody GD, Jacobsen C, Wirick S, Knoll AH, Holbrook NM. Evolution of xylem lignification and hydrogel transport regulation. Proc Natl Acad Sci U S A. 2004;101(50):17555–8. doi: 10.1073/pnas.0408024101. [DOI] [PMC free article] [PubMed] [Google Scholar]
- Buzug TM. Computed tomography from photon statistics to modern cone-beam CT. Berlin, Heidelberg: Springer-Verlag; 2008. [Google Scholar]
- Carrascosa JL, Chichon FJ, Pereiro E, Rodriguez MJ, Fernandez JJ, Esteban M, Heim S, Guttmann P, Schneider G. Cryo-X-ray tomography of vaccinia virus membranes and inner compartments. J Struct Biol. 2009;168(2):234–9. doi: 10.1016/j.jsb.2009.07.009. [DOI] [PubMed] [Google Scholar]
- Chao W, Harteneck BD, Liddle JA, Anderson EH, Attwood DT. Soft X-ray microscopy at a spatial resolution better than 15 nm. Nature. 2005;435:1210–1213. doi: 10.1038/nature03719. [DOI] [PubMed] [Google Scholar]
- Chen J, Yang Y, Zhang X, Andrews JC, Pianetta P, Guan Y, Liu G, Xiong Y, Wu Z, Tian Y. 3D nanoscale imaging of the yeast, Schizosaccharomyces pombe, by full-field transmission X-ray microscopy at 5.4 keV. Anal Bioanal Chem. 2010 doi: 10.1007/s00216-010-3617-8. [DOI] [PMC free article] [PubMed] [Google Scholar]
- Chu YS, Yi JM, De Carlo F, Shen Q, Lee W-K, Wu HJ, Wang CL, Wang JY, Liu CJ, Wang CH, Wu SR, Chien CC, Hwu Y, Tkachuk A, Yun W, Feser M, Liang KS, Yang CS, Je JH, Margaritondo G. Hard X-ray microscopy with Fresnel zone plates reaches 40 nm Rayleigh resolution. Applied Physics Letters. 2008;92:103119–1–103119–3. [Google Scholar]
- Eimuller T, Guttmann P, Gorb SN. Terminal contact elements of insect attachment devices studied by transmission X-ray microscopy. J Exp Biol. 2008;211(Pt 12):1958–63. doi: 10.1242/jeb.014308. [DOI] [PubMed] [Google Scholar]
- Feng Y, Feser M, Lyon A, RIshton S, Zeng X, Chen S, Sassolini S, Yun W. Nanofabrication of high aspect ratio 24 nm X-ray zone plates for X-ray imaging applications. J Vac Sci Technol B. 2007;25(6):2004–2007. [Google Scholar]
- Flynn GJ, Wirick S, Keller LP, Jacobsen C. STXM search for carbonate in samples of comet 81P/Wild2. Journal of Physics Conference Series. 2009;186:012085–1–012085–3. [Google Scholar]
- Glisovic A, Thieme J, Guttmann P, Salditt T. Transmission X-ray microscopy of spider dragline silk. Int J Biol Macromol. 2007;40(2):87–95. doi: 10.1016/j.ijbiomac.2006.06.015. [DOI] [PubMed] [Google Scholar]
- Grew KN, Chu YS, Yi J, Peracchio AA, Izzo JRJ, Hwu Y, De Carlo F, Chiu WKS. Nondestructive nanoscale 3D elemental mapping and analysis of a solid oxide fuel cell anode. Journal of the Electrochemical Society. 2010;157(6):B783–B792. [Google Scholar]
- Harris HH, Vogt S, Eastgate H, Lay PA. A link between copper and dental caries in human teeth identified by X-ray fluorescence elemental mapping. Journal of Biological Inorganic Chemistry. 2008;13(2):303–306. doi: 10.1007/s00775-007-0321-z. [DOI] [PubMed] [Google Scholar]
- Heim S, Guttmann P, Rehbein S, Werner S, Schneider G. Energy-tunable full-field X-ray microscopy: Cryo-tomography and nona-spectroscopy with the new BESSY TXM. Journal of Physics Conference Series. 2009;186:012041–1–012041–3. [Google Scholar]
- Henke BL, Gullikson EM, Davis JC. X-ray interaction: photoabsorption, scattering, tgransmisison and reflection at E=50–30000 eV, Z=1–92. Atomic Data and Nuclear Data Tables. 1993;54(2):181–342. [Google Scholar]
- Hitchcock AP, Stover HDH, Croll LM, Childs RF. Chemical mapping of polymer microstructure using soft X-ray spectromicroscopy. Aust J Chem. 2005;58:423–432. [Google Scholar]
- Huang X, Nelson J, Kirz J, Lima E, Marchesini S, Miao H, Neiman AM, Shapiro D, Steinbrener J, Stewart A, Turner JJ, Jacobsen C. Soft X-ray diffraction microscopy of a frozen hydrated yeast cell. Physical Review Letters. 2009;103:198101–1–198101–4. doi: 10.1103/PhysRevLett.103.198101. [DOI] [PMC free article] [PubMed] [Google Scholar]
- Jeon SY, Goo JW, Hong SP, Oh TH, Youn HS, Lee WS. A new method for investigation of the hair shaft: hard X-ray microscopy with a 90-nm spatial resolution. Yonsei Med J. 2008;49(2):337–40. doi: 10.3349/ymj.2008.49.2.337. [DOI] [PMC free article] [PubMed] [Google Scholar]
- Kim BI, Shin HS, Hong CK, Hwang CC, Kim JG, Kim KW, Choi KS, Yoon KH, Kim DE. Full-field soft X-ray microscope at Pohang Light Source. IPAP Conference Series. 2005;7:70–72. [Google Scholar]
- Kim GB, Yoon YJ, Shin TJ, Youn HS, Gho YS, Lee SJ. X-ray imaging of various biological samples using a phase-contrast hard X-ray microscope. Microsc Res Tech. 2008;71(9):639–43. doi: 10.1002/jemt.20601. [DOI] [PubMed] [Google Scholar]
- LCLS. Linac Coherent Light Source. SLAC National Accelerator Laboratory; 2010. Coherent X-ray Imaging. [Google Scholar]
- Le Gros MA, McDermott G, Larabell CA. X-ray tomography of whole cells. Curr Opin Struct Biol. 2005;15(5):593–600. doi: 10.1016/j.sbi.2005.08.008. [DOI] [PubMed] [Google Scholar]
- McDermott G, Le Gros MA, Knoechel CG, Uchida M, Larabell CA. Soft X-ray tomography and cryogenic light microscopy: the cool combination in cellular imaging. Trends Cell Biol. 2009;19(11):587–95. doi: 10.1016/j.tcb.2009.08.005. [DOI] [PMC free article] [PubMed] [Google Scholar]
- Meyer-Ilse W, Hamamoto D, Nair A, Lelievre SA, Denbeaux G, Johnson L, Pearson AL, Yager D, Legros MA, Larabell CA. High resolution protein localization using soft X-ray microscopy. J Microsc. 2001;201(Pt 3):395–403. doi: 10.1046/j.1365-2818.2001.00845.x. [DOI] [PubMed] [Google Scholar]
- Momose A. Recent advances in X-ray phase imaging. Japanese Journal of Applied Physics. 2005;44(9A):6355–6367. [Google Scholar]
- Neuhausler U, Schneider G. Non-destructive high-resolution X-ray imaging of ULSI microelectronics using keV X-ray microscopy in Zernike phase contrast. Microelectronic Engineering. 2006;83:1043–1046. [Google Scholar]
- Neuhausler U, Schneider G, Ludwig W, Meyer MA, Zschech E, Hambach D. X-ray microscopy in Zernike phase contrast mode at 4 keV photon energy with 60 nm resolution. J Phys D: Appl Phys. 2003;36:A79–A82. [Google Scholar]
- Parkinson DY, McDermott G, Etkin LD, Le Gros MA, Larabell CA. Quantitative 3-D imaging of eukaryotic cells using soft X-ray tomography. J Struct Biol. 2008;162(3):380–6. doi: 10.1016/j.jsb.2008.02.003. [DOI] [PMC free article] [PubMed] [Google Scholar]
- Patty C, Barnett B, Mooney B, Kahn A, Levy S, Liu Y, Pianetta P, Andrews JC. Using X-ray microscopy and Hg L3 XANES to study Hg binding in the rhizosphere of Spartina cordgrass. Environ Sci Technol. 2009;43(19):7397–402. doi: 10.1021/es901076q. [DOI] [PMC free article] [PubMed] [Google Scholar]
- Sakdinawat A, Liu Y. Phase contrast soft X-ray microscopy using Zernike zone plates. Opt Express. 2008;16(3):1559–64. doi: 10.1364/oe.16.001559. [DOI] [PubMed] [Google Scholar]
- Schmahl G, Rudolph D, Guttmann P, Schneider G, Thieme J, Niemann B, Wilhein T. Phase contrast X-ray microscopy. Synchrotron Radiation News. 1994;7(4):19–22. [Google Scholar]
- Schmid I, Raabe J, Quitmann C, Vranjkovic S, Hug HJ, Fink RH. NanoXAS, a novel concept for high resolution microscopy. Journal of Physics Conference Series. 2009;186:012015–1–012015–3. [Google Scholar]
- Schneider G, Anderson E, Vogt S, Knochel C, Weiss D, LeGros MA, Larabell CA. Computed tomography of cryogenic cells. Surface Review and Letters. 2002;9(1):177–183. [Google Scholar]
- Schneider G, Denbeaux G, Anderson EH, Pearson AL, Bates W, Vogt S, Knochel C, Meyer MA, Zschech E. High resolution X-ray tomography with applications in biology and materials science. Journal Physics IV. 2003;104:607–613. [Google Scholar]
- Stollberg H, Guttmann P, Takman PA, Hertz HM. Size-selective colloidal-gold localization in transmission X-ray microscopy. J Microsc. 2007;225(Pt 1):80–7. doi: 10.1111/j.1365-2818.2007.01717.x. [DOI] [PubMed] [Google Scholar]
- Tang M-T, Yin G-C, Song Y-F, Chen J-H, Tsang K-L, Liang KS, Chen F-R, Duewer F, Yun W. Hard X-ray microscopy with sub-30 nm spatial resolution at NSRRC. IPAP Conference Series. 2006;7:15–17. [Google Scholar]
- Tian Y, Li W, Chen J, Liu L, Liu G, Tkachuk A, Tian J, Xiong Y, Gelb J, Hsu G, Yun W. High resolution hard X-ray microscope on a second generation synchrotron source. Rev Sci Instrum. 2008;79(10):103708. doi: 10.1063/1.3002484. [DOI] [PubMed] [Google Scholar]
- Tkachuk A, Duewer F, Cui H, Feser M, Wang S, Yun W. X-ray computed tomography in Zernike phase contrast mode at 8 keV with 50-nm resolution using Cu rotating anode X-ray source. Z Kristallogr. 2007;222:650–655. [Google Scholar]
- Weiss D, Schneider G, Niemann B, Guttmann P, Rudolph D, Schmahl G. Computed tomography of cryogenic biological specimens based on X-ray microscopic images. Ultramicroscopy. 2000;84(3–4):185–97. doi: 10.1016/s0304-3991(00)00034-6. [DOI] [PubMed] [Google Scholar]
- Yamamoto Y, Shinohara K. Application of X-ray microscopy in analysis of living hydrated cells. Anat Rec. 2002;269(5):217–23. doi: 10.1002/ar.10166. [DOI] [PubMed] [Google Scholar]
- Zeng X, Duewer F, Feser M, Huang C, Lyon A, Tkachuk A, Yun W. Ellipsoidal and parabolic glass capillaries as condensers for X-ray microscopes. Appl Opt. 2008;47(13):2376–81. doi: 10.1364/ao.47.002376. [DOI] [PubMed] [Google Scholar]
- Zschech E, Yun W, Schneider G. High-resolution X-ray imaging - a powerful nondestructive technique for applications in semiconductor industry. Appl Phys A. 2008;92:423–429. [Google Scholar]


