Abstract
The current study analyzed reverse phase protein arrays (RPPA) as a means to experimentally validate biomarkers in blood samples. One µl samples of sera (n=71), and plasma (n=78) were serially diluted and printed on nitrocellulose-coated slides. CA19-9 levels from RPPA results were compared with identical patient samples as measured by ELISA. There was a strong correlation between RPPA and ELISA (r=0.87) as determined by scatter plots. Sample reproducibility of CA19-9 levels was excellent (interslide correlation r=0.88; intraslide correlation r=0.83). The ability of RPPA to accurately distinguish CA19-9 levels between cancer and non-cancer samples were determined using receiver operating characteristic curves and compared with ELISA. The AUC for RPPA and ELISA was comparable (0.87 and 0.86, respectively). When the mean CA19-9 levels of normal samples was used as a cutoff for RPPA and compared with the standard clinical ELISA cutoff, comparable specificities (71% for both) were observed. Notably, RPPA samples normalized to albumin showed increased sensitivity compared to ELISA (90% vs 75%). As RPPA is a high throughput method that shows results comparable to that of ELISA, we propose that RPPA is a viable technique for rapid experimental screening and validation of candidate biomarkers in blood samples.
Keywords: biomarker, CA19-9, pancreatic cancer, reverse phase protein array
1 Introduction
Despite the dire need for, and great interest in, utilizing blood biomarkers as an early, reliable, and noninvasive means of detecting diseases such as cancer, the number of clinically relevant markers remains disappointingly low [1–4]. One case in point is pancreatic cancer. This cancer is relatively uncommon, being the 10th most frequent in incidence among males in the USA. Nevertheless, it ranks as the 4th highest in mortality in both men and women [5]. Effective treatments for pancreatic cancer are not widely available due to the typically late stage detection of the disease, and lack of reliable, cost-effective early detection methods. In clinical practice, the biomarker CA19-9 is typically used. While this marker is not useful for early detection, it is useful for monitoring the effects of cancer therapy and detecting recurrence [6, 7]. Several studies have defined a large group of candidate pancreatic cancer biomarkers based on gene profiling [8–10] and proteomics [11, 12]. A few of these candidates have been further validated using patient samples [13]. However, many other potential biomarkers remain unexamined due to the cost and difficulty of the validation studies. A recent review article summarizes the development of biomarkers in pancreatic cancer [3].
Standard approaches to biomarker validation involve ELISA or Luminex assays. The standard ELISA or Luminex assay utilizes two antibodies and one concentration of sample. In the case of pancreatic cancer, CA19-9 levels are routinely determined in clinically laboratories by an ELISA, which typically has a dynamic range of about log10(1.4) for linear range detection of the signal. Reliance on two antibodies, whether in ELISA or Luminex assays, places constraints in screening and validation assays, including identification of two specific antibodies that do not interfere with each other, and in the case of multiplexing, limits the number of markers assayable in a single sample due to increased likelihood of cross-reactivity. Conversely, reliance on one concentration of sample could result in extrapolating rather than interpolating protein levels, resulting in inaccurate quantification of sample. Therefore, the current standard methodologies for ELISA and Luminex limit their ability to perform accurate, high throughput screening, and validation for biomarkers.
Reverse phase protein array (RPPA) is becoming widely used in quantifiable, moderately high throughput protein analyses. Techniques enabling quantification in RPPA include serial dilution of samples and use of a “supercurve”[14] to interpolate all samples contained on a slide. Scores of slides can be printed from a master plate, enabling analyses of dozens of proteins on hundreds to thousands of samples. In cancer research, RPPA has been successfully used to detect differences in total protein levels or post-translational modifications in cancer cell lysates as diverse as blood (acute myeloid leukemia) [15], prostate [16], and rhabdomyosarcoma [17]. While detection of potential cancer biomarkers in serum has been reported for SELDI-TOF [7, 18], RPPA application has not yet been reported for serum markers in cancer.
To validate the use of RPPA on serum or plasma, we assayed for CA19-9 levels in samples of normal individuals or those diagnosed with chronic pancreatitis or pancreatic adenocarcinoma. We compared CA19-9 levels measured by ELISA with those obtained using RPPA and demonstrated that RPPA is comparable to ELISA for determining CA19-9 levels in serum and plasma. Further, we observed that RPPA has increased sensitivity compared to ELISA for CA19-9 levels in cancer vs non-cancer individuals when samples were adjusted for loading. As RPPA allows for serial dilution of hundreds of samples, printing of multiple slides, and has demonstrated results comparable to that of ELISA, RPPA is a viable technique for rapid screening and validation of candidate biomarkers in serum.
2 Materials and Methods
2.1 Patient samples
Plasma samples were collected at The University of Texas M. D. Anderson Cancer Center in collaboration with TexGen Research Project, which organizes sample collection and storage for several institutions in the Houston Medical Center. TexGen provided plasma samples of pancreatic adenocarcinoma patients as well as age-matched controls. In order to test a broader sample collection including chronic pancreatitis and other serum samples, we also acquired chronic pancreatitis serum from the University of Pittsburgh and normal and cancer serum from the University of Michigan. Samples were obtained during routine diagnostic procedures following written patient consent. IRB approval was also obtained from the three participating institutions. For the current study, 71 serum and 78 plasma samples were available from patients with pancreatic adenocarcinoma or chronic pancreatitis and healthy controls (for details, see Table 1).
Table 1.
Overview and origin of available samples for the current study.
| Diagnosis | Sample Type | Institution | No. of samples |
|---|---|---|---|
| normal control | plasma | TexGen | 37 |
| pancreatic cancer | plasma | TexGen | 41 |
| normal control | serum | University of Michigan | 11 |
| chronic pancreatitis | serum | University of Pittsburgh | 30 |
| pancreatic cancer | serum | University of Michigan | 30 |
| TOTAL | 149 |
2.2 Reagents and cell lines
Anti-CA19-9, albumin, and IgM antibodies were purchased from Fitzgerald Industries International (Concord, MA). Cell lines used as controls were human pancreatic cancer cell lines BxPC3, MPanc96, MIA PaCa-2, and PANC-1. Also used was the nontransformed cell line HPDE (human pancreatic duct epithelium) and the primary cancer cell line MOH. BxPC3, MIA PaCa-2 and PANC-1 were purchased from the American Type Culture Collection (Manassas, VA); HPDE was kindly provided by Dr. Ming-Sound Tsao (University of Toronto, Ontario, Canada) [19]. MPanc96 was provided by Dr. Timothy J. Eberlein (St. Louis, MO) [20] and MOH was provided by Dr. Mohammed Hussain (Wayne State University, Detroit, MI). Cells were grown in serum-free medium for 24 hours (RPMI for BxPC3 and MOH; DMEM for MIA PaCa-2, PANC-1 and MPanc96; Keratinocyte medium for HPDE). All media contained 1% antibiotics and antimycotic.
2.3 RPPA Sample Preparation
Cells lines at log phase growth were rinsed twice with ice cold PBS without divalent cations, and were lysed upon addition and incubation for 20 minutes of ice cold lysis buffer (1% Triton X-100, 50 mM HEPES [pH 7.4], 150 mM NaCl, 1.5 mM MgCl2, 1 mM EGTA, 100 mM NaF, 10 mM NaPPi, 10% glycerol, supplemented with Complete Protease Inhibitor tablets (Boehringer/Roche, Mannheim, Germany) and 1 mM Na3 VO4) with occasional rocking. Cells were scraped; lysates were centrifuged for 10 minutes at 4°C at 13,000 rpm in a microcentrifuge. The supernatant was collected; protein concentration was determined by BCA (Pierce Biotechnology, Rockford, IL). All samples were denatured by adding 1 part 4× SDS sample buffer (35% Glycerol, 8% SDS, 250 mM Tris [pH 6.8], 10% 2-mercaptoehtanol) to 3 parts lysate and boiling for 5 minutes. Protein concentration of cell line samples were adjusted to 1 mg/ml prior to serial dilutions for RPPA using dilution buffer (3 parts lysis buffer:1 part 4× SDS buffer).
Serum and plasma samples were also denatured as described above. Prior to serial dilutions, samples were initially diluted 1:10 using dilution buffer. This initial concentration was determined from previous studies as the optimal starting concentration (data not shown). Processed samples were serially diluted 2-fold (final volume 10 µl) with dilution buffer in 96-well plates. Equal volumes of 80% glycerol + 2× PBS buffer were added to each well and transferred into 384-well master plates for printing. Samples were sealed and stored at −80°C until use. One hundred ninety-two samples comprising 37 normal plasma, 41 cancer plasma, 11 normal serum, 30 chronic pancreatitis serum, and 30 cancer serum samples; 30 duplicates (6 samples from each group); 6 control cell lines, and 7 negative spots (lysis buffer) were processed.
2.4 RPPA Sample Printing
Array set up was a 4×6 grid using a 200 µm solid pin 48-pin head in a GeneTAC G3 arrayer (Genomic Solutions, Ann Arbor. MI), with each sample represented as a series of 6 dilutions in one row within the grid. The samples were printed 4 touches/spot with spots 700 µm apart on nitrocellulose-coated FAST slides (Whatman, Florham Park NJ). Slides were stored at −20°C in desiccant until use.
2.5 RPPA Slide Staining
Protein detection was accomplished by tyramide-based signal amplification and a colorimetric substrate (Catalyzed Signal Amplification System [CSA]) (Dako, Carpinteria, CA) using a procedure similar to that of Paweletz et al. [21]. Staining was performed on the i6000 autostainer from BioGenex (San Ramon, CA). Specifically, slides were precleared with Re-Blot Plus Mild Antibody Stripping Solution (Chemicon International, Temecula, CA) for 5 min, and washed with RPPA TBS-T (300 mM NaCl, 50 mM Tris [pH 7.6], 0.1% Tween-20). Slides were then blocked with 0.2% I-Block (Applied Biosystems, Foster City, CA) in PBS containing 0.1% Tween-20 for 30 minutes. Following a TBS-T rinse, slides were further blocked for peroxidase, avidin, biotin, and proteins (5 min per reagent followed by washes with RPPA TBS-T), then incubated for 20 min with primary antibody. Concentrations used for primary antibodies were as follows: CA19-9 (1:2000), albumin (1:1000) and IgM (1:500). Following washes, a 1:15,000 dilution of the appropriate biotinylated secondary antibody (Vector Laboratories, Burlingame, CA), was added, and incubated for 20 min. Antibodies were diluted in Background Reducing Antibody Diluent (Dako). The slides were washed with RPPA TBS-T, and the three amplification reagents from the Dako CSA kit (Streptavidin-Biotin Complex, Amplification Reagent, Streptavidin-HRP) were added for 15 min each, followed by RPPA TBS-T washes. For signal detection, diaminobenzidine was added to the slide and incubated for 3 min; the reaction was stopped by washing the slide in ddiH2O. The slides were then air-dried for scanning and quantification.
2.6 RPPA Sample Quantification
Slides were scanned on an HP Scanjet 8200 flatbed scanner at 600 dpi in grayscale, and saved as a 16-bit tiff file. Spot intensities, determined as mean net values in which local background intensity was subtracted, were determined by reading tiff images on MicroVigene software (Vigene Tech, North Billerica, MA). Protein levels of samples relative to each other on a given slide were interpolated from the “supercurve” library constructed for RPPA that was written in the statistical language R [14]. A full technical description of this work is given in the referenced paper. Briefly, the supercurve quantification relies on utilizing all spot intensities of all samples on the slide, and is designed on the premise that each antibody has binding properties that are characteristic and unique to itself. An antibody response curve for each slide is fit in an iterative fashion. First, a response curve is estimated for the slide, then concentrations are estimated for each sample, and an improved response curve is fit for the slide based on these sample concentrations; this is continually iterated between estimating the slide response curve and estimating sample concentrations until convergence is obtained. To fit this response curve, the known dilutions within each sample were used and defined constraints were placed on the form of the sample response curve for the slide. For this data, we found a logistic response curve was a good fit for the antibodies used. This fitted logistic response curve is what we call “supercurve”. Furthermore, robust statistical methods were used in fitting the response curve to account for possible outliers within a dilution series. Goodness of fit of supercurve for each slide was determined by (1) calculating a mean R2 of the linear portion of the curve (“trimmed mean R2”) for how well each intensity fit on the overall slide response curve, as well as (2) color scale mapping of residuals R2 for each spot intensity. In addition to visual inspection of slides for e.g., evenness of staining, sufficient levels of signal, and titration of diluted spots, quantification data were included in determination of good quality slides. Quantification criteria for good quality slides included supercurve trimmed mean R2 values of ≥0.5 and a residuals R2 map of at least 50% of spots in the acceptable (green) range.
2.7 CA19-9 ELISA
CA19-9 was analyzed in 44 serum samples, for which we had sufficient amounts, by ELISA (Tosoh, Inc., South San Francisco, CA). This analysis was done in the Department of Laboratory Medicine at The University of Texas M. D. Anderson Cancer Center according to the manufacturer’s protocol.
2.8 Statistics
The nonparametric Mann-Whitney test was used to determine significance of difference in CA19-9 or albumin levels between pancreatic cancer and non-cancer samples. Correlation analysis was performed by Spearman correlation and ranked by CA19-9 levels (lowest to highest). All statistical tests and generation of ROC curves were done with GraphPad Prism Version 4.02 (GraphPad, San Diego, CA).
3 Results
3.1 Determination of CA19-9 levels by RPPA in serum and plasma samples
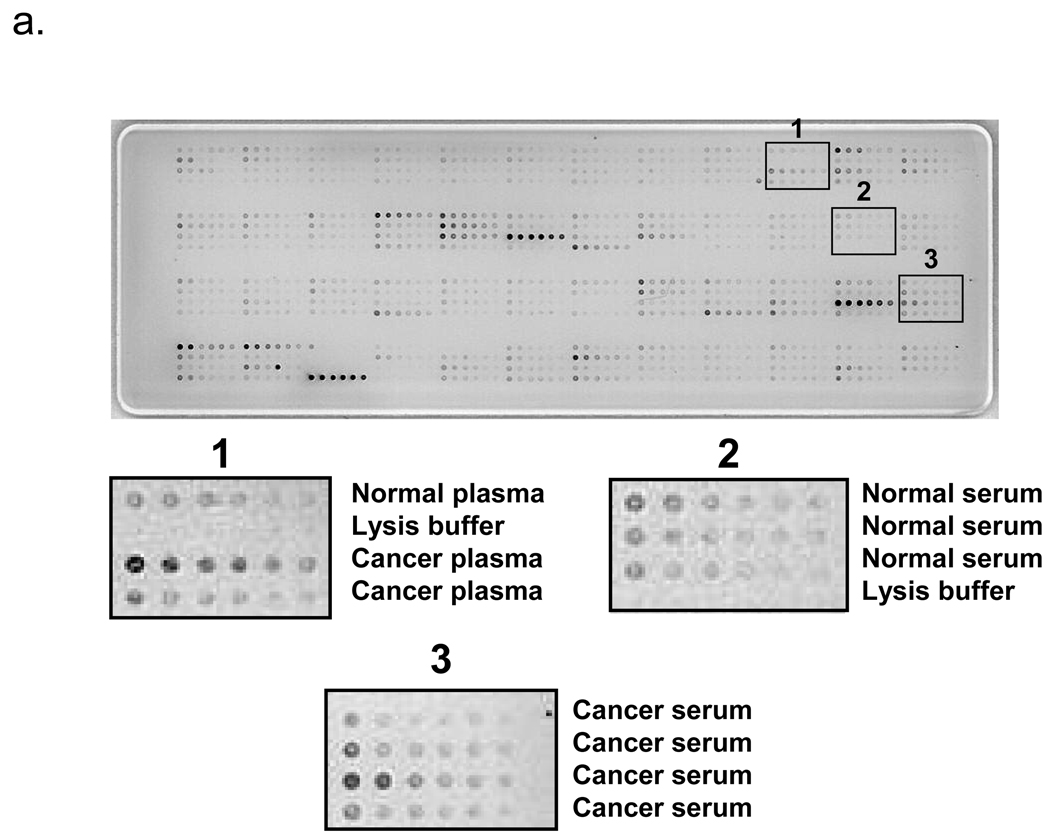
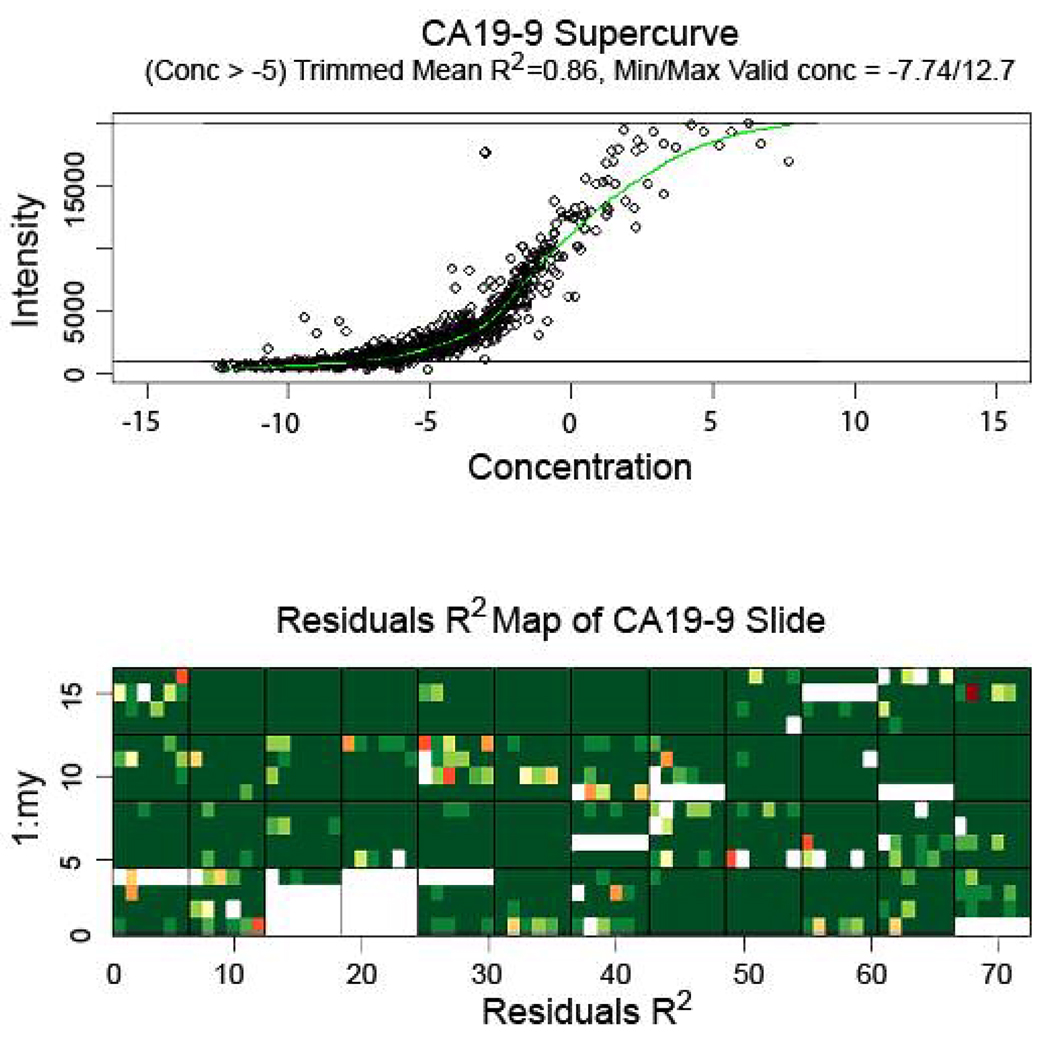
Serum or plasma samples of 71 pancreatic cancer and 30 chronic pancreatitis patients as well as 48 healthy controls were prepared at an initial 1:10 dilution, serially diluted into six 2-fold dilutions, and stained for CA19-9. A representative RPPA slide stained with CA19-9 is shown in Fig. 1a. Analysis of the CA19-9 levels in the slide as determined by the supercurve program showed good curve fit of the samples, with an average trimmed mean R2 value of 0.78 for 5 slides. A representative CA19-9 supercurve analysis and residuals R2 map to demonstrate results of a successfully stained slide is shown in Fig. 2.
Figure 1.
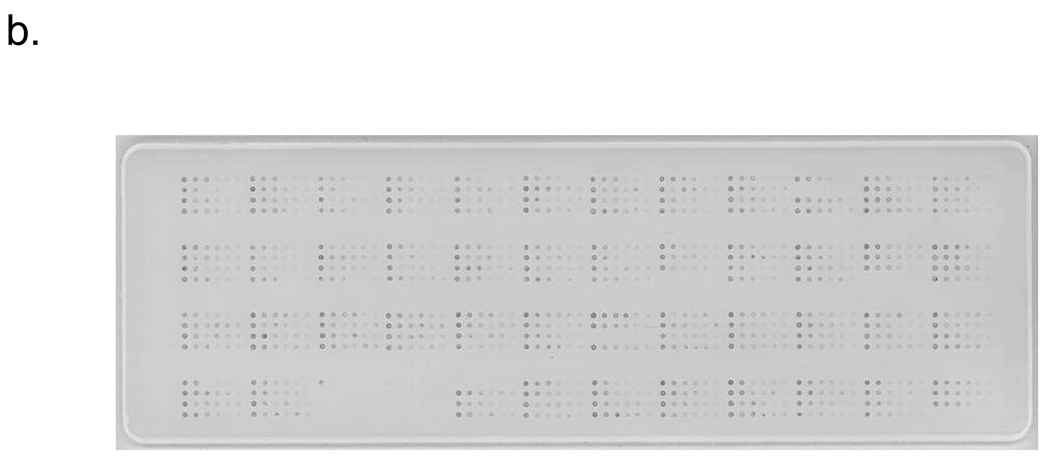
RPPA slides stained with CA19-9 (A) and albumin (B). Serum or plasma samples were initially diluted 1:10 then serially diluted 2-fold for a total of 6 dilutions. The 4×6 grid configuration programmed for arraying placed each sample and its dilutions in rows in each grid. The 192 sample positions on the slide include 149 unique serum and plasma samples, 30 duplicates, and 6 pancreatic cell lines. The remainder contains negative control samples consisting of lysis buffer only. (A) CA19-9 slide demonstrating sample dilution and range of signal levels between samples. Areas 1, 2, and 3 show magnified images of representative samples on corresponding locations on the slide. (B) Albumin slide demonstrating dilution and similar range of signal levels between samples. The albumin slide was printed from the same master plate as the CA19-9 slide; samples for both slides are in identical locations.
Figure 2.
Supercurve graph (top) and residuals R2 map (bottom) of a representative slide stained for CA19-9. (Top) Supercurve graph shows the antibody response curve produced upon utilizing mean net intensities of all spots on the slide. The slide response curve and each sample concentration are initially estimated and an improved response curve is fit for the slide based on these sample concentrations; hence the x-axis (representing concentration) contains no units. The estimations for slide response curve and sample concentrations are continually iterated until there is convergence. Upper and lower lines represent cutoff levels for upper and lower limits of signal (reflected as minimum/maximum valid concentration); trimmed mean R2 represents goodness of spot fit on supercurve at the point beyond the indicated concentration (−5). (Bottom) Residuals R2 map represents goodness of fit of individual spots on respective positions on the slide to supercurve; green represents best fit; yellow, red, and colorless (blank) progressively worse fit. Large blank areas represent portions of the slide containing negative control samples that were excluded from supercurve analysis.
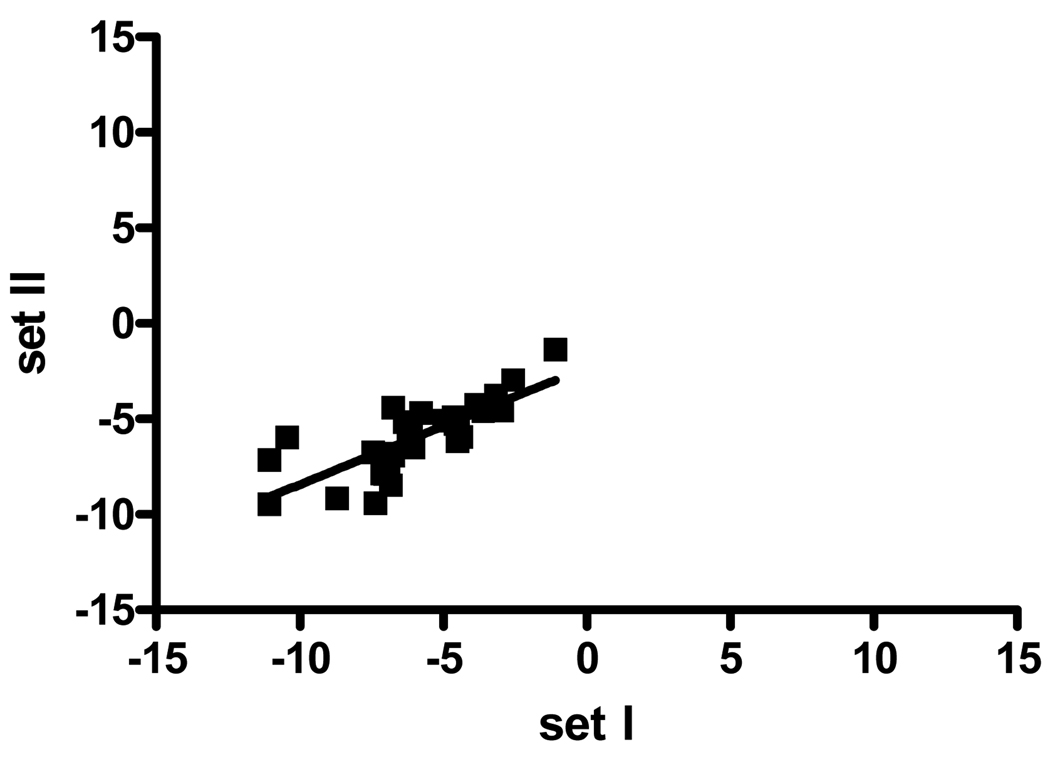
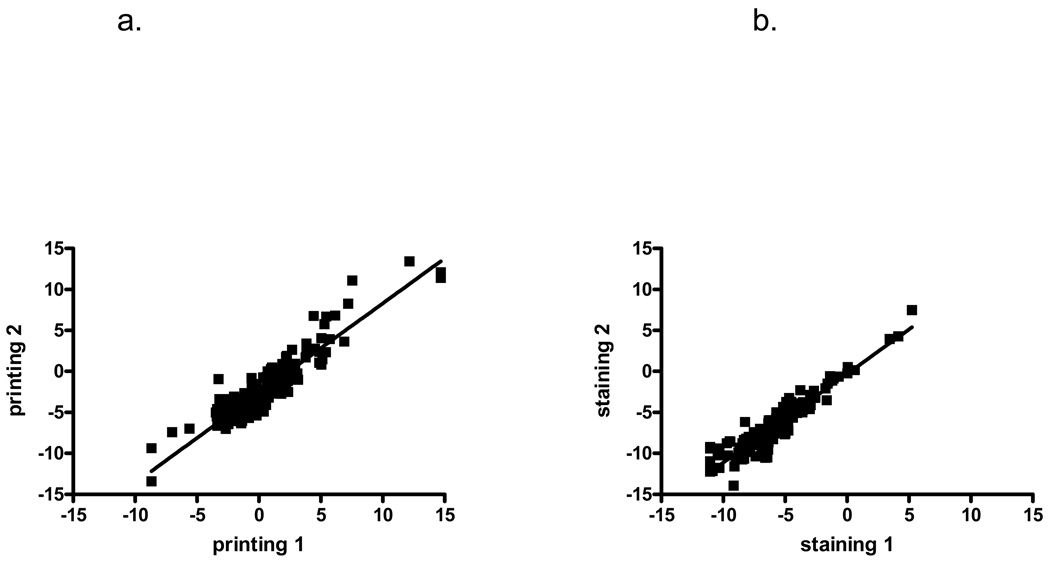
To determine the intraslide variability, we analyzed the 30 duplicates on our array slide by comparing the original and duplicate samples on a scatter plot (Fig. 3). This revealed a correlation of r=0.83 (95% CI 0.66–0.92, p<0.001), indicating the high intraslide reproducibility of the analysis. To test the interslide variability, we compared two slides printed on different days but stained simultaneously (Fig. 4a), as well two slides from the same printing day that were stained separately (Fig. 4b). The interslide correlation was likewise found to be highly significant in both cases for different printing (r=0.88, 95% CI 0.84–0.91, p<0.0001,) and different staining (r=0.93, 95% CI 0.90–0.95, p<0.001). Strikingly, the intraslide, interday, and interslide correlations were not significantly different with overlap of the confidence intervals.
Figure 3.
Comparison of CA19-9 intensities between two different positions on the same RPPA slide. The intraslide reproducibility was analyzed using Spearman correlation and ranking CA19-9 levels from lowest to highest. Thirty sample pairs representing six samples from each group (cancer, pancreatitis, and normal serum and plasma) were printed as duplicates in different areas of the slide and were included in this analysis. The intraslide correlation was r=0.83 (95% CI 0.66–0.92, p<0.001), indicating high reproducibility.
Figure 4.
Comparison of CA19-9 intensities between different RPPA slides. (A) The interslide reproducibility due to the printing process was determined by comparing CA19-9 levels for samples from two slides printed on different days, and using Spearman correlation and ranking CA19-9 levels from lowest to highest. A significant interslide correlation between samples was observed with r=0.88, p<0.0001, 95% CI 0.84–0.91. (B) The interslide reproducibility due to the staining process was determined by comparing two slides printed together but stained on different days, and using Spearman correlation. A significant interslide correlation between samples was observed for different staining days with r=0.93, p<0.001, 95% CI 0.90–0.95.
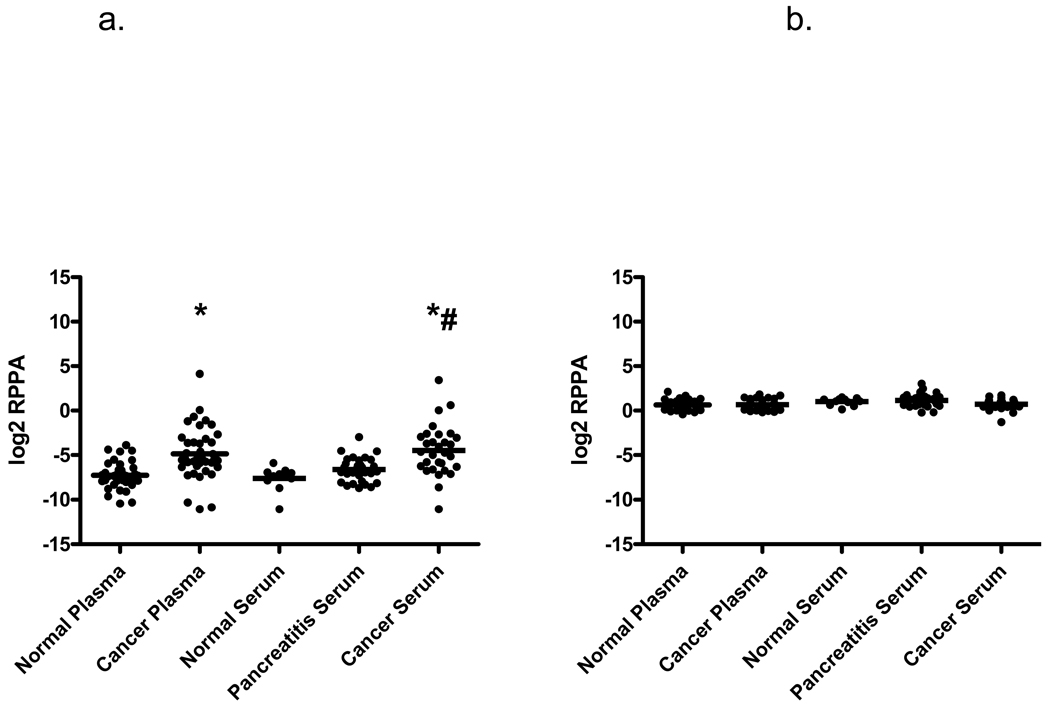
To further validate the RPPA approach, RPPA samples were separated according to source type (plasma or serum), as well as diagnosis. Mean CA19-9 levels increased progressively from normal to pancreatitis to pancreatic cancer in serum samples (Fig. 5a); pancreatic cancer CA19-9 levels in serum and plasma samples were significantly greater when compared to normal serum or plasma. CA19-9 levels were also significantly greater between cancer and pancreatitis serum samples.
Figure 5.
CA19-9 and albumin levels determined from RPPA samples by supercurve and represented as log2 mean net intensities and compared between pancreatic cancer, pancreatitis, and normal serum and plasma samples. (A) Individual and mean CA19-9 intensities in blood samples. Mean CA19-9 values show significant differences between cancer and normal (*), as well as cancer and pancreatitis samples (#) as analyzed by Mann-Whitney two-tailed test, p<0.0001. (B) Individual and mean albumin levels of blood sample groups. No significant difference in albumin levels was detected between sample groups as analyzed by the Mann-Whitney two-tailed test.
3.2 Loading adjustments for RPPA samples
To address potential differences between samples due to loading differences in the RPPA samples, slides were stained with various antibodies for identification of one or more candidate loading control proteins. Proteins stained included IgM and albumin. The IgM supercurve yielded less than optimal curve fitting (trimmed mean R2<0.5; not shown), which was indicative of poor staining results, and was not used for analysis. On the other hand, slides stained with albumin showed good titration (Fig. 1b) and yielded good supercurve fitting (average trimmed mean R2 of 4 slides = 0.81). No significant differences in albumin levels were observed between each sample type (Fig. 5b). Based on these criteria (in addition to our standard criteria for determining good slides), albumin was deemed an acceptable protein to use for sample loading adjustments, and was used in subsequent quantification analyses of CA19-9 levels in RPPA samples.
3.3 Comparison of CA19-9 levels of pancreatic samples: RPPA vs ELISA
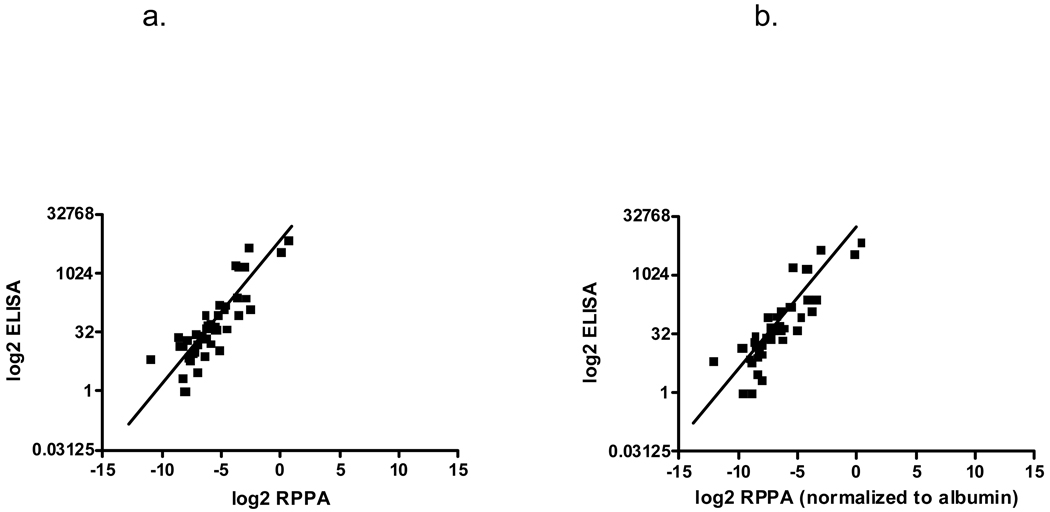
The utility of the RPPA approach was next evaluated by directly comparing RPPA and clinical immunoassay of CA19-9 data. Scatter plots of CA19-9 levels of the same patient samples were compared either directly or after normalization to albumin values. Non-normalized RPPA CA19-9 levels showed high correlation with ELISA values (r=0.87; Fig. 6a) while normalizing RPPA CA19-9 values with albumin slightly increased its correlation with ELISA (r=0.89; Fig. 6b).
Figure 6.
Correlation of CA19-9 levels of samples assayed by both ELISA and RPPA. CA19-9 levels for ELISA were converted to log2 values and matched samples were plotted against RPPA samples. (A) Scatter plot comparing CA19-9 levels from ELISA with non-normalized RPPA values, r=0.87. (B) Scatter plot comparing ELISA with RPPA CA19-9 values after normalizing with albumin for sample loading differences, r=0.89.
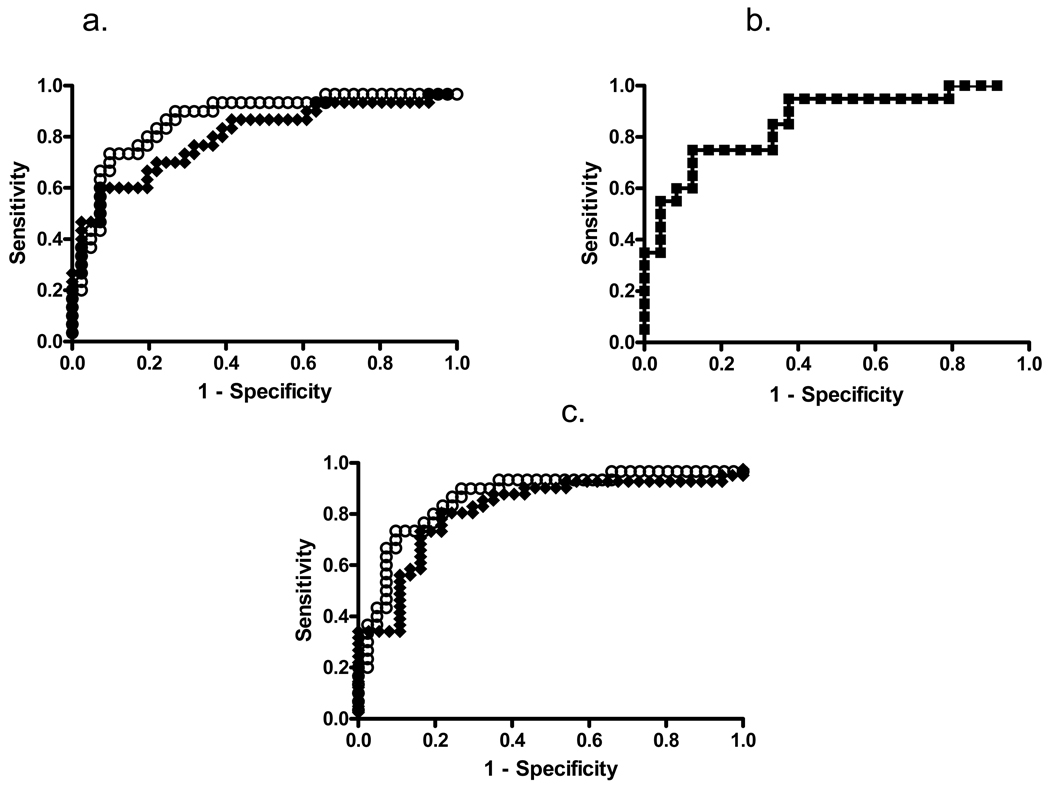
Based on these findings, we also generated ROC curves for the serum samples comparing cancer and non-cancer (chronic pancreatitis and normal) samples. The AUC of CA19-9 for non-normalized RPPA samples was 0.80. Adjusting for loading differences by albumin normalization for RPPA samples yielded improved results with an AUC of 0.87 (Fig. 7a). This AUC was comparable to that of ELISA (0.86, Fig. 7b). When the ROC curve cutoff for RPPA was set at the mean value for CA19-9 levels in the normal serum group (≥ log2(x)=−7.6) and the standard clinical cutoff used for ELISA (37 Units), the specificity for both albumin-normalized RPPA and ELISA was 71%. Notably, the sensitivity of albumin-normalized RPPA was greater than that of ELISA at these CA19-9 cutoff levels (90% vs 75%). For plasma samples, the ROC analysis, upon normalization by albumin (Fig. 7c), gave a similar AUC (0.87) to normalized serum. These data indicate that the RPPA analysis works equally well with serum and plasma samples.
Figure 7.
ROC curves of CA19-9 levels determined from RPPA and ELISA assays. (A) ROC curves for CA19-9 levels determined from RPPA serum samples. Open squares show albumin normalized and closed squares non-normalized CA19-9 data. The AUCs are 0.87±0.05 and 0.80±0.06, respectively; p<0.0001. A cutoff value of ≥ log2(x)=−7.6 results in a sensitivity of 90% and a specificity of 71% for the normalized RPPA data. (B) ROC curve for the CA19-9 ELISA. The AUC is 0.86±0.06, p<0.0001. With a cutoff value of ≥ 37 Units/ml, the sensitivity is 75% and the specificity 71%. (C) ROC curves for the plasma RPPA results. Open squares show albumin normalized and closed squares non-normalized CA19-9 data. The AUCs are 0.87±0.05 and 0.81±0.05 respectively; p<0.0001. A cutoff value of ≥ log2(x)=−7.6 results in a sensitivity of 90% and a specificity of 71% for the normalized RPPA data.
4 Discussion
In this study, we showed that the RPPA technique, combined with interpolation of values from supercurve, could be applied to patient serum and plasma samples to accurately determine CA19-9 levels. Based on ROC analyses, CA19-9 as determined by RPPA was comparable to that of the clinical standard ELISA. Moreover, RPPA samples adjusted for potential loading differences showed greater sensitivity than ELISA upon comparing cancer with non-cancer samples. These results suggest that RPPA can be used successfully as a tool for rapidly validating blood biomarkers.
As RPPA is a relatively recently established technique, many questions regarding validity and standardization need to be addressed. The method itself showed robust and reproducible intra- and interslide reproducibility. The slightly lower intraslide correlation compared to interslide correlation, albeit not statistically different, is most likely due to regional printing and staining variances as well as the initial manual dilutions of the sample. In the future this might be avoided by printing the samples in triplicates and randomly on the slide as well as use of robotics for sample dilutions. Further, we are developing approaches and algorithms to deal with regional staining differences.
The quality of antibody used for protein detection is a major challenge of RPPA analysis. Unlike immunoblots where samples can be separated by relative mobility, RPPA samples are applied as a protein mix in one small area. Therefore, antibody validation is a critical component to successful RPPA assays and analyses. Initial steps in antibody validation involved preferential selection of relatively stable antibodies (e.g., commercial sources, monoclonals) and determination of antibody quality by immunoblot analysis with a single band being required for a good quality antibody. For other antibodies such as CA19-9 that recognize a glycosylation pattern rather than a specific protein, other types of assays (e.g., ELISA) along with comparisons between samples run on the two platforms might be a more feasible means of validation for RPPA. The use of only a single antibody may decrease specificity. Standard ELISAs use two antibodies, which increases the specificity of the assay. Thus, good concordance of samples using a more stringent assay such as ELISA to compare with RPPA appears to be a viable procedure for RPPA antibody validation.
Another question regarding RPPA standardization involves method of detection. We have used the colorimetric substrate DAB as a means of detection in the visible range. Many protein microarray studies use fluorescence detection and recent progress has been made with this technique [22, 23]. However, we tested fluorescence detection for our RPPA technique and found a better signal to noise ratio for the DAB-based amplification procedure compared to fluorescence detection (data not shown).
A third question regarding RPPA standardization involves the methodology of quantification. For curve fitting, we have used methods similar to that of other assays that rely on a logistic curve (e.g., ELISA), with the exception that, instead of a standard curve being established by a set of standards, the entire slide was used to establish the “standard curve”. We feel that quantification of samples by use of supercurve might improve accuracy as use of all spots (excepting outliers) can produce a well-defined logistic curve, and it guarantees that no sample values are extrapolated. This quantification approach could also improve the accuracy of ELISA analysis. However, a standard quantification method for RPPA remains to be established.
Another important question for RPPA analysis is the most accurate means of adjusting for loading differences between samples. For RPPA assays involving cell lysates that have been stained for dozens of antibodies, we have applied a method similar to that of Nishizuka et al. [24] in which results of all antibodies were used to determine a “correction factor” for each sample. For serum and plasma samples, we did not have a validated set of antibodies to work with, and so could not normalize our sample set by our usual method. Additionally, Hamelinck et al. [25] investigated several serum proteins as potential normalization markers for antibody arrays and concluded that finding a “housekeeping” protein for serum studies is most likely unfeasible. In the current study, we examined the usefulness of immunoglobulins and albumin as potential normalization markers. Based on the quality of the RPPA staining results and similar levels between cancer and benign samples, albumin appeared to be a suitable protein for normalization. Adjusting CA19-9 results by albumin produced either similar (e.g., correlation between RPPA and ELISA) or markedly improved (e.g., CA19-9 sensitivity, 90% vs 73%) results when compared to non-normalized samples. The ability to adjust for loading differences is another feature of RPPA that should enable increased accuracy of biomarker validation.
Despite these concerns, we propose that RPPA is an ideal assay for biomarker validation. RPPA is a high-throughput method that requires very little sample (≤5 nl per sample per slide) compared with the typical 50 µl per test required for one standard ELISA. This tremendous savings in precious samples not only means that testing is not limited by the sometimes small amounts of material that are obtained, but also that many more candidate biomarkers can be evaluated with the same samples. This has particularly important benefits in the case of some types of cancer for which sample quantities are very limited or the rarity of the disease limits the broad availability of the material for study. The particular problem with pancreatic cancer is to assemble a comprehensive collection of serum and plasma samples, including the important chronic pancreatitis controls. A further advantage of the RPPA assay is that the levels of several molecules can be tested and compared using an identical set of patient samples, which allows for direct statistical comparisons between candidate biomarkers and facilitates analyses of biomarkers in combination. Further, many slides can be printed at the same time and stored until needed, saving the potential challenges to the sample of repeated freeze thawing or the need to prepare many small aliquots of material.
Another major advantage of RPPA is cost savings. In the study reported here, the cost per sample (excluding labor) was $3.25 for the commercially available ELISA and $0.90 for RPPA. The RPPA cost per sample could be reduced at least 4.6-fold using newer, higher density array machines by which more samples per slide can be printed. In addition, only one commercially available antibody is available for many molecules, precluding development of a sandwich ELISA or Luminex assay. Thus, the RPPA approach makes it possible to analyze a large number of candidate biomarkers for which only a single antibody is available.
Reverse phase arrays that make use of serum samples have previously been described. For example, Janzi et al. [26] used the RPPA technique for the analysis of serum samples and reported a highly reliable detection of IgA levels. However, in that study, samples were arrayed at a single dilution, which does not allow for the use of powerful statistical tools. One of the advantages of our approach is that samples are printed in serial dilutions. This also makes it possible to detect a wide range of levels of potential markers/proteins. Of course, printing serial dilutions uses more space, such that the number of samples per slide has to be reduced. However, with the evolution of new printing methods with more than 6000 spots per slide, this will become less of an issue.
Forward-phase, or antibody arrays have previously been developed for biomarker studies. In antibody arrays, many different capture antibodies are placed on the substrate, and one sample, overlaid on the capture antibodies, is detected either by direct or indirect labeling, such as by detection antibodies. Orchekowski et al. [27] used an antibody microarray to study the serum proteins associated with pancreatic cancer. Their array consisted of 92 antibodies mostly related to inflammatory proteins and they showed that antibodies against CA15-3 and protein-induced vitamin K antagonist-II were able to discriminate between cancer and benign samples. Liew et al. [28] validated a multiplex ELISA, which is similar to an antibody microarray, except that the antibodies are printed in a 96-well format. These forward phase arrays will likely be of great value once a panel of useful biomarkers has been developed, as they allow for the rapid analysis of multiple molecules in a single sample. Regardless, our approach analyzes many samples for a single molecule, which enables a higher throughput that is particularly important when evaluating candidate biomarkers.
Patwa et al. [29] developed a type of RPPA focused on glycoproteins in complex samples, including pancreatic cancer, pancreatitis, and normal control serum samples. This technique required sophisticated sample preparation, including lectin affinity purification and reverse phase chromatography separation, and in some cases, the removal of highly abundant proteins before array printing [30]. While this technique enabled observation of distinct patterns that distinguished between normal, chronic pancreatitis, and pancreatic cancer samples, prepurification of samples has the potential to change sample composition, which would risk loss of some biomarkers, as was evident in our earlier studies with serum and plasma upon albumin depletion (data not shown). In contrast to this technique, our approach only dilutes the samples without potentially changing the sample composition. Furthermore, the RPPA technique used here has a broader applicability in proteomic screening, as it is not restricted to any particular posttranslational modification.
In summary, we have demonstrated that the RPPA technique produces results for serum and plasma samples that are comparable to that of ELISA, and facilitates the screening and validation of candidate biomarkers. The savings in sample volume and cost afforded by this approach should make it possible to achieve the ultimate goal of developing better markers for diagnosis, prognosis, and treatment outcome prediction in cancer.
Acknowledgments
This work was supported by M. D. Anderson Cancer Center Pancreatic Specialized Programs of Research Excellence (SPORE) (P20 CA101936), the Kleberg Center for Molecular Markers, the Lockton Endowment and by the Clinical Proteomic Technology Assessment for Cancer (CPTAC) (U24CA126479 and U24CA126477). The chronic pancreatitis serum samples were collected at the University of Pittsburgh with financial support by the NIH (DK061451). Also, we wish to thank TOSOH Corporation, South San Francisco, CA, for providing the reagents for the CA19-9 ELISA. The help of Susan St. Romain from the Special Chemistry Laboratory at M.D. Anderson with the CA19-9 clinical ELISA is highly appreciated. We would also like to thank Betty L. Notzon for her help with the manuscript.
Abbreviations
- ROC
receiver operating characteristic
- RPPA
reverse phase protein array
Footnotes
The authors declare no financial or commercial conflicts of interest.
References
- 1.Anderson NL, Anderson NG. The human plasma proteome: history, character, and diagnostic prospects. Mol.Cell Proteomics. 2002;1:845–867. doi: 10.1074/mcp.r200007-mcp200. [DOI] [PubMed] [Google Scholar]
- 2.Etzioni R, Urban N, Ramsey S, McIntosh M, et al. The case for early detection. Nat. Rev. Cancer. 2003;3:243–252. doi: 10.1038/nrc1041. [DOI] [PubMed] [Google Scholar]
- 3.Grote T, Logsdon CD. Progress on molecular markers of pancreatic cancer. Curr. Opin. Gastroenterol. 2007;23:508–514. doi: 10.1097/MOG.0b013e3282ba5724. [DOI] [PubMed] [Google Scholar]
- 4.Ward JB, Jr., Henderson RE. Identification of needs in biomarker research. Environ. Health Perspect. 1996;(104 Suppl 5):895–900. doi: 10.1289/ehp.96104s5895. [DOI] [PMC free article] [PubMed] [Google Scholar]
- 5.Jemal A, Siegel R, Ward E, Murray T, et al. Cancer statistics. 2007 CA Cancer J. Clin. 2007;57:43–66. doi: 10.3322/canjclin.57.1.43. [DOI] [PubMed] [Google Scholar]
- 6.Boeck S, Stieber P, Holdenrieder S, Wilkowski R, Heinemann V. Prognostic and therapeutic significance of carbohydrate antigen 19-9 as tumor marker in patients with pancreatic cancer. Oncology. 2006;70:255–264. doi: 10.1159/000094888. [DOI] [PubMed] [Google Scholar]
- 7.Locker GY, Hamilton S, Harris J, Jessup JM, et al. ASCO 2006 update of recommendations for the use of tumor markers in gastrointestinal cancer. J. Clin. Oncol. 2006;24:5313–5327. doi: 10.1200/JCO.2006.08.2644. [DOI] [PubMed] [Google Scholar]
- 8.Iacobuzio-Donahue CA, Ashfaq R, Maitra A, Adsay NV, et al. Highly expressed genes in pancreatic ductal adenocarcinomas: a comprehensive characterization and comparison of the transcription profiles obtained from three major technologies. Cancer Res. 2003;63:8614–8622. [PubMed] [Google Scholar]
- 9.Logsdon CD, Simeone DM, Binkley C, Arumugam T, et al. Molecular profiling of pancreatic adenocarcinoma and chronic pancreatitis identifies multiple genes differentially regulated in pancreatic cancer. Cancer Res. 2003;63:2649–2657. [PubMed] [Google Scholar]
- 10.Missiaglia E, Blaveri E, Terris B, Wang YH, et al. Analysis of gene expression in cancer cell lines identifies candidate markers for pancreatic tumorigenesis and metastasis. Int. J. Cancer. 2004;112:100–112. doi: 10.1002/ijc.20376. [DOI] [PubMed] [Google Scholar]
- 11.Lin Y, Goedegebuure PS, Tan MC, Gross J, et al. Proteins associated with disease and clinical course in pancreas cancer: a proteomic analysis of plasma in surgical patients. J. Proteome. Res. 2006;5:2169–2176. doi: 10.1021/pr0600374. [DOI] [PubMed] [Google Scholar]
- 12.Sun ZL, Zhu Y, Wang FQ, Chen R, et al. Serum proteomic-based analysis of pancreatic carcinoma for the identification of potential cancer biomarkers. Biochim. Biophys. Acta. 2007;1774:764–771. doi: 10.1016/j.bbapap.2007.04.001. [DOI] [PubMed] [Google Scholar]
- 13.Simeone DM, Ji B, Banerjee M, Arumugam T, et al. CEACAM1, a novel serum biomarker for pancreatic cancer. Pancreas. 2007;34:436–443. doi: 10.1097/MPA.0b013e3180333ae3. [DOI] [PubMed] [Google Scholar]
- 14.Hu J, He X, Baggerly KA, Coombes KR, et al. Non-parametric quantification of protein lysate arrays. Bioinformatics. 2007;23:1986–1994. doi: 10.1093/bioinformatics/btm283. [DOI] [PubMed] [Google Scholar]
- 15.Tibes R, Qiu Y, Lu Y, Hennessy B, et al. Reverse phase protein array: validation of a novel proteomic technology and utility for analysis of primary leukemia specimens and hematopoietic stem cells. Mol. Cancer Ther. 2006;5:2512–2521. doi: 10.1158/1535-7163.MCT-06-0334. [DOI] [PubMed] [Google Scholar]
- 16.Grubb RL, Calvert VS, Wulkuhle JD, Paweletz CP, et al. Signal pathway profiling of prostate cancer using reverse phase protein arrays. Proteomics. 2003;3:2142–2146. doi: 10.1002/pmic.200300598. [DOI] [PubMed] [Google Scholar]
- 17.Petricoin EF, III, Espina V, Araujo RP, Midura B, et al. Phosphoprotein pathway mapping: Akt/mammalian target of rapamycin activation is negatively associated with childhood rhabdomyosarcoma survival. Cancer Res. 2007;67:3431–3440. doi: 10.1158/0008-5472.CAN-06-1344. [DOI] [PubMed] [Google Scholar]
- 18.Koopmann J, Zhang Z, White N, Rosenzweig J, et al. Serum diagnosis of pancreatic adenocarcinoma using surface-enhanced laser desorption and ionization mass spectrometry. Clin Cancer Res. 2004;10:860–868. doi: 10.1158/1078-0432.ccr-1167-3. [DOI] [PubMed] [Google Scholar]
- 19.Furukawa T, Duguid WP, Rosenberg L, Viallet J, et al. Long-term culture and immortalization of epithelial cells from normal adult human pancreatic ducts transfected by the E6E7 gene of human papilloma virus 16. Am.J.Pathol. 1996;148:1763–1770. [PMC free article] [PubMed] [Google Scholar]
- 20.Peiper M, Nagoshi M, Patel D, Fletcher JA, et al. Human pancreatic cancer cells (MPanc-96) recognized by autologous tumor-infiltrating lymphocytes after in vitro as well as in vivo tumor expansion. Int.J.Cancer. 1997;71:993–999. doi: 10.1002/(sici)1097-0215(19970611)71:6<993::aid-ijc15>3.0.co;2-7. [DOI] [PubMed] [Google Scholar]
- 21.Paweletz CP, Charboneau L, Bichsel VE, Simone NL, et al. Reverse phase protein microarrays which capture disease progression show activation of pro-survival pathways at the cancer invasion front. Oncogene. 2001;20:1981–1989. doi: 10.1038/sj.onc.1204265. [DOI] [PubMed] [Google Scholar]
- 22.Geho D, Lahar N, Gurnani P, Huebschman M, et al. Pegylated, steptavidin-conjugated quantum dots are effective detection elements for reverse-phase protein microarrays. Bioconjugate chemistry. 2005;16:559–566. doi: 10.1021/bc0497113. [DOI] [PubMed] [Google Scholar]
- 23.Shingyoji MGD, Pinkel D, Gray JW, Chen F. Quantum dots-based reverse phase protein microarray. Talanta. 2005;67:472–478. doi: 10.1016/j.talanta.2005.06.064. [DOI] [PubMed] [Google Scholar]
- 24.Nishizuka S, Charboneau L, Young L, Major S, et al. Proteomic profiling of the NCI-60 cancer cell lines using new high-density reverse-phase lysate microarrays. Proceedings of the National Academy of Sciences of the United States of America. 2003;100:14229–14234. doi: 10.1073/pnas.2331323100. [DOI] [PMC free article] [PubMed] [Google Scholar]
- 25.Hamelinck D, Zhou H, Li L, Verweij C, et al. Optimized normalization for antibody microarrays and application to serum-protein profiling. Mol Cell Proteomics. 2005;4:773–784. doi: 10.1074/mcp.M400180-MCP200. [DOI] [PubMed] [Google Scholar]
- 26.Janzi M, Odling J, Pan-Hammarstrom Q, Sundberg M, et al. Serum microarrays for large scale screening of protein levels. Mol.Cell Proteomics. 2005;4:1942–1947. doi: 10.1074/mcp.M500213-MCP200. [DOI] [PubMed] [Google Scholar]
- 27.Orchekowski R, Hamelinck D, Li L, Gliwa E, et al. Antibody microarray profiling reveals individual and combined serum proteins associated with pancreatic cancer. Cancer Res. 2005;65:11193–11202. doi: 10.1158/0008-5472.CAN-05-1436. [DOI] [PubMed] [Google Scholar]
- 28.Liew M, Groll MC, Thompson JE, Call SL, et al. Validating a custom multiplex ELISA against individual commercial immunoassays using clinical samples. Biotechniques. 2007;42:327–323. doi: 10.2144/000112332. [DOI] [PubMed] [Google Scholar]
- 29.Patwa TH, Zhao J, Anderson MA, Simeone DM, Lubman DM. Screening of glycosylation patterns in serum using natural glycoprotein microarrays and multi-lectin fluorescence detection. Anal. Chem. 2006;78:6411–6421. doi: 10.1021/ac060726z. [DOI] [PubMed] [Google Scholar]
- 30.Zhao J, Patwa TH, Qiu W, Shedden K, et al. Glycoprotein Microarrays with Multi-Lectin Detection: Unique Lectin Binding Patterns as a Tool for Classifying Normal, Chronic Pancreatitis and Pancreatic Cancer Sera. J. Proteome Res. 2007;6:1864–1874. doi: 10.1021/pr070062p. [DOI] [PubMed] [Google Scholar]


