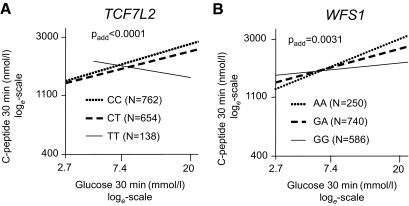
FIG. 2.
Association between C-peptide levels at 30 min of the OGTT and glucose levels at 30 min during the OGTT by TCF7L2 SNP rs7903146 (A) and WFS1 SNP rs10010131 (B). Lines represent regression lines. Data were loge-transformed prior to statistical analysis. C-peptide data are adjusted for sex, age, and BMI by multivariate linear regression analysis.

