Abstract
The analysis of autophagy in cells and tissue has principally been performed via qualitative measures. These assays identify autophagosomes or measure the conversion of LC3I to LC3II. However, qualitative assays fail to quantitate the degradation of an autophagic substrate and therefore only indirectly measure an intact autophagic system. “Autophagic flux” can be measured using long-lived proteins that are degraded via autophagy. We developed a quantifiable luciferase reporter assay that measures the degradation of a long-lived polyglutamine protein aggregate, polyQ80-luciferase. Using this reporter, the induction of autophagy via starvation or rapamycin in cells preferentially decreases polyQ80-luciferase when compared with a non-aggregating polyQ19-luciferase after four hours of treatment. This response was both time- and concentration-dependent, prevented by autophagy inhibitors and absent in ATG5 knockout cells. We adapted this assay to living animals by electroporating polyQ19-luciferase and polyQ80-luciferase expression constructs into the right and left tibialis anterior (TA) muscles of mice, respectively. The change in the ratio of polyQ80-luciferase to polyQ19-luciferase signal before and after autophagic stimulation or inhibition was quantified via in vivo bioluminescent imaging. Following two days of starvation or treatment with intraperitoneal rapamycin, there was a ~35% reduction in the ratio of polyQ80:polyQ19-luciferase activity, consistent with the selective autophagic degradation of polyQ80 protein. This autophagic response in skeletal muscle in vivo was abrogated by co-treatment with chloroquine and in ATG16L1 hypomorphic mice. Our study demonstrates a method to quantify the autophagic flux of an expanded polyglutamine via luciferase reporters in vitro and in vivo.
Introduction
Macroautophagy, herein referred to as autophagy, is a means by which cells degrade long-lived proteins and organelles (1). Many inherited as well as sporadic diseases such as Alzheimer’s disease, Parkinson’s disease and skeletal myopathies may be due to impaired autophagy (2). Cells sequester regions of cytoplasm within a double membrane bound structure defined as an autophagosome. Autophagosomes fuse with lysosomes allowing the proteolytic digestion of their contents. Several methods to quantitate the induction of autophagy in cells and tissue have been developed and extensively reviewed (3). The identification of autophagosomes via electron microscopy or using autophagosomal markers such as microtubule-associated protein 1 light chain 3 (LC3) allow the monitoring of autophagosome formation. Other means include quantifying the upregulation of autophagic proteins or the conjugation of ATG12 to ATG5, a critical step in the autophagic cascade, via immunoblot. However, none of these methods evaluate “flux” through the autophagic system (3).
To get around this, dual fluorescent reporter constructs containing a pH-sensitive and insensitive fluorescent tag have been used to evaluate the fusion of autophagosomes with lysosomes in living cells and more recently on serially-examined fixed tissue (4). These methods rely on qualitative identification of fluorescent punta and are at best semi-quantitative. Other means of evaluating “autophagic flux” identify the degradation of substrates that are degraded primarily via autophagy in the presence of autophagy inducers and inhibitors. For example the degradation of LC3II or p62/sequestosome are proposed to be reliable markers of autophagic flux (3). Similarly, the release of radiolabeled amino acids from cultured cells measures global autophagic flux of long-lived protein substrates. Finally, the degradation of protein aggregates such as expanded polyglutamine containing proteins or disease-associated mutations in α-synuclein are reported to be preferentially degraded via autophagy (3). While these assays measure autophagic flux and are more quantitative than the microscopic identification of autophagosomes, they can only be performed on tissue culture cells or tissue homogenates. In addition, they are not readily amenable to high throughput assays.
The identification of autophagy and quantitating “autophagic flux” in live mammalian tissue is problematic. Immunostaining of animal tissue with antibodies to autophagy markers or the use of GFP-LC3 transgenic mice can reveal an accumulation of autophagosomes in the setting of impaired autophagy, although, a similar pattern can be seen with upregulated yet intact autophagy (3). Similarly, the accumulation of processed LC3II on immunoblot does not discriminate between an increase in LC3 production or a decrease in autophagic degradation (5). These limitations make it difficult to interpret “autophagic flux” in living animal tissue.
To circumvent these limitations in mammalian tissue, we developed autophagy-selective luciferase reporters that are visualized using in vivo bioluminescence imaging of living mouse skeletal muscle. By comparing the steady-state changes of two luciferase reporters, polyQ80-luciferase and control polyQ19-luciferase, each electroporated into separate muscles of mice, we can quantitate “autophagic flux” in a live animal following autophagic stimuli. Our reporter system can be used in vitro and in vivo to quantitate the induction and inhibition of “autophagic flux”. These reporters provide a dynamic and specific tool for the analysis of autophagy in health and disease.
Results
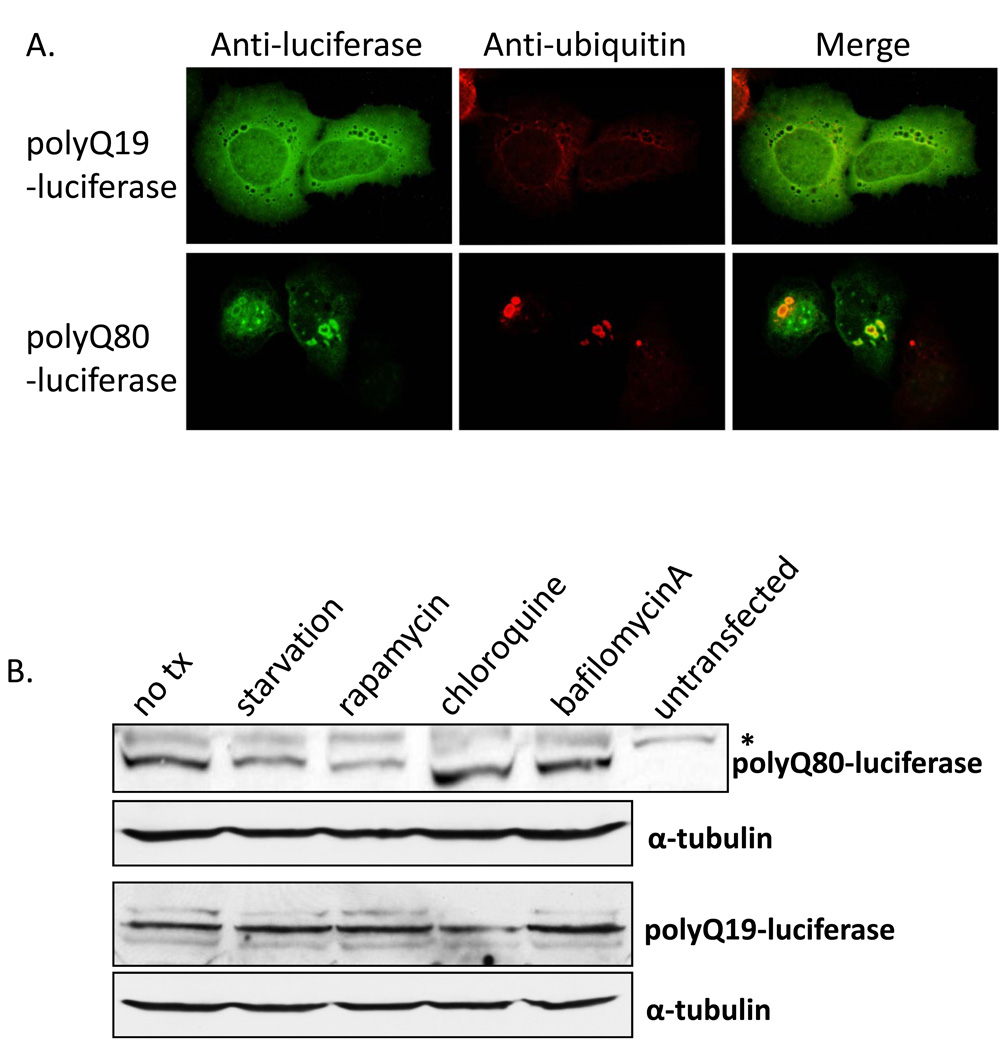
We engineered luciferase reporter constructs that comprised firefly luciferase fused to an N-terminal polyglutamine with either 19 (polyQ19-luciferase) or 80 (polyQ80-luciferase) repeats. Following transfection of U20S cells with polyQ19-luciferase, immunofluorescence with a luciferase antibody demonstrated expression with a diffuse cellular localization pattern throughout the cell (Figure 1A, top panel). In contrast, polyQ80-luciferase was localized to small perinuclear inclusions that strongly co-localized with an antibody to ubiquitinated proteins (Figure 1A, bottom panel). These data suggested that polyQ80-luciferase aggregated in cells similar to other previously reported polyQ80 constructs (6). To confirm that polyQ80-luciferase was degraded in an autophagy dependent manner, we performed Western blot analysis with an anti-luciferase antibody of lysates from polyQ80-luciferase and polyQ19-luciferase expressing U20S before and after 6 hours of nutrient deprivation (starvation) or the addition of 20 µg/mL rapamycin, 50 µg/mL hydroxychloroquine, or 100 ng/mL bafilomycinA (Figure 1B). Similar to that previously reported with other expanded polyglutamine-containing expression constructs, starvation and rapamycin selectively decreased polyQ80-luciferase protein levels (7, 8). Chloroquine and bafilomycinA showed a modest increase in polyQ80-luciferase levels after 6 hours.
Figure 1.
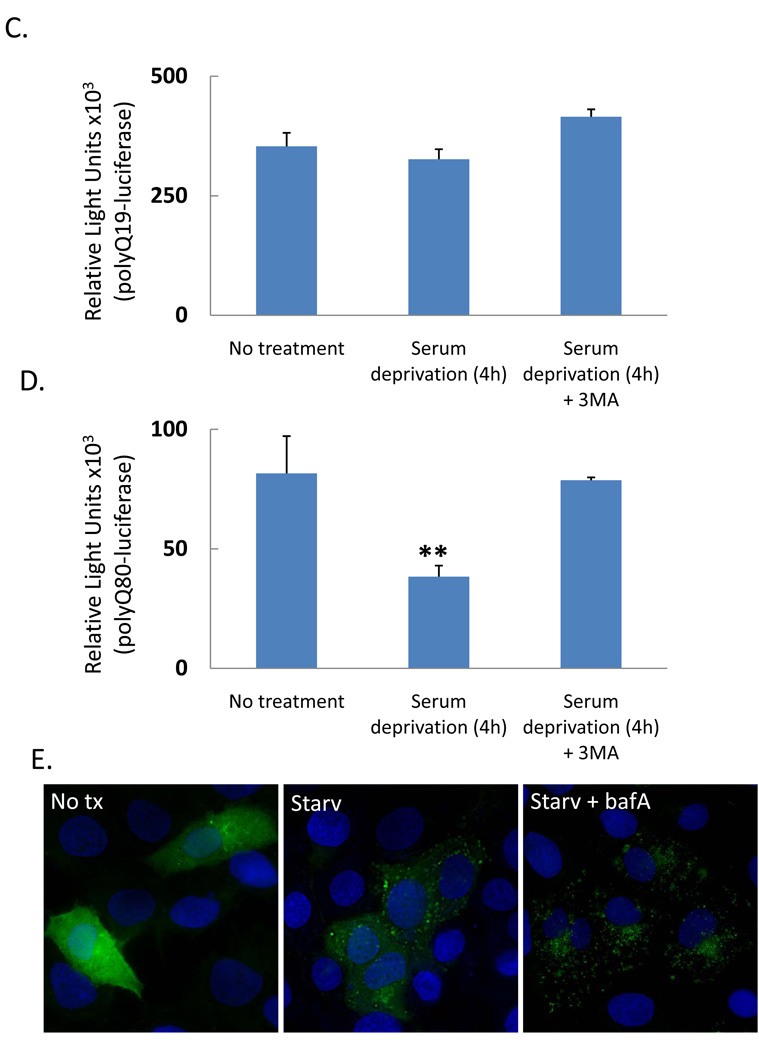
A) U20S cells transiently transfected with polyQ19-luciferase (top panel) or polyQ80-luciferase (bottom panel) and immunostained with anti-luciferase (green) or anti-ubiquitin (red) antibodies. Note that polyQ80-luciferase forms small perinuclear ubiquitin positive inclusions while polyQ19-luciferase is diffuse throughout the cell. B) Immunoblot using anti-luciferase or anti-tubulin (loading control) of U20S lysates transfected with polyQ80-luciferase (top) and polyQ19-luciferase (bottom) following 6 treatment with nutrient deprivation (starvation) or rapamycin, chloroquine or bafilomycinA. Note that polyQ80-luciferase decrease in the starvation and rapamycin treated cell lysates. * is a non-specific band seen in non-transfected cells. C–D) Luciferase activity in U20S cells transfected with (C) polyQ19-luciferase or (D) polyQ80-luciferase and treated with nutrient deprivation for 4 hours or nutrient deprivation plus 20uM autophagy inhibitor 3-methyladenine (3MA). Only polyQ80-luciferase activity decreases with the induction of autophagy. ** denotes a p value of <.001. E) Representative epifluorescent image of U20S transfected with GFP-LC3 expression plasmid following no treatment, nutrient deprivation (starv) or nutrient deprivation plus bafilomycinA (starv +bafA) for 4 hours. Note the increase in GFP-LC3 positive puncta in nutrient deprived and nutrient deprived with bafilomycinA treated cells.
We transfected U20S cells with either polyQ19-luciferase (Figure 1C) or polyQ80-luciferase (Figure 1D) and induced autophagy via nutrient deprivation for 4 hours with and without the co-application of 20 µM of the autophagy inhibitor 3-methyladenine (3MA). Only the nutrient-deprived polyQ80-luciferase transduced cells had a significant reduction in luciferase activity (by ~50%) consistent with polypeptide degradation. This decrease was abolished by co-treatment with 20 µM 3MA. The decrease was not due to a decrease in cell number since identical experiments performed following co-transfection with Renilla luciferase showed no change in Renilla activity (data not shown). To demonstrate that we are in fact inducing autophagy in our experimental system, GFP autofluorescence is shown from U20S cells transfected with a GFP-LC3 expression construct (9) following no nutrient deprivation, nutrient deprivation or nutrient deprivation plus bafilomycinA for 4 hours (Figure 1E). Under basal conditions, GFP-LC3 is present throughout the cell with occasional puncta. However under conditions of nutrient deprivation, GFP-LC3 redistributes to multiple puncta consistent with autophagosome formation. These puncta are even more numerous when autophagosome fusion with lysosomes is inhibited with bafilomycinA (Figure 1E). This experiment also highlights a key difficulty with interpreting LC3 puncta formation since puncta are present in cells capable of autophagy and cells treated with an autophagy inhibitor.
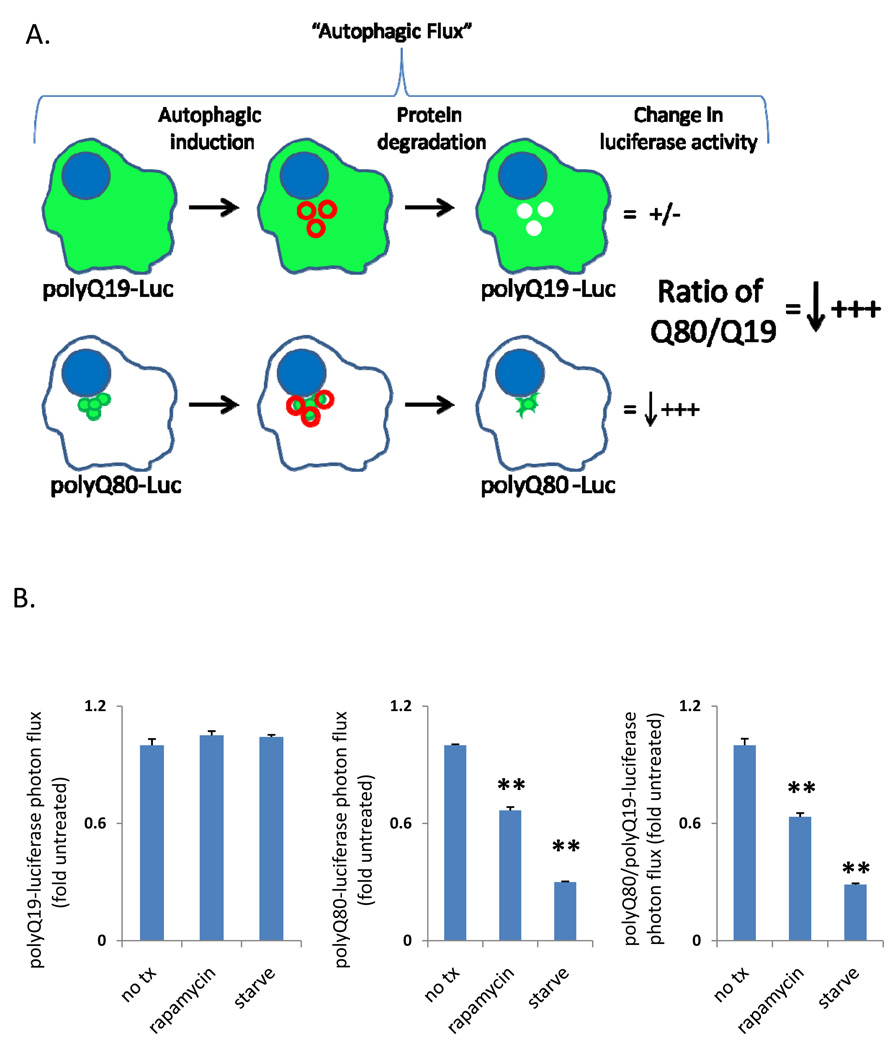
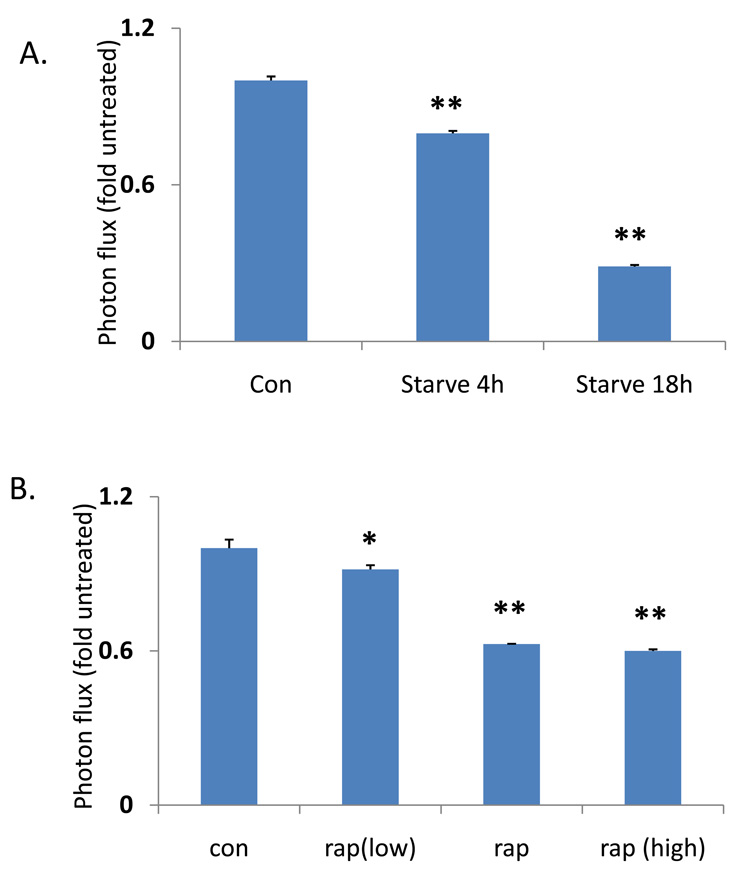
To develop a simple quantifiable assay to measure changes in the “autophagic flux” of polyQ80, we devised a strategy that would analyze the ratiometric change in polyQ80-luciferase/polyQ19-luciferase (Figure 2A). By comparing the ratio of polyQ80/polyQ19, we control for variations in expression that may occur over time (see in vivo studies) or treatments that affect the stability or expression of both polyQ19 and polyQ80 (see Figure 3D using proteasome inhibition). Table 1 and Figure 2B show luciferase activity from differentiated C2C12 myotubes that were transfected with either polyQ19-luciferase or polyQ80-luciferase and treated with nutrient deprivation or rapamycin (10 µg/mL) for 18 hours. PolyQ80-luciferase and the ratio of polyQ80/polyQ19 from cells treated with nutrient deprivation or rapamycin decreased by 70% and 37%, respectively, consistent with a selective degradation of polyQ80-luciferase during autophagy. These changes were both time-and concentration-dependent as shown in Figure 3A in which cells were starved for 4 and 18 hours or in Figure 3B in which cells were treated with 2 µg/ml, 10 µg/ml or 50 µg/ml of rapamycin for 18 hours.
Figure 2.
A) Schematic representation of “autophagic flux” assay using the ratio of polyQ80-luciferase to polyQ19-luciferase activity. B) Raw data from differentiated C2C12 myotubes transfected with polyQ19 or polyQ80-luciferase constructs and treated with autophagy inducers rapamycin or nutrient deprivation for 18 hours. C) graphical representation of the data in B.
Figure 3.
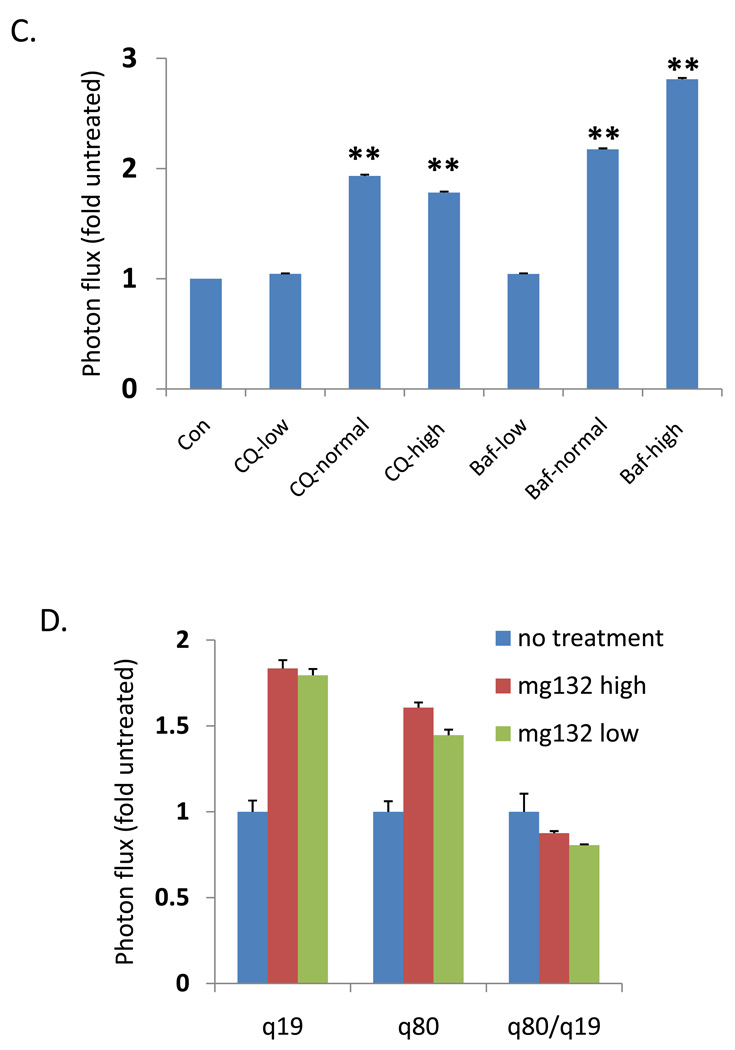
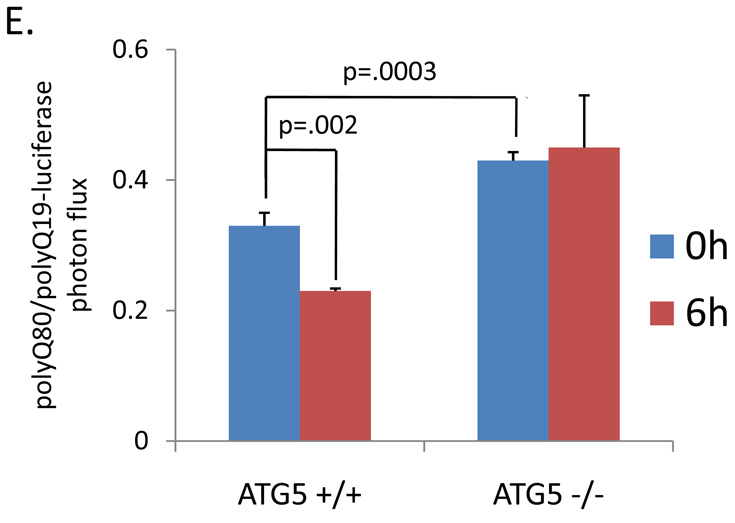
The ratio of polyQ80/polyQ19-luciferase activity in differentiated C2C12 myotubes transfected following (A) starvation for 4 or 18 hours (B) increasing concentrations of rapamycin for 18 hours or (C) increasing concentrations of autophagy inhibitors chloroquine (CQ) or bafilomycinA (Baf). * denotes a p value of <.01. ** denotes a p value of <.001. (D) U20S cells treated with proteasome inhibitor MG132 have a similar increase in both Q19 and Q80-luciferase activity after 4 hours of treatment. E) ATG5+/+ or ATG5−/− mouse embryonic fibroblasts (MEFs) were transfected with polyQ80 or polyQ19-luciferase and subjected to nutrient deprivation for 0 or 6 hours. The raw ratio of polyQ80/polyQ19-luciferase activity is presented. Note that the amount ratio of polyQ80/polyQ19-luciferase is elevated in ATG5−/− cells at time 0. In addition, whereas the ratio decreases in ATG5+/+ MEFs following nutrient deprivation, this does not occur in ATG5−/− MEFs suggesting impaired autophagic degradation.
Table 1.
| Q19-luciferase activity (RLU×10e3) |
Q80-luciferase activity (RLU×10e3) |
Ratio of Q80/Q19 activity | |||||||
|---|---|---|---|---|---|---|---|---|---|
| No treatment |
Rapamycin (18h) |
Nutrient deprivation (18h) |
No treatment |
Rapamycin (18h) |
Nutrient deprivation (18h) |
No treatment |
Rapamycin (18h) |
Nutrient deprivation (18h) |
|
| average | 5.99 | 6.29 | 6.25 | 9.03 | 6.02 | 2.71 | 1.51 | 0.96 | 0.43 |
| std dev | 0.19 | 0.13 | 0.06 | 0.05 | 0.16 | 0.04 | 0.05 | 0.03 | 0.01 |
| p value | 0.25 | 0.22 | 4.63E-09 | 9.05E-08 | 2.63E-06 | 3.04E-05 | |||
|
Fold untreated |
1 | 1.05 | 1.04 | 1 | 0.67 | 0.30 | 1 | 0.63 | 0.29 |
To determine if this assay was capable of quantitating autophagic inhibition, we transfected differentiated C2C12 myotubes with polyQ19-luciferase or polyQ80-luciferase and subsequently treated cells with escalating concentrations of the autophagic inhibitors chloroquine and bafilomycinA (Figure 3C). As expected, the ratio of polyQ80/polyQ19 increased in both chloroquine and bafilomycinA treated cells in a concentration-dependent manner. This was in contrast to treatment with the proteasome inhibitor, MG132, which increased the levels of both polyQ19-luciferase and polyQ80-luciferase to similar extents resulting in only a modest change in the ratio of polyQ80/polyQ19 luciferase (Figure 3D). Whether a similar phenomenon (i.e. a comparable decrease in luciferase activity between polyQ80-luciferase and polyQ19-luciferase) occurs upon proteasome activation is not known.
We performed the same assay using ATG5+/+ and ATG5−/− mouse embryonic fibroblasts (MEFs) (10). ATG5−/− MEFs lack ATG5 protein, are deficient in autophagy, and do not form autophagosomes upon nutrient deprivation (10). When subjected to nutrient deprivation for 6 hours, ATG5+/+ MEFs had a 30% decrease in the ratio polyQ80/polyQ19-luciferase activity consistent with a selective degradation in polyQ80-luciferase (Figure 3E). This decrease was abolished in ATG5−/− MEFs (Figure 3E). In addition, the ratio of polyQ80/polyQ19-luciferase expression at basal was significantly elevated in ATG5−/− MEFs (Figure 3E). This may suggest that our assay is able to detect alterations in basal autophagy as well as induced autophagy.
These studies suggest that polyQ80-luciferase is selectively degraded via autophagic stimuli and that the change in the ratio of polyQ80/polyQ19 from its baseline is a measure of “autophagic flux.” We adapted this assay to living mouse skeletal muscle by using in vivo bioluminescent imaging. The right and left tibialis anterior (TA) from age and sex-matched C57/B6 mice were electroporated separately with 40 µg of polyQ80-luciferase or polyQ19-luciferase expression constructs. Baseline luciferase activity and a subsequent polyQ80/polyQ19 ratio for each animal was determined 2 days post-electroporation (Figure 4A). This ratio was arbitrarily set to 1.0 at time point 0. Select animals were treated with food deprivation alone, food deprivation with co-administration of chloroquine (10 mg/kg), or rapamycin (5 mg/kg) for one or two days. In our initial studies over two days of normal diet, untreated control animals had a mean decrease in the ratio of polyQ80/polyQ19 of 0.88±0.13 (p=0.9; n=10 animals) as compared to 1.0 at time point 0. This suggests that the baseline ratio of polyQ80/polyQ19 does not change significantly over the course of two days.
Figure 4.
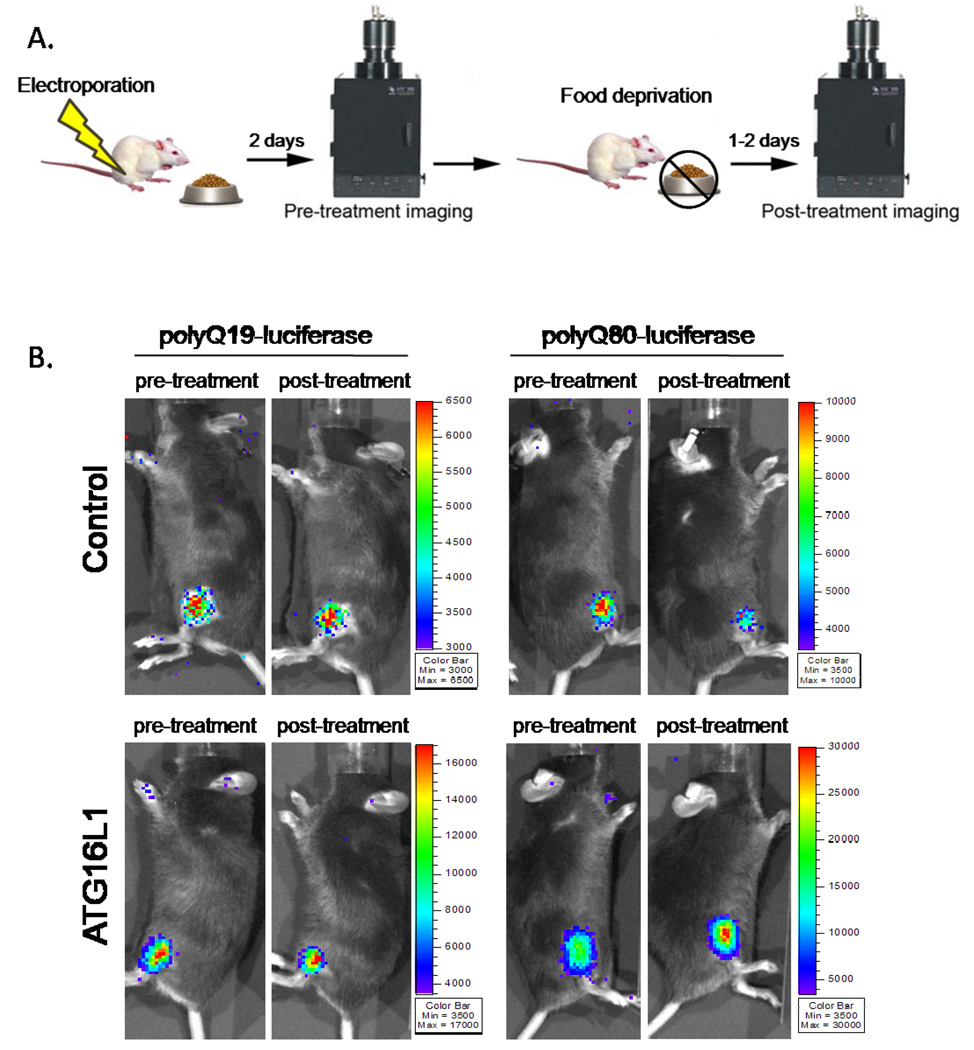
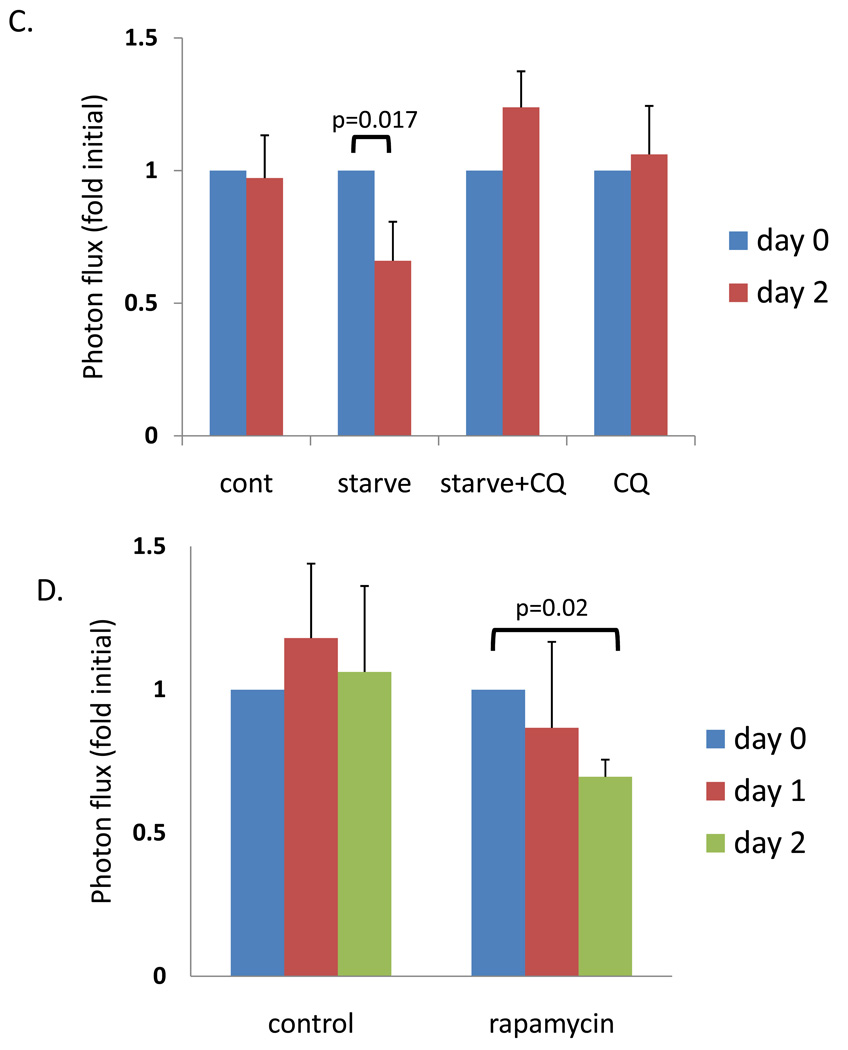
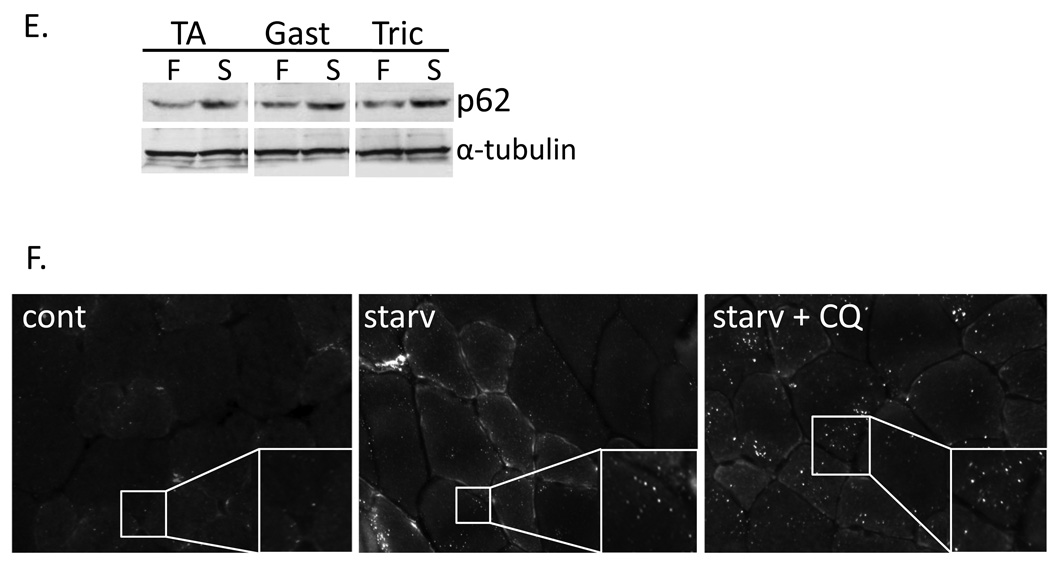
A) Diagram of imaging paradigm. Mice were electroporated with polyQ80 and polyQ19-luciferase constructs into the right and left TA muscle respectively. Two days post-electroporation (day 0 or pre-treatment group) the ratio of polyQ80/polyQ19-luciferase activity was determined for each animal. Each cohort of animals was subsequently treated with autophagic stimulus for one and two days (post-treatment). After treatment, the ratio of polyQ80/polyQ19-luciferase activity was again determined for each animal and the change was plotted. B) Sample images of control or ATG16L1 hypomorphic mice before (pre-treatment) and after food deprivation (post-treatment). (C) Six animals in each of 4 groups were electoporated and then were fed, starved, starved plus treated with intraperitoneal chloroquine or treated with chloroquine alone for two days. Only the starved animal group had a significant decrease of ~34% in the ratio of polyQ80/polyQ19-luciferase activity. (D) 12 animals were electroporated and half received no treatment or were treated with rapamycin for one and two days. Only the rapamycin treated animals had a significant decrease of ~30%. (E) Immunoblot analysis of skeletal muscle lysates (tibialis anterior, gastrocnemius, or triceps) from mice fed (F) or following 2 days of nutrient deprivation (S), using a p62 antibody. α-tubulin is shown as a loading control. (F) Tibialis anterior skeletal muscle was isolated from fed or animals nutrient deprived or nutrient deprived and treatment with chloroquine for 2 days and flash frozen in liquid nitrogen cooled isopentane. 8µM sections were immunostained with anti-p62 antibody. All images are taken at the same exposure. Inset shows magnification of boxed region.
In contrast, animals deprived of food (Figure 4B–C) had a 25% and 34% reduction in the ratio of polyQ80/polyQ19 after 1 and 2 days, respectively. This decrease was abolished by the co-administration of chloroquine. Chloroquine alone did not significantly change the ratio of polyQ80/polyQ19 after 2 days. Similar results were obtained after 2 days intraperitoneal injection of 5 mg/kg body weight of rapamycin (Figure 4D).
To compare our findings using polyQ80/polyQ19-luciferase with other methods of measuring autophagic induction, we analyzed skeletal muscle lysates from similarly treated animals using immunoblot or immunohistochemistry with the autophagosome marker, p62. Total p62 protein levels increased in skeletal muscle from animals subjected to 2 days of nutrient deprivation (Figure 4E). In addition, p62 puncta were not present in control mouse tibialis anterior muscle but were present in nutrient deprived and even more prominent in nutrient deprived plus chloroquine treatment (Figure 4F). These data confirm that under our experimental conditions, autophagy is induced in mouse TA skeletal muscle. More importantly, these data highlight the difficulty with interpretation and quantitation of autophagy using currently available methods. For example, although autophagy is impaired in the nutrient deprived plus chloroquine treated animal muscle it has an increase in p62 puncta similar to the autophagy competent, nutrient deprived animal muscle. GFP-LC3 puncta were also induced via nutrient deprivation in skeletal muscle when GFP-LC3 transgenic mice were used (data not shown).
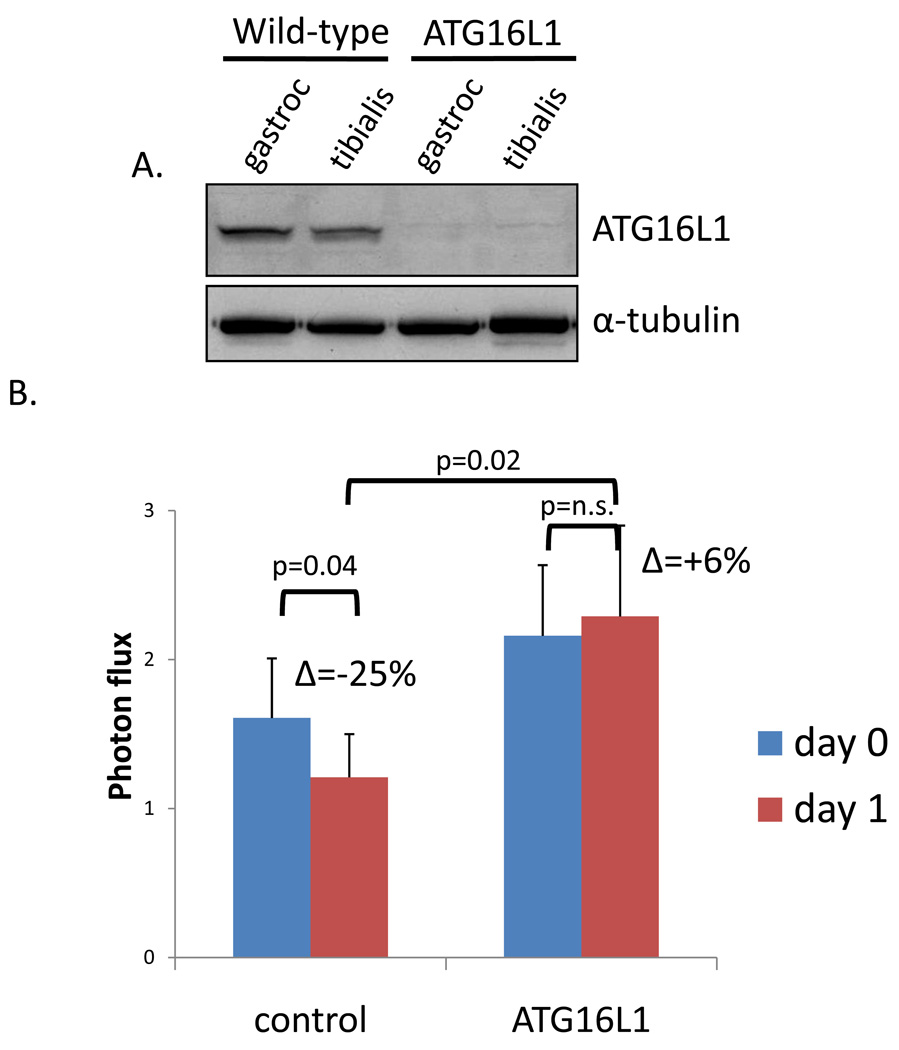
To determine whether in vivo bioluminescent imaging could detect a decrease in autophagic flux in a genetically manipulated animal model deficient in autophagy, we performed similar experiments in ATG16L1 hypomorphic mice which have a partial defect in autophagy (11). We confirmed that these mice lack ATG16L1 in skeletal via immunoblot using anti-ATG16L1 antibody (Figure 5A). Two changes were noticed in the ATG16L1 animals when compared to control littermates. The average polyQ80/polyQ19 ratio value was elevated in ATG16L1 animals on day 0 of imaging (day 2 post-electroporation) suggesting an increase in polyQ80-luciferase protein as compared with polyQ19-luciferase protein levels (Figure 4B and 5B). This was not due to a decrease in polyQ19 activity levels. The average polyQ19-luciferase activity from one experiment using three control and three ATG16L1 animals was 2.3 × 10 5 RLU/min and 2.4 × 10 5 RLU/min, respectively. In contrast, the average polyQ80-luciferase activity from the same three control or ATG16L1 animals was 2.6 × 10 5 RLU/min and 4.5 × 10 5 RLU/min, respectively. Following one day of starvation, control animals had a 25% decrease in the ratio of polyQ80/polyQ19 in contrast to ATG16L1 animals which had a 6% increase that was statistically insignificant (Figure 4B and 5B). These data suggest that ATG16L1 animals have impaired autophagic clearance of aggregate prone proteins under basal and induced conditions. Additionally, our assay using in vivo bioluminescence of aggregate prone luciferase reporters is able to detect changes in genetically modified animal models.
Figure 5.
A) Immunoblot of skeletal muscle lysate (gastrocnemius or tibialis anterior) from wild-type and ATG16L1 hypomorphic mice using an ATG16L1 antibody. B) A similar experiment as above was performed using 11 control or 7 ATG16L1 hypomorphic mice. The average polyQ80-luciferase/polyQ19-luciferase ratio for each animal is plotted. ATG16L1 mice have higher ratio and have a persistently elevated ratio following one day of starvation (6% increase from day 0). Whereas control animals had a 25% decrease in polyQ80/polyQ19-luciferase activity with starvation.
Discussion
The development of short-lived destabilized reporter constructs has been essential to the understanding of the ubiquitin-proteasome system (UPS) in vitro and in vivo (12–14). These constructs, when expressed in cells or tissue, provide an indirect readout of UPS activity (13). Similarly, fusion reporters of kinase substrates enable direct analysis of ligand-induced phosphorylation and subsequent ubiquitin-dependent degradation of key regulators of signaling cascades, such as IκBα, using IκB-Fluc fusion reporters (15). However, analogous reporters have not been successfully developed for the other major degradation pathway in cells, macroautophagy. This may be due to the fact that autophagy indiscriminately degrades long-lived proteins making it difficult to identify a suitable substrate. Recently, it has been shown that protein aggregates and inclusion bodies are preferentially degraded via autophagy (6, 8). More importantly, mechanisms that enhance autophagic degradation decrease inclusion bodies and improve cell survival in protein aggregate diseases (16).
We have developed a luciferase reporter that measures the preferential degradation of an aggregated protein, polyQ80-luciferase, and compares this to the degradation of a non-aggregated protein, polyQ19-luciferase. By inducing or inhibiting autophagy via various stimuli, we show that the ratiometric change in polyQ80-luciferase to polyQ19-luciferase activity is a sensitive, quantifiable and reproducible measure of “autophagic flux” in cells and animals.
The degradation and clearance of aggregated proteins is thought to occur primarily via autophagy, although some may occur via proteasomal degradation as well. Our assay does not specifically distinguish between degradative pathways, but rather reflects a change in steady-state protein aggregate clearance. By comparing the change in polyQ80-luciferase levels with polyQ19-luciferase levels, we are able to control for non-preferential protein degradation that also affects non-aggregated proteins. Additionally, this controls for changes in protein translation and synthesis that have been reported to affect the interpretation of autophagic inducers such as rapamycin (17). It will be interesting to see if our assay also correlates with the autophagic degradation of other long-lived substrates or organelles or if the rate of degradation in our assay is specific to aggregated proteins. To our knowledge, this type of comparison has not yet been attempted due to the technical impediment of quantitating “autophagic flux”.
Overall degradation and clearance of protein aggregates can be affected at many steps. These steps include aggregate formation, protein aggregate trafficking to an inclusion body, protein ubiquitination, autophagosome formation, lysosome fusion and finally degradation (18). The current assay does not distinguish between these intermediate steps and instead, measures global protein aggregate flux through this pathway. Alterations at any of these steps would be expected to selectively affect the degradation of polyQ80-luciferase when compared to polyQ19-luciferase and therefore, the assay may not be specific for the final commitment to the autophagic process. For example, mechanisms that disaggregate a protein aggregate, facilitate proper folding of misfolded proteins or impair trafficking to an inclusion body may alter polyQ80-luciferase levels and subsequent determination of autophagy activity, independent of formal autophagy, per se.
Nonetheless, our results suggest that autophagy induced via classical nutrient deprivation can be detected as early as 4 hours in cultured U20S cells and 6 hours in differentiated C2C12 cells using our assay. The decrease persisted in differentiated C2C12 cells after 18 hours. This did not reflect enhanced cell death since nutrient deprivation did not change polyQ19-luciferase levels or the activity of a co-transfected, non-regulated Renilla luciferase reporter (not shown). This finding is consistent with other studies demonstrating conversion of LC3I to LC3II or GFP-LC3 puncta formation (9).
We adapted our in vitro luciferase assay to living animals by electroporating mouse tibialis anterior with either polyQ80-luciferase or polyQ19-luciferase. Electroporation of plasmid DNA is an effective and efficient means of expressing exogenous protein in skeletal muscle (19). Expression of plasmid DNA in skeletal muscle via electroporation is affected by multiple variables (19). These variables include concentration and purity of plasmid DNA, volume of injection, and electroporation parameters. In addition, higher voltage electroporation results in significant tissue damage and diminished reporter expression. Since our sensitivity for luciferase detection was well above threshold, we were able to use a low voltage electroporation paradigm which resulted in minimal tissue damage as evaluated via histochemical analysis post-injection (data not shown). In fact, luciferase gene expression via in vivo bioluminescence is detectable at 2 days following direct naked plasmid DNA injection into mouse muscle without electroporation (personal observations).
In our experimental paradigm, each animal serves as its own control. For example the right TA is electroporated with polyQ80-luciferase and the left TA with polyQ19-luciferase. Therefore, any intervention that is performed on the whole animal, such as starvation or drug treatment, affects both the right and left limbs equally. In addition, since the ratio of polyQ80-luciferase to polyQ19-luciferase is variable from animal to animal, each animal is initially imaged at time point 0 (day 2 post-electroporation) and subsequent ratios are taken on days 1 or 2. The change in the ratio of polyQ80/polyQ18 luciferase activity is then compared for each animal and compared to the treatment group.
The ratio of polyQ80/polyQ19-luciferase had a small insignificant decrease in a cohort of 10 fed, untreated animals after 2 days. This subtle decrease suggests that polyQ80-luciferase may be degraded to a greater degree over time when compared with polyQ19-luciferase; a larger cohort of animals may be needed to confirm this finding. Other alternatives include an increase in myocyte death due to polyQ80-luciferase toxicity or perhaps polyQ80-luciferase expression induces autophagy independently of other treatments as has previously been reported (20, 21).
Interestingly, ATG16L1 hypomorphic mice and ATG5−/− MEFs had an overall increase in the ratio of polyQ80-luciferase/polyQ19-luciferase before the stimulation of autophagy. Therefore, these autophagy deficient mice and cells have more polyQ80-luciferase protein/ polyQ19-luciferase protein than wild-type control mice and ATG5+/+ MEFS. These results are consistent with a decrease in basal “autophagic flux” and suggest that our assay is capable of quantitating low levels of unstimulated autophagy.
Our study stimulated autophagy in mouse skeletal muscle via traditional mechanism such as starvation and the mTOR inhibitor, rapamycin. We found that intraperitoneal rapamycin was able to selectively enhance the degradation of polyQ80-luciferase in mouse skeletal muscle. Consistent with this, C2C12 myotubes treated with rapamycin also had a selective degradation of polyQ80-luciferase, with the ratio of polyQ80-luciferase/polyQ19-luciferase decreasing by 40% after 18 hours. Consistent with others, we did not see a change in the degradation of polyQ80-luciferase following 6 hours of rapamycin treatment (not shown) (22). This was in contrast to nutrient deprivation which decreased the ratio of polyQ80-luciferase/polyQ19-luciferase after only 6 hours. These data suggest that rapamycin may induce autophagy via other mechanisms such as transcriptional changes to autophagy related proteins in skeletal muscle as previously suggested (22).
In summary, we have developed a quantifiable method for evaluating “autophagic flux” of protein aggregates in vitro and in vivo. This technique may be especially valuable to identify impaired autophagic degradation in situations where the accumulation of autophagosome markers can be consistent with increased autophagy or alternatively impaired autophagic degradation. Additionally, our technique is amenable to high throughput assay development and may be useful in identifying compounds that preferential enhance the clearance of protein inclusions. The efficacy of these compounds can be further tested in live animal models.
Methods
Plasmids and Cell culture
PolyQ-luciferase constructs were generated as follows: firefly luciferase was excised from IκB-luciferase (15) with BamHI and NotI and subcloned in polyQ19 or polyQ80-CFP constructs after removal of CFP with XbaI and NotI. Luciferase antibody was purchased from Sigma (St. Louis). P62 antibody was purchased from Abgent (San Diego, CA). Osteosarcoma U20S cells and the mouse myoblast cell line C2C12 (American Type Culture Collection, Rockville, MD) were maintained at 37°C/5 % CO2 in Dulbecco's modified Eagle's medium (Sigma, Saint Louis) supplemented with 10% fetal bovine serum, 50 µg/ml penicillin, and 50 µg/ml streptomycin. ATG5 +/+ and −/− MEFS and the GFP-LC3 expression plasmid were obtained from Dr. Herbert Virgin.
Induction and Inhibition of Autophagy
To induce autophagy in vitro, cells were rinsed 2 times in Hanks’ balanced salt solution (HBSS) and then incubated in HBSS as a starvation medium either 4, 6 h or 18 h. Autophagy was also induced by administration of the mTOR specific inhibitor, rapamycin (Sigma), in the final concentration of 10 µg/ml. For dose experiments, low concentration rapamycin was 2 µg/ml and high dose was 50 µg/ml. Three chemical inhibitors were employed to block autophagy in U20S and/or C2C12 cells. These includes hydroxychloroquine (30 µg/ml) and bafilomycin A1 (200 ng/ml) which interfere with the fusion between autophagosomes and lysosomes. For low treatment, we used 6 µg/ml hydroxychloroquine and 40 ng/ml bafilomycinA1. For high concentration treatments, we used 150 µg/ml chloroquine and1 µg/ml of bafilomycinA1. 3-Methyladenine (3-MA) prevents the formation of autophagosomes and was used at 20 mM. For in vivo autophagy induction, mice were starved up to 48 h or dosed with intraperitoneal injections of rapamycin (5 mg/kg body weight) daily for 2 days. Hydroxychloroquine (10 mg/kg body weight) was i.p. injected two times daily for 2 days to inhibit autophagy. All chemicals were purchased from Sigma (St. Louis).
Animals
3–4 month old female C57/B6 mice were used for each experiment except for ATG16L1 mice (11) which were 4 months old and compared with littermate controls. In the case of starvation experiments, 6 animals were used per condition and data was from three independent experiments. For rapamycin experiments, 4 animals per condition were used in two independent experiments and for ATG16L1 experiments, 5 animals per condition were used in two independent experiments. 3 month old GFP-LC3 mice were obtained from the laboratory of Dr. Herbert Virgin.
In vitro luciferase assay
U20S and C2C12 myoblasts were transfected with either 1.5 µg polyQ19-luciferase or polyQ80-luciferase vector using lipofectamine2000 (Invitrogen) according to manufacturer’s protocol. In some cases, Renilla luciferase control reporter vector (pRL-TK) (Promega) was transfected at the same time for comparison. U20S cells were harvested 36 hours post-transfection and after treatment with starvation or rapamycin for 4 hours. For C2C12 myoblasts, 24 h post-transfection, cell media were changed to media containing 2% horse serum for differentiation. After 4–5 days of differentiation, C2C12 myotubes were treated with various chemicals and/or starvation with HBSS media to induce and/or inhibit autophagy for either 6 h or 18 h, thereafter lysed with passive lysis buffer (Promega) for 15 min at room temperature. One hundred microliters of lysates were pipetted into 96-well plates in triplicate. Luciferase activities of the resulting lysates were assessed with a luciferase assay system (Promega), according to manufacturer’s instructions by using a microplate luminometer with injectors (Molecular Devices). Data were expressed as a either relative light units or as the ratio of polyQ80-luciferase to polyQ19-luciferase luminescence signal values.
In Vivo Electroporation and Bioluminescent Imaging of Mice
Animal protocols were approved by the Animal Studies Committee of Washington University School of Medicine. Mice were anesthetized using pentobarbital (50 mg per kg body weight). The skin overlying the tibialis anterior (TA) muscle was shaved, and the animals were injected with endotoxin free polyQ19-luciferase (left leg, 25 µg) or polyQ80-luciferase (right leg, 25 µg) diluted in sterile PBS to a volume of 50 µl by using a 0.5 ml syringe fitted with a 29-gauge needle. Two-needle array electrodes (BTX, San Diego, CA) were inserted into the muscle immediately after DNA delivery for electroporation. The distance between the electrodes was 5 mm, and the array was inserted longitudinally relative to the muscle fibers. In vivo electroporation parameters were the following: voltage, 75 V; pulse length, 50-ms; # of pulse, 6 pulses; pulse interval, 200 msec; desired field strength, 200V/cm, given by a BTX ECM830 Electro Square Porator. After 2 days of recovery, mice were anesthetized (isoflurane), and bioluminescence imaging with a CCD camera (IVIS imaging system, Caliper) was initiated 10 min after i.p. injection of d-luciferin (150 µg per g of body weight) for muscle polyQ-luciferase expression. Luminescent images were obtained using the same exposure time for each individual experiment, 2–5 min; binning, 2–8; no filter; f-stop, 1; FOV, 10 cm. After pretreatment imaging, mice were treated with rapamycin, chloroquine and/or starvation, or saline for the control group. Post-treatment imaging was performed at 24 h and 48 h treatments after i.p. injection of d-luciferin at each of those times. Regions of interest were defined manually over the TA muscles for determining total photon flux (photons per second). Data is expressed as a ratio of polyQ80-luciferase to polyQ19-luciferase photon values.
Statistical Analysis
For in vitro studies, individual transfections were treated as independent experiments and unpaired student t-tests were performed on treatment versus non-treatment groups. All in vitro studies were performed in triplicate and repeated on three independent occasions. For in vivo studies, the change in the ratio of polyQ80/polyQ19 for each animal using the pretreatment value as a baseline was calculated for each independent animal. Statistical analysis was performed using paired student t-tests by comparing the ratiometric change from each animal in control and treatment groups.
Acknowledgments
The authors would like to Dr. Phyllis Hanson for polyQ19 and polyq80-CFP constructs. This research was supported through NIH K08 AG026271 (C.C.W.) and P50 CA94056 (D.P.W.)
References
- 1.Klionsky DJ. Autophagy: from phenomenology to molecular understanding in less than a decade. Nat Rev Mol Cell Biol. 2007;8(11):931–937. doi: 10.1038/nrm2245. [DOI] [PubMed] [Google Scholar]
- 2.Mizushima N, Levine B, Cuervo AM, Klionsky DJ. Autophagy fights disease through cellular self-digestion. Nature. 2008;451(7182):1069–1075. doi: 10.1038/nature06639. [DOI] [PMC free article] [PubMed] [Google Scholar]
- 3.Klionsky DJ, et al. Guidelines for the use and interpretation of assays for monitoring autophagy in higher eukaryotes. Autophagy. 2008;4(2):151–175. doi: 10.4161/auto.5338. [DOI] [PMC free article] [PubMed] [Google Scholar]
- 4.Iwai-Kanai E, et al. A method to measure cardiac autophagic flux in vivo. Autophagy. 2008;4(3):322–329. doi: 10.4161/auto.5603. [DOI] [PMC free article] [PubMed] [Google Scholar]
- 5.Mizushima N, Yoshimori T. How to interpret LC3 immunoblotting. Autophagy. 2007;3(6):542–545. doi: 10.4161/auto.4600. [DOI] [PubMed] [Google Scholar]
- 6.Taylor JP, et al. Aggresomes protect cells by enhancing the degradation of toxic polyglutamine-containing protein. Hum Mol Genet. 2003;12(7):749–757. doi: 10.1093/hmg/ddg074. [DOI] [PubMed] [Google Scholar]
- 7.Berger Z, et al. Rapamycin alleviates toxicity of different aggregate-prone proteins. Hum Mol Genet. 2006;15(3):433–442. doi: 10.1093/hmg/ddi458. [DOI] [PubMed] [Google Scholar]
- 8.Ravikumar B, Duden R, Rubinsztein DC. Aggregate-prone proteins with polyglutamine and polyalanine expansions are degraded by autophagy. Hum Mol Genet. 2002;11(9):1107–1117. doi: 10.1093/hmg/11.9.1107. [DOI] [PubMed] [Google Scholar]
- 9.Mizushima N, Yamamoto A, Matsui M, Yoshimori T, Ohsumi Y. In vivo analysis of autophagy in response to nutrient starvation using transgenic mice expressing a fluorescent autophagosome marker. Mol Biol Cell. 2004;15(3):1101–1111. doi: 10.1091/mbc.E03-09-0704. [DOI] [PMC free article] [PubMed] [Google Scholar]
- 10.Hara T, et al. Suppression of basal autophagy in neural cells causes neurodegenerative disease in mice. Nature. 2006;441(7095):885–889. doi: 10.1038/nature04724. [DOI] [PubMed] [Google Scholar]
- 11.Cadwell K, et al. A key role for autophagy and the autophagy gene Atg16l1 in mouse and human intestinal Paneth cells. Nature. 2008 doi: 10.1038/nature07416. [DOI] [PMC free article] [PubMed] [Google Scholar]
- 12.Luker GD, Pica CM, Song J, Luker KE, Piwnica-Worms D. Imaging 26S proteasome activity and inhibition in living mice. Nat Med. 2003;9(7):969–973. doi: 10.1038/nm894. [DOI] [PubMed] [Google Scholar]
- 13.Dantuma NP, Lindsten K, Glas R, Jellne M, Masucci MG. Short-lived green fluorescent proteins for quantifying ubiquitin/proteasome-dependent proteolysis in living cells. Nat Biotechnol. 2000;18(5):538–543. doi: 10.1038/75406. [DOI] [PubMed] [Google Scholar]
- 14.Lindsten K, Menendez-Benito V, Masucci MG, Dantuma NP. A transgenic mouse model of the ubiquitin/proteasome system. Nat Biotechnol. 2003;21(8):897–902. doi: 10.1038/nbt851. [DOI] [PubMed] [Google Scholar]
- 15.Gross S, Piwnica-Worms D. Real-time imaging of ligand-induced IKK activation in intact cells and in living mice. Nat Methods. 2005;2(8):607–614. doi: 10.1038/nmeth779. [DOI] [PubMed] [Google Scholar]
- 16.Rubinsztein DC. The roles of intracellular protein-degradation pathways in neurodegeneration. Nature. 2006;443(7113):780–786. doi: 10.1038/nature05291. [DOI] [PubMed] [Google Scholar]
- 17.King MA, et al. Rapamycin inhibits polyglutamine aggregation independently of autophagy by reducing protein synthesis. Mol Pharmacol. 2008;73(4):1052–1063. doi: 10.1124/mol.107.043398. [DOI] [PubMed] [Google Scholar]
- 18.Rochet JC. Novel therapeutic strategies for the treatment of protein-misfolding diseases. Expert Rev Mol Med. 2007;9(17):1–34. doi: 10.1017/S1462399407000385. [DOI] [PubMed] [Google Scholar]
- 19.Schertzer JD, Plant DR, Lynch GS. Optimizing plasmid-based gene transfer for investigating skeletal muscle structure and function. Mol Ther. 2006;13(4):795–803. doi: 10.1016/j.ymthe.2005.09.019. [DOI] [PubMed] [Google Scholar]
- 20.Tannous P, et al. Intracellular protein aggregation is a proximal trigger of cardiomyocyte autophagy. Circulation. 2008;117(24):3070–3078. doi: 10.1161/CIRCULATIONAHA.107.763870. [DOI] [PMC free article] [PubMed] [Google Scholar]
- 21.Iwata A, Riley BE, Johnston JA, Kopito RR. HDAC6 and microtubules are required for autophagic degradation of aggregated huntingtin. J Biol Chem. 2005;280(48):40282–40292. doi: 10.1074/jbc.M508786200. [DOI] [PubMed] [Google Scholar]
- 22.Zhao J, et al. FoxO3 coordinately activates protein degradation by the autophagic/lysosomal and proteasomal pathways in atrophying muscle cells. Cell Metab. 2007;6(6):472–483. doi: 10.1016/j.cmet.2007.11.004. [DOI] [PubMed] [Google Scholar]


