

Abstract
Background
Multiharmonic phase analysis (MHPA) was developed to assess left-ventricular dyssynchrony from gated myocardial perfusion single-photon emission computed tomography (GSPECT) studies. This study was intended to determine the temporal resolution of MHPA.
Methods
A reference normal GSPECT study with 128 frames/cycle was simulated using NCAT, a nonuniform rational B-splines-based cardiac torso phantom. It was shifted in the time domain to insert phase delays. Realistic GSPECT studies (8 or 16 frames/cycle) were then obtained by down-sampling the reference and shifted studies. All GSPECT projections were generated with attenuation, scatter, collimator blurring, and Poisson noise. Seventeen regional phases were calculated from the GSPECT reconstructions (filtered back-projection without compensation for physical factors), using linear interpolation for the reference study, and MHPA for the realistic studies. Comparing the regional phases between the realistic studies without and with shifts determined whether MHPA could identify certain phase delays.
Results
When there were enough counts/pixel (> 10 counts/pixel), MHPA with either 1, 2, or 3 harmonics could resolve a phase difference of 5.6°, corresponding to 1/64 of the cardiac cycle.
Conclusions
With clinically equivalent counts, the temporal resolution of MHPA is 1/64 of a cardiac cycle. Achieving this high temporal resolution from data with low temporal resolution demonstrates the benefit of replacing discrete points with continuous harmonic functions.
Keywords: Phase analysis, left-ventricular dyssynchrony, gated myocardial perfusion SPECT
Cardiac resynchronization therapy (CRT) shows benefits in some patients with end-stage heart failure, depressed left-ventricular ejection fraction (LVEF <35%), and a wide QRS complex on the surface electrocardiogram (ECG) (>120 ms).1 Although previous studies of CRT reported promising results, a significant percentage of patients (20% to 30%) in these studies failed to benefit from CRT.1-4 It was suggested that electrical dyssynchrony, as determined by duration of QRS, may not necessarily represent mechanical dyssynchrony, a n d therefore might not represent the best predictor of response to CRT.5-7 Therefore, cardiac mechanical dyssynchrony was investigated recently, to promote a more accurate selection of patients who would more consistently benefit from CRT. Recent data indicated that left-ventricular (LV) dyssynchrony may be mandatory for a response to CRT.8,9
Various imaging techniques were utilized for the assessment of LV dyssynchrony, including echocardiography with tissue Doppler imaging (TDI) or strain imaging,10-12 magnetic resonance imaging,13,14 gated blood-pool ventriculography, and gated blood-pool single-photon emission computed tomography (SPECT).15-17 Recently, first-harmonic phase analysis was developed for the assessment of LV dyssynchrony from gated SPECT (GSPECT) myocardial perfusion imaging (MPI).18 This technique is based on the partial-volume effect,19 because of which the change in regional maximal counts throughout the cardiac cycle is proportional to the change in myocardial thickness.20,21 It uses the first Fourier harmonic to approximate the LV regional wall thickness change throughout the cardiac cycle, and then extracts the amplitude and phase of the first Fourier harmonic. The phase information is related to the time interval when a region in the three-dimensional (3D) LV myocardial wall starts to thicken. It provides information about the heterogeneity of the distribution of these time intervals for the entire LV, ie, a measure of LV dyssynchrony.18
First-harmonic phase analysis was recently evaluated in patients. In a study including consecutive patients with LV dysfunction (n = 120), left-bundle branch block (LBBB, n = 33), right-bundle branch block (RBBB, n = 19), ventricular paced rhythms (n = 23), and normal control subjects (n = 157), it was shown to discriminate appropriately between groups of patients who were expected, on average, to have different degrees of LV dyssynchrony.22 Moreover, it showed good correlation with TDI in a study including 75 patients with heart failure who were clinically referred for the evaluation of potential eligibility for CRT.23 In a study including 42 patients with severe heart failure, depressed LVEF, and a wide QRS complex, first-harmonic phase analysis demonstrated a sensitivity and specificity greater than 70% for the prediction of response to CRT.24
Because GSPECT studies are usually acquired as 8 or 16 frames per cardiac cycle, these data are perceived to have low temporal resolution. A technical question regarding the temporal resolution of phase measurement has arisen since the inception of this technique, ie, what is the smallest phase difference that phase analysis can resolve? In other words, can phase analysis detect a contraction delay, which corresponds to a time bin much smaller than that given by each frame of GSPECT data with only 8 or 16 frames per cardiac cycle? Phase analysis replaces the discrete points with continuous Fourier harmonic functions (combinations of sine and cosine functions), and can achieve a higher temporal resolution for its phase measurement from a GSPECT study acquired with low temporal resolution data. By equivalent, temporal resolution of phase analysis means that phase analysis can detect phase delays using GSPECT data acquired with 8 or 16 frames per cardiac cycle as effectively as if they were acquired using more frames per cardiac cycle but processed without Fourier analysis. This study was intended to determine the temporal resolution of phase analysis using NCAT (nonuniform rational B-splines-based cardiac torso digital phantom) simulations.
Materials and Methods
NCAT Simulations
This study used NCAT to simulate normal GSPECT MPI data. This phantom used nonuniform rational B-splines (NURBS) to define mathematically the surfaces of heart structures, as used in 3D computer graphics. As the surfaces defined by NURBS were continuous, the NCAT phantom was able to simulate activity and attenuation distributions in any spatial and temporal resolution.25 The activity and attenuation distributions used in this study were generated as a 512 × 512 matrix, 128 slices, cubic voxel with a size of 1.17 mm, and 128 frames per cardiac cycle. Then Tc-99m GSPECT data (512 × 512 matrix, 1.17 mm/pixel, 60 views over the 180° acquisition arc from right anterior 45° to left posterior 45°, 128 frames/cycle) were generated, using an analytical projector including major physical factors such as photon attenuation, distance-dependent collimator resolution, and first-order Compton scatter.26 These planar projections were downsized in the spatial domain to a 64 × 64 matrix, 6.55 mm/pixel, and then served as reference study (dataset A in Table 1). The reference study was shifted in the time domain by 1 or 2 frames, to insert a phase delay of 2.8° and 5.6°. Realistic GSPECT data with 8 frames/cycle (datasets B and C in Table 1) or 16 frames/cycle (datasets D and E in Table 1) were then generated by summing the nearest frames of the unshifted and shifted reference study. Poisson noise was then added to these realistic GSPECT planar projections to represent noise seen in clinical images with maximum LV counts of 20 and 10 in 45° left-anterior oblique projections, respectively. No noise was added to the reference study. Table 1 summarizes the simulated datasets. Figure 1 gives examples of NCAT activity maps, simulated planar projections, and reconstructed images.
Table 1. Summary of simulated datasets.
| Datasets | Sampling rate (frames/cycle) | Count level | Phase shift (frames) | |
|---|---|---|---|---|
| Reference | A | 128 | No noise | 0 |
| Realistic | B1 | 16 | 20 counts/pixel | 0 |
| B2 | 1 | |||
| B3 | 2 | |||
| C1 | 16 | 10 counts/pixel | 0 | |
| C2 | 1 | |||
| C3 | 2 | |||
| D1 | 8 | 20 counts/pixel | 0 | |
| D2 | 1 | |||
| D3 | 2 | |||
| E1 | 8 | 10 counts/pixel | 0 | |
| E2 | 1 | |||
| E3 | 2 |
Figure 1.
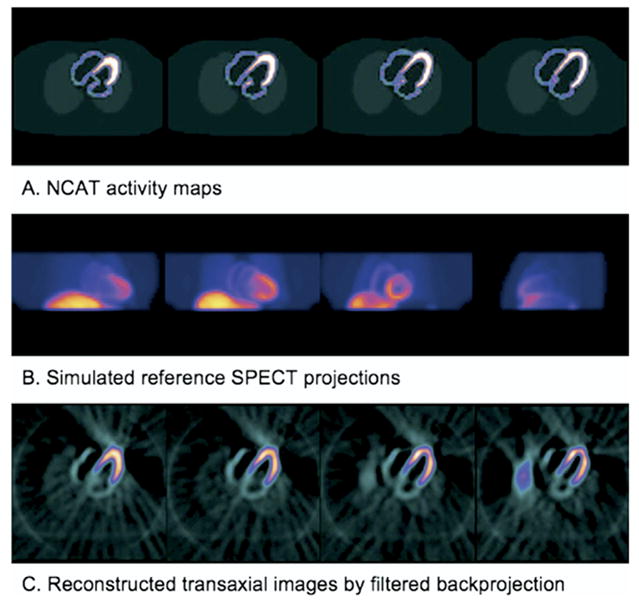
Sample NCAT activity maps (A), simulated SPECT projections (B), and transaxial images reconstructed by filtered back projection (C). Note that the reference SPECT projections do not contain any noise, whereas the transaxial images are reconstructed from realistic SPECT projections that are generated by adding Poisson noise to the reference SPECT projections.
Multiharmonic Phase Analysis
The simulated GSPECT data were filtered by a Butterworth low-pass filter (critical frequency, 0.5 Nyquist; power = 10), reconstructed by filtered back-projection (FBP), and reoriented to yield gated short-axis images. Then the gated short-axis images underwent two-step automatic postprocessing (image identification27 and 3D searching for regional maximum counts28), which was previously developed and implemented in the Emory Cardiac Toolbox (Emory University, Atlanta, Ga). Because the regional maximal counts were proportional to the regional myocardial wall thickness,20 a 3D image was then constructed from all LV short-axis slices of each gate to represent the regional wall thickness of the entire ventricle at the particular time point during a cardiac cycle. Repeating this process for all gates, with spatial interpolation to account for LV size change during a cardiac cycle, the regional wall-thickness variations over the cardiac cycle were obtained. The discrete wall-thickness points were submitted to the Fourier transform to calculate the average thickness value (DC value) and the first, second, and third harmonic functions. Then continuous curves including 1 (the first), 2 (the first and second), and 3 (the first, second, and third) harmonics were constructed, respectively, to fit the discrete wall-thickness points. The time points when these curves crossed the DC line were calculated as the phases of onset of mechanical contraction. Figure 2 illustrates the processing steps of multiharmonic phase analysis (MHPA).
Figure 2.
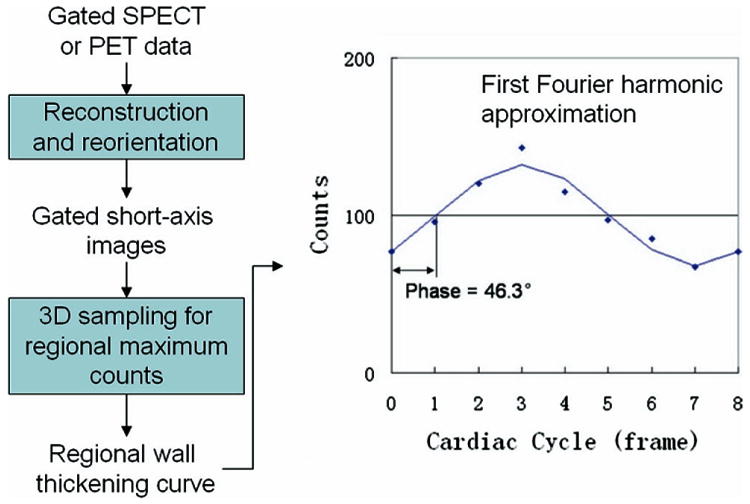
Processing steps of the phase analysis of regional myocardial wall thickening. The points in the plots are the regional wall-thickening data. The first harmonic approximation for 8 frames/cycle is shown as solid line.
Data Analysis
Seventeen regional phases according to the 17-segment model (Figure 3) were calculated from each dataset. For the reference study with 128 frames/cycle (dataset A), linear interpolation was used to calculate phases. For realistic studies with 8 or 16 frames/cycle (datasets B, C, D, and E), MHPA including 1 (the first), 2 (the first and second), and 3 (the first, second, and third) harmonics was used to calculate the respective phases. Comparing phases between the realistic studies without and with shifts (B2 and B3 vs B1; C2 and C3 vs C1; D2 and D3 vs D1; and E2 and E3 vs E1) by paired t test (n = 17) indicated the smallest phase differences that MHPA could resolve. In other words, if a comparison resulted in statistically significant difference, it meant that MHPA detected a statistically significant phase difference between the two datasets, and thus had a temporal resolution corresponding to the phase shift.
Figure 3.
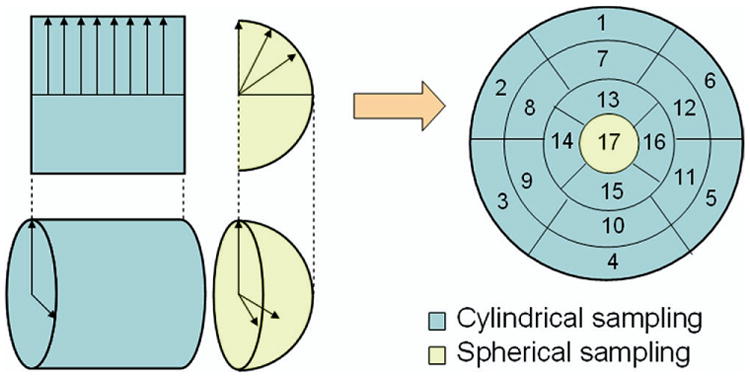
Thee-dimensional sampling of left-ventricular myocardium in 17-segment model. The 3D sampling uses two different sampling schemes for the apical and medial-basal regions of the myocardium. Samples are then regrouped into a polar map, which is then segmented into 17 segments for regional phase analysis. Note that the dividing point between the two sampling coordinate systems is patient-specific, and not necessarily the boundary of the seventeenth segment. The distance of this point from the apical point is usually set to the average radius of all short-axis slices of the patient.
The phases given by MHPA of the realistic studies with 20 counts/pixel without shifts (datasets B1 and D1) were also compared to the reference study (dataset A) by paired t test (n = 17), to determine their accuracy in measuring the exact phases of onset of mechanical contraction (the exact time point when the approximated wall-thickening curve crossed the DC line).
Results
Table 2 shows the mean phase differences ± standard deviations in degrees between realistic studies with and without shifts. P < .0021 (Bonferroni-corrected threshold for statistical significance) indicated significant differences between the phases calculated by MHPA of the shifted studies and the phases calculated by MHPA of the unshifted studies. In other words, phase analysis was able to detect such phase delays. The temporal resolution of the phase measurement by MHPA was related to count level. When the myocardial count levels were sufficient (≥10 counts/pixel), MHPA could detect a phase difference of 5.6° that corresponded to 1/64 of a cardiac cycle.
Table 2. Measured phase differences compared to actual phase shifts as a function of count level, sampling rate, and number of harmonics.
| 16 frames/cycle | 8 frames/cycle | ||||||
|---|---|---|---|---|---|---|---|
| Actual shifts | Counts/pixel | H1 | H2 | H3 | H1 | H2 | H3 |
| 1 frame (2.8°) | 10 | −1.4 ± 5.2 | 1.6 ± 7.2 | −1.3 ± 2.9 | 0.5 ± 1.5 | 0.8 ± 2.0 | 1.0 ± 2.0 |
| 20 | 1.5 ± 1.8* | 1.6 ± 1.5† | 1.6 ± 1.8† | 1.2 ± 1.5* | 1.6 ± 1.2† | 1.2 ± 1.4† | |
| 2 frames (5.6°) | 10 | 6.9 ± 2.7† | 6.0 ± 6.7† | 4.3 ± 2.3† | 3.3 ± 2.5† | 2.9 ± 2.6† | 3.0 ± 3.3† |
| 20 | 5.2 ± 1.1 † | 3.3 ± 2.1 † | 4.4 ± 2.0† | 3.2 ± 2.6† | 3.3 ± 1.9† | 2.5 ± 2.3† | |
Shown are mean differences ± standard deviations (in degrees) between 17 phases of realistic studies with shifts vs without shifts (datasets B2 and B3 vs B1; C2 and C3 vs C1; D2 and D3 vs D1; and E2 and E3 vs E1, as listed in Table 1).
H1, Harmonic phase analysis; H2, 2-harmonic phase analysis; H3, 3-harmonic phase analysis.
P < .05 indicates that phase analysis produced inaccurate measurement of the exact onset of mechanical contraction.
P < .0021 (= 0.05/24, Bonferroni-corrected threshold for statistical significance); indicates that phase analysis can detect phase delays induced by shifts.
Table 3 shows that the 1-harmonic phase analysis produced inaccurate measurement of the exact onset of mechanical contraction (∼12° error), whereas the errors of the 2-harmonic and 3-harmonic phase analyses were very small (∼1°). The P values in Table 3 were calculated by paired t test between the 17 phases given by the phase analyses of the realistic studies without shifts (16 or 8 frames/cycle, with noise; myocardial count level, 20 counts/pixel) and those by linear interpolation of the reference study (128 frames/cycle, no noise). P < .05 for the 1-harmonic phase analysis indicated that this method yielded inaccurate measurements of the exact onset of mechanical contraction.
Table 3. Error in phase measurement as a function of sampling rate and number of harmonics.
| 16 frames/cycle | 8 frames/cycle | |||||
|---|---|---|---|---|---|---|
| H1 | H2 | H3 | H1 | H2 | H3 | |
| Mean difference | −12.8° | −1.0° | −0.7° | −12.2° | −0.1° | 1.6° |
| SD difference | 12.2° | 10.3° | 6.5° | 12.2° | 11.4° | 8.7° |
| P | .001* | .693 | .660 | .001* | .983 | .461 |
Shown are mean differences, standard deviations (in degrees), and paired t test P values between 17 phases of realistic studies without shifts versus 17 phases of the reference study (datasets B1 vs A, and D1 vs A, as listed in Table 1).
H1, Harmonic phase analysis; H2, 2-harmonic phase analysis; H3, 3-harmonic phase analysis.
P < .05 indicates that phase analysis produced inaccurate measurement of the exact onset of mechanical contraction.
Figure 4 shows a typical wall-thickening curve over the cardiac cycle, and illustrates the 1-harmonic, 2-harmonic, and 3-harmonic phase analyses of this curve. As seen in Figure 4, the more harmonics were included, the more accurate was the measured onset of mechanical contraction (the time point when the continuous curve crossed the DC line). The accuracy of the 1-harmonic phase analysis was limited because the increasing slope of the first harmonic was fixed when the wall-thickening amplitude was a constant. This inherent characteristic can introduce errors in measuring the onset of mechanical contraction, when the contraction velocity is either faster (healthy subject) or slower (abnormal patient) than the increasing slope. Higher harmonics can better approximate the wall-thickening curves, and yield phases that match the exact onset of mechanical contraction better than the first harmonic.
Figure 4.
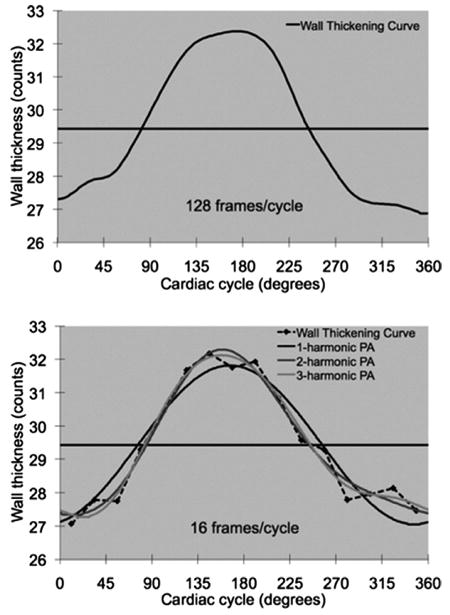
Multiharmonic phase analyses. The upper curve involves 128 frames/cycle without noise. By linear interpolation, the phase of this curve (the time point when the curve crosses the DC line) is 82.9°. The lower curve is downsized to 16 frames/cycle from the left curve, and with added noise. The phases calculated by the 1-harmonic, 2-harmonic, and 3-harmonic phase analyses (time points when the curves cross the DC line) are 76.3°, 84.6°, and 82.7°, respectively.
Figure 5 gives the MHPA results of a sample patient. This patient had a defect at the anterior side of the anterolateral wall, which was extended to the apical wall. He had a normal LVEF of 61%. The MHPA of this patient showed that the anterolateral wall had delayed phases of onset of mechanical contraction compared with the normal region, indicating that any of the 1-harmonic, 2-harmonic, and 3-harmonic phase analyses can detect phase delays between normal and abnormal regions. Similar to the perfusion defect, the phase delays were also extended from the anterolateral wall to the apical wall. The apical phase delays seemed more significant when using either 2-harmonic or 3-harmonic phase analysis rather than 1-harmonic phase analysis. This observation suggested that both 2-harmonic and 3-harmonic phase analyses can be more sensitive in measuring phase delays than 1-harmonic phase analysis, because they can measure the exact onset of mechanical contraction more accurately than the 1-harmonic phase analysis.
Figure 5.
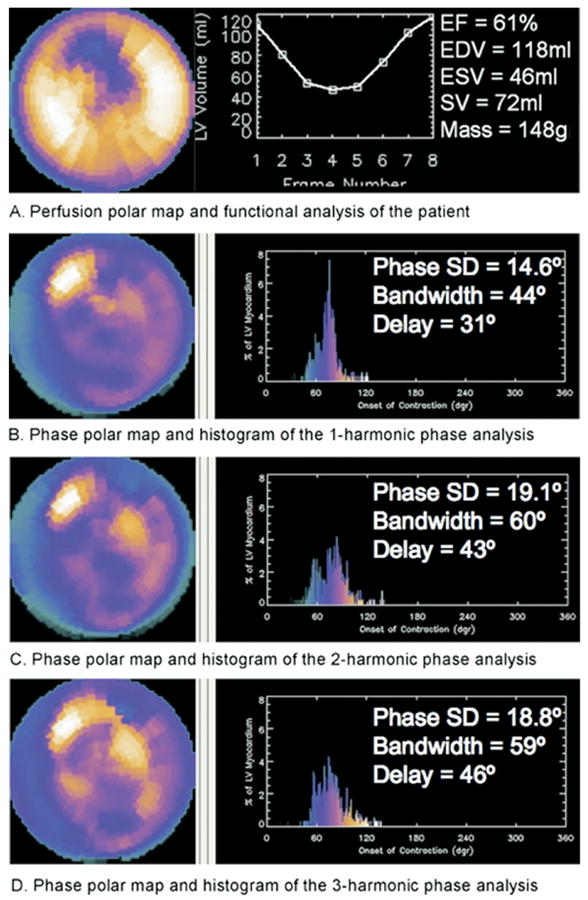
Perfusion polar map and functional analysis (A), and phase polar maps and histograms of multiharmonic phase analyses (B-D) of a sample patient. This patient had an anterolateral defect and a normal ejection fraction. The defect extended from the anterolateral wall to the apical wall. The 1-harmonic, 2-harmonic, and 3-harmonic phase analyses detected a phase delay in the onset of mechanical contraction at the anterolateral region. The phase delay also extended to the apical region, where 2-harmonic and 3-harmonic phase analyses detected a more significant delay than did 1-harmonic phase analysis. Phase standard deviations, histogram bandwidths, and phase delays between the earliest and latest segments are also shown. The 2-harmonic and 3-harmonic phase analyses indicate a more dyssynchronous onset of mechanical contraction for this patient, suggesting that 2-harmonic and 3-harmonic phase analyses may be more sensitive in measuring LV dyssynchrony.
Discussion
The purpose of this study was to demonstrate that MHPA can use GSPECT data with 8 or 16 frames per cardiac cycle to detect phase delays with a temporal resolution equivalent to 64 frames per cardiac cycle. Although this methodology is well-based on mathematical and physical principles, it seems counterintuitive because of the perceived low temporal resolution of the GSPECT MPI data. With NCAT simulation, this study showed that the phase-analysis methodology can detect phase delays as small as 1/64 of a cardiac cycle in common clinical settings (≥10 counts per myocardial pixel). This study also compared 1-harmonic phase analysis with 2-harmonic and 3-harmonic phase analyses in measuring the exact time point when the approximated wall-thickening curve crosses the DC line, ie, the onset of mechanical contraction. We found that the 1-harmonic phase analysis was less accurate than the 2-harmonic and 3-harmonic phase analyses in measuring the onset of mechanical contraction.
The patient example in Figure 5 demonstrated these findings: (1) MHPA with either 1-harmonic, 2-harmonic, or 3-harmonic phase analyses detected the region with late contraction, which matched the location of the perfusion defects; and (2) the 2-harmonic and 3-harmonic phase analyses detected the small apical delay better (were more sensitive) than the 1-harmonic phase analysis, because of their more accurate measurement of the onset of mechanical contraction. This potential sensitivity needs to be evaluated in a large group of patients to determine its clinical impact.
The main limitation of this study was that the projector used to simulate the GSPECT data was not Monte Carlo-based, and may be less accurate. Monte Carlo methods can undoubtedly yield a more accurate simulation. However, their superior accuracy is more in the spatial domain (accuracy of each frame) than in the time domain (accuracy of count variations that phase analysis measures). In addition, the reconstruction method used in this study was FBP without any compensation for physical factors such as photon attenuation, collimator resolution, and Compton scatter. Image reconstruction has significantly improved since the introduction of iterative algorithms. Iterative reconstruction has shown improvements in the image quality of myocardial perfusion SPECT studies, especially when major physical factors such as attenuation, scatter, and collimator resolution are modeled accurately in its iterative process. However, iterative reconstructions have not been well-validated for gated studies. It is unknown how much the reconstruction algorithm can affect wall-thickening measurements and MHPA. Indeed, this is worth investigating. One of the advantages of MHPA, as presented here, is that it can be applied to any GSPECT data that have already been acquired. Considering the reality that most of the data were acquired without transmission scanning and that some sites kept only reconstructed images, it is reasonable to start implementing and validating MHPA for FBP, the most widely used reconstruction method. This attempt, if it succeeds, will allow the widest usage of this technique in the field.
Noise and filtering have a definite impact on the counts of GSPECT images. This study added only certain levels of noise into the simulations. It must be noted that the higher harmonics should be affected more by noise than the lower harmonics; therefore, care must be taken when using a phase analysis including higher harmonics. This study applied Butterworth low-pass filtering to produce the gated short-axis images, as most clinicians do currently. The filtering was only in the spatial domain. No temporal filtering was applied for phase analysis. It is remains to be investigated what the optimal filtering scheme would be for phase analysis.
This study showed that the temporal resolution of MHPA was related to count level. Count level was also related to the accuracy of where the thickening curve crossed the DC line. Neither relationship was fully investigated in this study. In addition, it must be noted that the 17 segments in this study had higher count contents than a single voxel, so that the temporal resolution of MHPA shown here may be too good for a single voxel. Nevertheless, it must also be noted that the voxel-wise count content can be improved by maximum count circumferential sampling, and by spatial and temporal filtering. More investigations regarding count level versus temporal resolution are needed for the next step.
Conclusions
In common clinical settings (≥10 counts per myocardial pixel), the temporal resolution of the phase measurement by MHPA is 1/64 of a cardiac cycle, demonstrating the benefit of replacing discrete points with continuous harmonic functions in phase analysis. Adding more harmonics to phase analysis could improve the measurement of the exact time point of onset of mechanical contraction, and might be more sensitive in detecting regional phase delays and LV dyssynchrony. The clinical impact of this potential needs to be evaluated in a large group of patients.
Acknowledgments
The authors thank Ami E. Iskandrian, MD et al of the University of Alabama at Birmingham, Salvador Borges-Neto, MD et al of Duke University, Jeroen J. Bax, MD, PhD et al of Leiden University, Jose C. Meneghetti, MD et al of the University of São Paulo, and Kenneth Nichols, PhD et al of Long Island Jewish Hospital for their contributions to the clinical evaluation of the phase-analysis methodology. The authors also thank William P. Segars, PhD et al of Duke University who developed and provided the NCAT software for this study.
This study was supported in part by an ASNC/GE Healthcare Research Award from the American Society of Nuclear Cardiology Foundation. This study was also part of an NIH research (1R01HL 094438-01).
Footnotes
The authors receive royalties from sales of the Emory Cardiac Toolbox. The terms of this arrangement were reviewed and approved by Emory University in accordance with its conflict-of-interest practice.
References
- 1.Leclercq C, Kass DA. Retiming the failing heart: Principles and current clinical status of cardiac resynchronization. J Am Coll Cardiol. 2002;39:194–201. doi: 10.1016/s0735-1097(01)01747-8. [DOI] [PubMed] [Google Scholar]
- 2.Abraham WT, Hayes DL. Cardiac resynchronization therapy for heart failure. Circulation. 2003;108:2596–603. doi: 10.1161/01.CIR.0000096580.26969.9A. [DOI] [PubMed] [Google Scholar]
- 3.Leclercq C, Hare JM. Ventricular resynchronization: Current state of the art. Circulation. 2004;109:296–9. doi: 10.1161/01.CIR.0000113458.76455.03. [DOI] [PubMed] [Google Scholar]
- 4.Auricchio A, Stellbrink C, Block M, Sack S, Vogt J, Bakker P, et al. Effect of pacing chamber and atrioventricular delay on acute systolic function of paced patients with congestive heart failure. The Pacing Therapies for Congestive Heart Failure Study Group. The Guidant Congestive Heart Failure Research Group. Circulation. 1999;99:2993–3001. doi: 10.1161/01.cir.99.23.2993. [DOI] [PubMed] [Google Scholar]
- 5.Brecker SJ, Xiao HB, Sparrow J, Gibson DG. Effects of dual-chamber pacing with short atrioventricular delay in dilated cardiomyopathy. Lancet. 1992;340:1308–12. doi: 10.1016/0140-6736(92)92492-x. [DOI] [PubMed] [Google Scholar]
- 6.Leclercq C, Faris O, Tunin R, Johnson J, Kato R, Evans F, et al. Systolic improvement and mechanical resynchronization does not require electrical synchrony in the dilated failing heart with left bundle-branch block. Circulation. 2002;106:1760–3. doi: 10.1161/01.cir.0000035037.11968.5c. [DOI] [PubMed] [Google Scholar]
- 7.Achilli A, Sassara M, Ficili S, Pontillo D, Achilli P, Alessi C, et al. Long-term effectiveness of cardiac resynchronization therapy in patients with refractory heart failure and “narrow” QRS. J Am Coll Cardiol. 2003;42:2117–24. doi: 10.1016/j.jacc.2003.08.024. [DOI] [PubMed] [Google Scholar]
- 8.Bax JJ, Bleeker GB, Marwick TH, Molhoek SG, Boersma E, Steendijk P, et al. Left ventricular dyssynchrony predicts response and prognosis after cardiac resynchronization therapy. J Am Coll Cardiol. 2004;44:1834–40. doi: 10.1016/j.jacc.2004.08.016. [DOI] [PubMed] [Google Scholar]
- 9.Bax JJ, Marwick TH, Molhoek SG, Bleeker GB, van Erven L, Boersma E, et al. Left ventricular dyssynchrony predicts benefit of cardiac resynchronization therapy in patients with end-stage heart failure before pacemaker implantation. Am J Cardiol. 2003;92:1238–40. doi: 10.1016/j.amjcard.2003.06.016. [DOI] [PubMed] [Google Scholar]
- 10.Bax JJ, Abraham T, Barold SS, Breithardt OA, Fung JW, Garrigue S, et al. Cardiac resynchronization therapy: Part 1—Issues before device implantation. J Am Coll Cardiol. 2005;46:2153–67. doi: 10.1016/j.jacc.2005.09.019. [DOI] [PubMed] [Google Scholar]
- 11.Godoy IE, Mor-Avi V, Weinert L, Vignon P, Korcarz C, Spencer KT, et al. Use of color kinesis for evaluation of left ventricular filing in patients with dilated cardiomyopathy and mitral regurgitation. J Am Coll Cardiol. 1998;31:1598–606. doi: 10.1016/s0735-1097(98)00144-2. [DOI] [PubMed] [Google Scholar]
- 12.Suffoletto MS, Dohi K, Cannesson M, Saba S, Gorcsan J., III Novel speckle-tracking radial strain from routine black-and-white echocardiographic images to quantify dyssynchrony and predict response to cardiac resynchronization therapy. Circulation. 2006;113:960–8. doi: 10.1161/CIRCULATIONAHA.105.571455. [DOI] [PubMed] [Google Scholar]
- 13.Westenberg JJ, Lamb HJ, van der Geest RJ, Bleeker GB, Holman ER, Schalij MJ, et al. Assessment of left ventricular dyssynchrony in patients with conduction delay and idiopathic dilated cardiomyopathy: Head-to-head comparison between tissue Doppler imaging and velocity-encoded magnetic resonance imaging. J Am Coll Cardiol. 2006;47:2042–8. doi: 10.1016/j.jacc.2006.01.058. [DOI] [PubMed] [Google Scholar]
- 14.Delfino JG, Bhasin M, Cole R, Eisner RL, Merlino J, Leon AR, Oshinski JN. Comparison of myocardial velocities obtained with magnetic resonance phase velocity mapping and tissue Doppler imaging in normal subjects and patients with left ventricular dyssynchrony. J Magn Reson Imag. 2006;24:304–11. doi: 10.1002/jmri.20641. [DOI] [PubMed] [Google Scholar]
- 15.Somsen GA, Verberne HJ, Burri H, Ratib O, Righetti A. Ventricular mechanical dyssynchrony and resynchronization therapy in heart failure: A new indication for Fourier analysis of gated blood-pool radionuclide ventriculography. Nucl Med Commun. 2006;27:105–12. doi: 10.1097/01.mnm.0000195671.90911.29. [DOI] [PubMed] [Google Scholar]
- 16.Vilain D, Daou D, Casset-Senon D, Faraggi M, Le Guludec D. Optimal 3-dimensional method for right and left ventricular Fourier phase analysis in electrocardiography-gated blood-pool SPECT. J Nucl Cardiol. 2001;8:371–8. doi: 10.1067/mnc.2001.114151. [DOI] [PubMed] [Google Scholar]
- 17.Botvinick EH, O'Connell WO, Kadkade PP, Glickman SL, Dae MW, Cohen TJ, et al. Potential added value of three-dimensional reconstruction and display of single photon emission computed tomographic gated blood pool images. J Nucl Cardiol. 1998;5:245–55. doi: 10.1016/s1071-3581(98)90126-x. [DOI] [PubMed] [Google Scholar]
- 18.Chen J, Garcia EV, Folks RD, Cooke CD, Faber TL, Tauxe EL, et al. Onset of left ventricular mechanical contraction as determined by phase analysis of ECG-gated myocardial perfusion SPECT imaging: Development of a diagnostic tool for assessment of cardiac mechanical dyssynchrony. J Nucl Cardiol. 2005;12:687–95. doi: 10.1016/j.nuclcard.2005.06.088. [DOI] [PubMed] [Google Scholar]
- 19.Hoffman EJ, Huang SC, Phelps ME. Quantitation in positron emission computed tomography: 1. Effect of object size. Comput Assist Tomogr. 1979;3:299–308. doi: 10.1097/00004728-197906000-00001. [DOI] [PubMed] [Google Scholar]
- 20.Galt JR, Garcia EV, Robbins WL. Effects of myocardial wall thickness on SPECT quantification. IEEE Trans Med Imag. 1990;9:144–50. doi: 10.1109/42.56338. [DOI] [PubMed] [Google Scholar]
- 21.Cooke CD, Garcia EV, Cullom SJ, Faber TL, Pettigrew RI. Determining the accuracy of calculating systolic wall thickening using a Fast Fourier Transform approximation: A simulation study based on canine and patient data. J Nucl Med. 1994;35:1185–92. [PubMed] [Google Scholar]
- 22.Trimble MA, Borges-Neto S, Smallheiser S, Chen J, Honeycutt EF, Shaw LK, et al. Evaluation of left ventricular mechanical dyssynchrony as determined by phase analysis of ECG-gated myocardial perfusion SPECT imaging in patients with left ventricular dysfunction and conduction disturbances. J Nucl Cardiol. 2007;14:298–307. doi: 10.1016/j.nuclcard.2007.01.041. [DOI] [PubMed] [Google Scholar]
- 23.Henneman MM, Chen J, Ypenburg C, Dibbets P, Stokkel M, van der Wall EE, et al. Phase analysis of gated myocardial perfusion SPECT compared to tissue Doppler imaging for the assessment of left ventricular dyssynchrony. J Am Coll Cardiol. 2007;49:1708–14. doi: 10.1016/j.jacc.2007.01.063. [DOI] [PubMed] [Google Scholar]
- 24.Henneman MM, Chen J, Dibbets P, Stokkel M, Bleeker GB, Ypenburg C, et al. Can LV dyssynchrony as assessed with phase analysis on gated myocardial perfusion SPECT predict response to CRT? J Nucl Med. 2007;48:1104–11. doi: 10.2967/jnumed.107.039925. [DOI] [PubMed] [Google Scholar]
- 25.Segars WP, Lalush DS, Tsui BMW. A realistic spline-based dynamic heart phantom. IEEE Trans Nucl Sci. 1999;46:503–6. [Google Scholar]
- 26.Chen J, Galt JR, Valentine JD, Faber TL, Garcia EV. Modeling SPECT acquisition and processing of changing radiopharmaceutical distribution. Conf Rec, IEEE Nucl Sci Symp and Med Imag Conf; 2001. [Google Scholar]
- 27.Garcia E, DePuey EG, Sonnemaker RE, Neely HR, DePasquale EE, Robbins WL, et al. Quantification of the reversibility of stress induced SPECT thallium-201 myocardial perfusion defects: A multicenter trial using bull's-eye polar maps and standard normal limits. J Nucl Med. 1990;31:1761–5. [PubMed] [Google Scholar]
- 28.Faber TL, Cooke CD, Folks RD, Vansant JP, Nichols KJ, DePuey EG, et al. Left ventricular function and perfusion from gated SPECT perfusion images: An integrated method. J Nucl Med. 1999;40:650–9. [PubMed] [Google Scholar]