Abstract
BACKGROUND AND PURPOSE
Troglitazone (Tro), rosiglitazone (Rosi) and pioglitazone (Pio) are anti-diabetic thiazolidinediones that function as ligands for peroxisome proliferator-activated receptor γ (PPARγ); however, Tro has been withdrawn from the market due to liver toxicity issues. Mitochondrial dysfunction induced by Tro has been suggested to be an important mechanism behind its cytotoxicity. Constitutively active nuclear hormone receptors, oestrogen-related receptor α and γ are thought to regulate mitochondrial mass and oxidative phosphorylation together with their co-activators PPARγ co-activator-1α and -1β (PGC-1α and PGC-1β). Hence, in this study, we investigated whether Tro affects the expression and activity levels of these regulators.
EXPERIMENTAL APPROACH
Cellular viability was measured by an ATP-based assay. Mitochondrial mass and reactive oxygen species (ROS) were quantified by two different fluorogenic probes. Apoptosis was measured by an Annexin-V-based kit. Gene expression at the levels of mRNA and protein was measured by quantitative RT-PCR and Western analysis. Over-expression of PGC-1α was mediated by an adenovirus.
KEY RESULTS
Tro, but not Rosi or Pio, selectively stimulated PGC-1α protein degradation. As a result, Tro reduced mitochondrial mass, and superoxide dismutases 1 and 2 expressions, but induced ROS to initiate apoptosis. Using a ubiquitin–proteasome inhibitor MG132, it was established that blocking PGC-1α degradation partially suppressed the reduction of mitochondrial mass. Importantly, over-expressing PGC-1α partially restored the Tro-suppressed mitochondrial mass and attenuated the cytotoxic effects of Tro.
CONCLUSIONS AND IMPLICATIONS
Collectively, these results suggest that PGC-1α degradation is an important mechanism behind the cytotoxic effects of Tro in the liver.
Keywords: troglitazone, liver toxicity, mitochondrial mass, PGC-1α
Introduction
Troglitazone (Tro), rosiglitazone (Rosi) and pioglitazone (Pio) are anti-diabetic thiazolidinediones (TZDs) that function as ligands for peroxisome proliferator-activated receptor γ (PPARγ) (Desvergne and Wahli, 1999). TZDs bind to and enhance PPARγ activity through its C-terminally located ligand binding domain (Lehmann et al., 1995); thus, TZDs are thought to mediate their anti-diabetic effects by modulating the expression of PPARγ target genes involved in regulating metabolism (Staels and Fruchart, 2005).
Despite their demonstrated efficacies in reducing blood glucose level and enhancing insulin sensitivity in patients, the risk-to-benefit ratios of this class of compounds are still hotly debated due to a range of side effects induced by TZDs (Scheen, 2004). All three TZDs induce oedema in patients and increase their body weights (Niemeyer and Janney, 2002; Tang et al., 2003); Rosi and Pio are associated with increased risks of heart dysfunction (Home et al., 2007; Lincoff et al., 2007), and Tro has been withdrawn from the market due to liver toxicity issues (Watkins and Whitcomb, 1998). PPARγ activation in the kidney collecting duct appears to be responsible for the oedema (Zhang et al., 2005). However, although all three TZDs can activate PPARγ in the liver, only Tro induced idiosyncratic hepatotoxicity, suggesting that activation of PPARγ may not be the only mechanism responsible for Tro-induced liver toxicity.
Mitochondrial dysfunction induced by Tro has been suggested to be an important aspect behind hepatotoxicity (Masubuchi, 2006). Tro was found to decrease mitochondrial membrane potential (Δψm), and increase permeability in both rat and human isolated hepatocytes, whereas Rosi had a minimal effect (Haskins et al., 2001). The decrease in Δψm may be the result of inhibition of mitochondrial oxidative phosphorylation induced by Tro (Nadanaciva et al., 2007). This defect is associated with the generation of reactive oxygen species (ROS) (Shishido et al., 2003). As ROS is known to affect stress-activated protein kinases, Tro was demonstrated to activate apoptosis signal-regulating kinase 1 in human immortalized hepatocytes HC-04 (Lim et al., 2008). In addition, Tro activated c-Jun N-terminal protein kinase (JNK), and a JNK inhibitor partially suppressed the Tro-mediated cell death in human HepG2 hepatocarcinoma cells (Bae and Song, 2003). Importantly, Tro caused liver injury in heterozygous superoxide dismutase 2 (Sod2±) mice, suggesting that an effect on the antioxidative capacity of mitochondria constitutes part of the mechanism behind its hepatotoxicity in vivo (Ong et al., 2007).
The constitutively active nuclear hormone receptors, oestrogen-related receptor α and γ (ERRα and ERRγ), together with their co-activators, PPARγ co-activator-1α and -1β (PGC-1α and PGC-1β), are thought to regulate mitochondrial mass and oxidative phosphorylation (Giguere, 2008). Because these factors govern many important aspects of mitochondrial function (Wu et al., 1999; Kamei et al., 2003), we hypothesized that Tro may affect the expression or activity of ERRα, ERRγ, PGC-1α and PGC-1β to induce cytotoxicity. In this study, we found that Tro, but not Rosi or Pio, selectively stimulated the degradation of PGC-1α protein, leading to reductions in mitochondrial mass and the expression of superoxide dismutase 1 (SOD1) and SOD2, and the induction of ROS that then initiate apoptosis.
Methods
Cell culture and viability assay
Human hepatocarcinoma HepG2 cells were purchased from American Type Culture Collection and grown in MEM medium (Gibco, Carlsbad, CA, USA) supplemented with 10% fetal bovine serum (FBS) (HyClone, Logan, UT, USA) and 1× penicillin/streptomycin (Gibco), and maintained at 37°C and 5% CO2. For cell viability assay, cells were seeded in 96-well plates at a density of 30 000 cells per well with or without compounds added. After treatment of indicated time, viability was measured by using CellTiter-Glo Kit (Promega, Madison, WI, USA) and recorded by a VERITAS Microplate luminometer (Turner Biosystems, Sunnyvale, CA, USA).
Transfections
Transient transfections were performed using Lipofectamine 2000 (Invitrogen, Carlsbad, CA, USA) following the manufacturer's instructions. For luciferase reporter assays, cells at 85–95% confluency in 96-well plates were co-transfected with reporter plasmids (25 ng per well), Renilla luciferase (3 ng per well) as an internal control for transfection efficiency and the appropriate mammalian expression vectors (5 ng per well). Six hours after transfection, the cells were treated with drugs for 24 h. Luciferase activity was measured by using a VERITAS Microplate luminometer following the Dual-Glo Luciferase Assay System (Promega) technical manual.
Quantitative real-time PCR
Total RNA extraction, first-strand cDNA generation and quantitative real-time PCR analysis were performed as described previously (Nie and Wong, 2009). Relative gene expression was normalized to β-actin levels. Sequences of primers used are listed in Supporting Information Table S1.
Western blot analysis
Cells were lysed using RIPA reagent (Shanghai Shenneng, Shanghai, China) according to the manufacturer's protocol, and protein extracts were analysed by 10% SDS–PAGE and blotted onto PVDF membrane. Membranes were incubated with rabbit anti-ERRα, -ERRγ, -PGC-1α and -PGC-1β antibodies all generated in-house, or mouse anti-β-actin antibody (Boster, Wuhan, China) followed by horseradish peroxidase-conjugated secondary antibody (Amersham, Buckinghamshire, UK) and developed with ECL reagent (Amersham).
Mitochondrial mass assay
Mitotracker green (Invitrogen) was added and quantified as described by Chen and Wong (2009). Briefly, cells were incubated in serum-free medium (pre-warmed to 37°C) with 150 nM Mitotracker Green FM for 20 min in the dark. After being stained, the cells were washed twice with cold phosphate-buffered saline (PBS) and suspended in 200 µL PBS. Subsequently, the cells were analysed on a flow cytometer (FAC-SCalibur, BD Biosciences, San Jose, CA, USA) with excitation at 490 nm and emission at 516 nm. Data were processed by using the CellQuest program (BD Biosciences).
ROS assay
ROS production in mitochondria was measured by a cell-permeable fluorogenic probe MitoSOX Red (Invitrogen) that is selectively targeted to the mitochondria where it specifically reacts with superoxide anion. Drug-treated cells were loaded with 5 µM MitoSOX Red for 10 min at 37°C, washed with PBS, and the fluorescence was detected with a flow cytometer (FAC-SCalibur, BD Biosciences) with excitation set at 510 nm and emission at 580 nm. Data were processed by using a CellQuest program (BD Biosciences).
Assessment of apoptosis
Annexin V-PE apoptosis detection kit I (BD Biosciences) was used for quantification as described previously (Wu et al., 2009). Briefly, cells were washed twice with cold PBS and resuspended in 1× binding buffer at a concentration of 1 × 10⁶ cells mL–1, then 100 µL of the solution (1 × 10⁵ cells) was transferred to a 5 mL culture tube, and 5 µL of Annexin V-PE and 5 µL of 7-amino-actinomycin D were added. Subsequently, the cells were gently mixed and incubated for 15 min at room temperature (25°C) in the dark. Finally, the cells were suspended in 400 µL PBS for analysis using a flow cytometer (FAC-SCalibur, BD Biosciences), and data were processed by using the CellQuest program (BD Biosciences).
Adenovirus over-expressing human PGC-1α
A recombinant adenovirus encoding the human PGC-1α was prepared by transfecting a linearized pAd5vector containing 2.4 kb human PGC-1α cDNA into Trex-293 cells. Purified virus at a multiplicity of 50 was used to infect HepG2 cells in media with 2.5% FBS. For mitochondrial mass assays, 2 × 10⁵ HepG2 cells per well were plated in 24-well plates and incubated overnight before infection with the adenovirus. For cell viability assays, 2 × 10⁴ HepG2 cells per well in 96-well plates were used. For mRNA collection, 4 × 10⁵ HepG2 cells per well in six-well plates were used instead. Twenty-four hours after infection, cells were treated with dimethyl sulphoxide or 25 µM Tro for another 24 h. Adenovirus without any additions was used as a control.
Statistical analysis
All assays were performed at least three independent times. Data are presented as mean ± SD and analysed by Student's t-test or anova (Figures 2C,D, 3A,D and 5). Asterisks indicate significant differences: *P < 0.05, **P < 0.01, ***P < 0.001.
Figure 2.
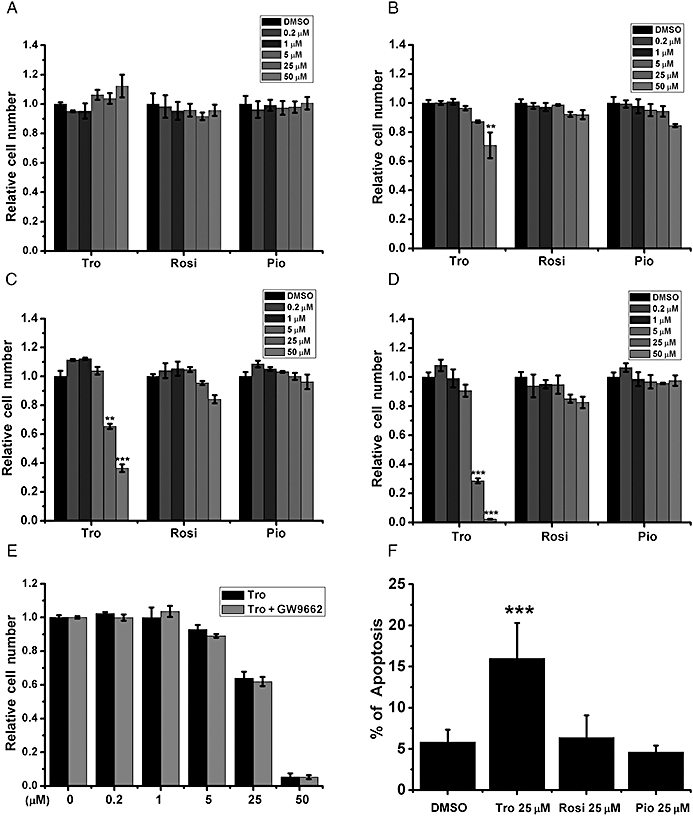
Differential effects of glitazones on cell viability and apoptosis. (A–D) HepG2 cells cultured in (A) 10%, (B) 5%, (C) 2.5% and (D) 0.5% FBS were treated with different doses of Tro, Rosi and Pio for 24 h before cell viability measurement. (E) HepG2 cells in 2.5% FBS were pretreated with 1 µM of the PPARγ antagonist GW9662 for 2 h before Tro addition. The relative viabilities were measured and expressed as in (A). (F) The % of apoptotic cells were measured after 24 h drug treatments in HepG2 cells cultured in 2.5% FBS. (A–E) The relative level under dimethyl sulphoxide treatment was set as 1. *P < 0.05, **P < 0.01, ***P < 0.001.
Figure 3.
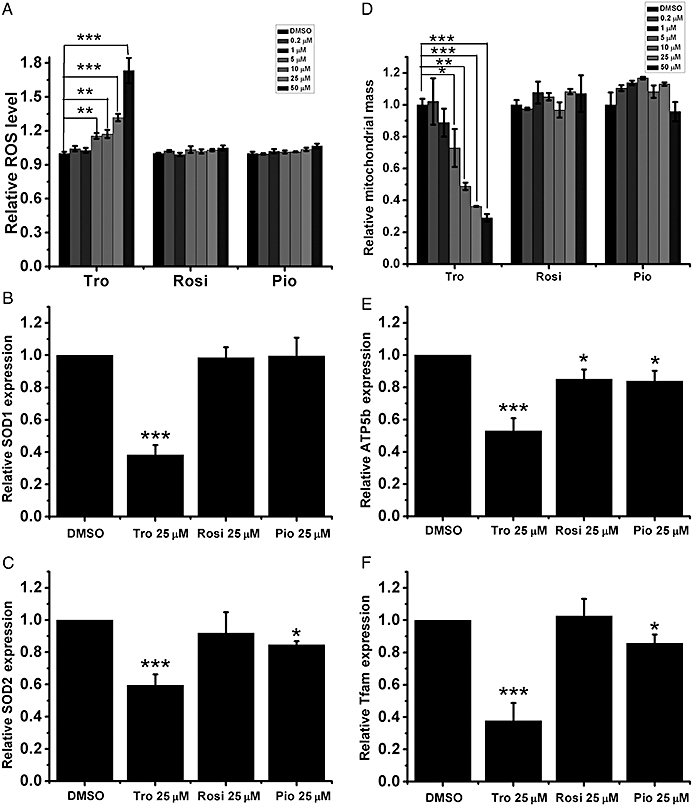
Effects of Tro on mitochondrial ROS and mass. (A) The levels of mitochondrial ROS (B–C) mRNA expression levels (B, SOD1 and C, SOD2) and (D) the amounts of mitochondrial mass were measured after the drug treatments. (E–F) mRNA expression levels of (E) ATP5b and (F) Tfam were measured as in (B). (A–F) Drug treatments for 24 h were performed in HepG2 cells cultured in 2.5% FBS. The relative level under DMSO treatment was set as 1. **P < 0.01, ***P < 0.001.
Figure 5.
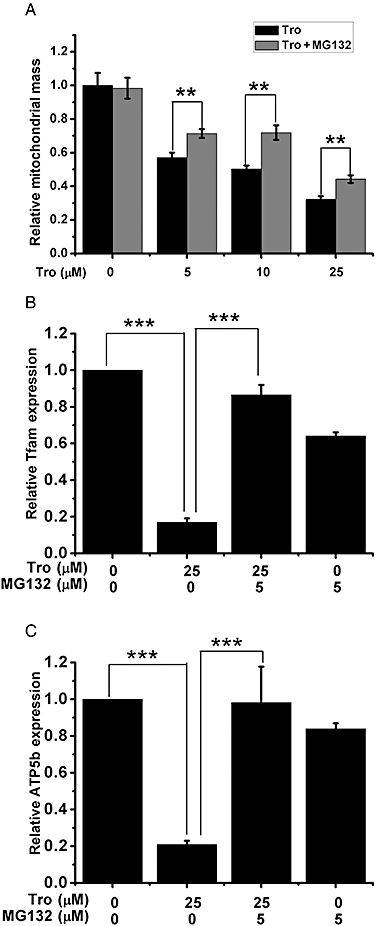
The effect of MG132 on the Tro-induced alteration in mitochondrial function. (A) The amounts of mitochondrial mass with or without 5 µM MG132 pretreatment in the presence of increasing amounts of Tro were measured. (B–C) mRNA expression levels of (B) Tfam and (C) ATP5b were measured. (A–C) Drug treatments for 24 h were performed in HepG2 cells cultured in 2.5% FBS. (B–C) The relative level under dimethyl sulphoxide treatment was set as 1. **P < 0.01, ***P < 0.001.
Plasmids and chemicals
A pGL3-luciferase reporter (Promega) with the peroxisome proliferator-activated receptor response element (PPRE) from fatty acid-binding protein 4 promoter cloned in was kindly provided by Dr Brian Lavan. Expression vectors for PPARγ1 and PPARγ2 were cloned from cDNA generated from THP-1 macrophages. An expression vector for PGC-1α has been described previously (Wang et al., 2009). Tro and GW9662 were purchased from Cayman Chemical (Ann Arbor, MI, USA), while other chemical reagents were obtained from Sigma (St. Louis, MO, USA). Drug/molecular target nomenclature conforms to the British Journal of Phamacology's Guide to Receptors and Channels (Alexander et al., 2008).
Results
Specific effects of Tro on cell viability and apoptosis
Tro, Rosi and Pio share a common methoxy-phenyl-methyl-1,3-thiazolidine-2,4-dione backbone structure with different substitutions (Figure 1A). All three glitazones enhanced the expression of a reporter luciferase driven by a PPRE in human hepatocarcinoma HepG2 cells, more specifically increasing the co-expression of the PPARγ1 isoform (Figure 1B). Consistent with the reported EC50s of these glitazones, Rosi and Pio activated PPARγ1 at concentrations as low as 0.2 µM, while Tro required higher concentrations to fully activate PPARγ1. Similar results were observed with the PPARγ2 isoform (Supporting Information Figure S1).
Figure 1.
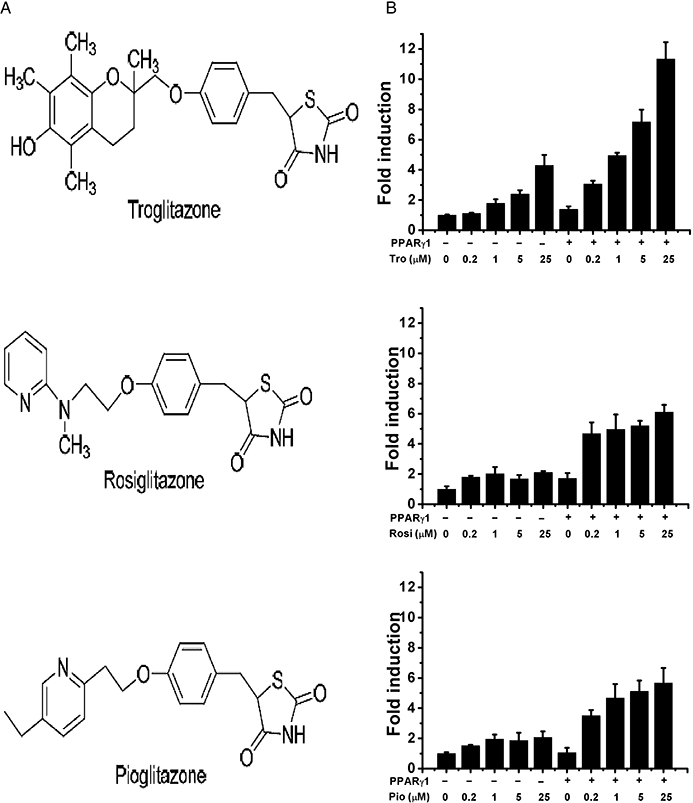
Structure–activity relationships of glitazones with PPARγ. (A) Chemical structures of Tro, Rosi and Pio. (B) HepG2 cells were transfected with expression and reporter plasmids as described in Methods. Relative activity was calculated and expressed as fold induction over that induced by dimethyl sulphoxide (vehicle control). Columns represent mean and vertical lines SD.
On the other hand, after the amount of FBS used for incubation had been reduced, only Tro dose-dependently reduced cell viability; Rosi and Pio did not significantly affect cell viability (Figure 2A–D). The reduction in cell viability mediated by Tro increased with time, whereas with Rosi and Pio viability was still preserved after a longer exposure time (Supporting Information Figure S2). In addition, this Tro-mediated reduction in cell viability was not blocked by the addition of a PPARγ antagonist GW9662 (Figure 2E). Also, Tro, but not Rosi and Pio, increased apoptosis (Figure 2F). Collectively, these data suggest that activation of PPARγ is not involved in Tro-induced cytotoxicity.
Tro elevates mitochondrial ROS level and suppresses mitochondrial mass
Tro-induced hepatotoxicity has been linked to an increase in ROS (Shishido et al., 2003). Hence, we investigated whether Tro-induced ROS is derived from the mitochondria. Using a fluorescence dye MitoSOX Red, which selectively targets the mitochondria and reacts with superoxide anion, we found that Tro dose-dependently elevated mitochondrial ROS level, but Rosi and Pio did not (Figure 3A). Next, it was found that the expression levels of SOD1 and SOD2, which are responsible for neutralizing superoxide anion, were specifically reduced by Tro (Figure 3B–C).
Because Tro reduces mitochondrial antioxidative capacity, we next determined whether Tro also affects mitochondrial mass by using another fluorescence dye MitoTracker Green that stains the mitochondria independent of Δψm. We found that Tro, but not Rosi or Pio, dose-dependently reduced mitochondrial mass (Figure 3D). Correspondingly, the expression levels of mitochondrial transcription factor A (Tfam), cytochrome C oxidase (cyt-C) and ATP synthase (ATP5b) that are involved in regulating mitochondrial mass, oxidative phosphorylation and ATP production, respectively, were specifically reduced by Tro (Figure 3E,F; Supporting Information Figure S3).
Tro selectively reduces PGC-1α protein level
Tro suppressed the mRNA expression levels of SOD1, SOD2, Tfam, cyt-C and ATP5b; ERRα, ERRγ, PGC-1α and PGC-1β are responsible for governing the expression of these genes at the transcriptional level and controlling mitochondrial mass (Giguere, 2008). Hence, we next determined whether Tro affects the expression or activity levels of these mitochondrial regulators. We found that both Rosi and Pio did not significantly affect the mRNA expression levels of ERRα, ERRγ, PGC-1α and PGC-1β (Figure 4A–D), whereas Tro moderately increased the mRNA expression levels of ERRα, ERRγ and PGC-1α (Figure 4A–C). In contrast, Western blot analysis revealed that of these three glitazones tested, only Tro specifically reduced the protein level of PGC-1α, but not ERRα, ERRγ and PGC-1β (Figure 4E), by strongly indicating that down-regulation of PGC-1α expression at the protein level is correlated to the reductions in mitochondrial mass and target gene expression mediated by Tro.
Figure 4.
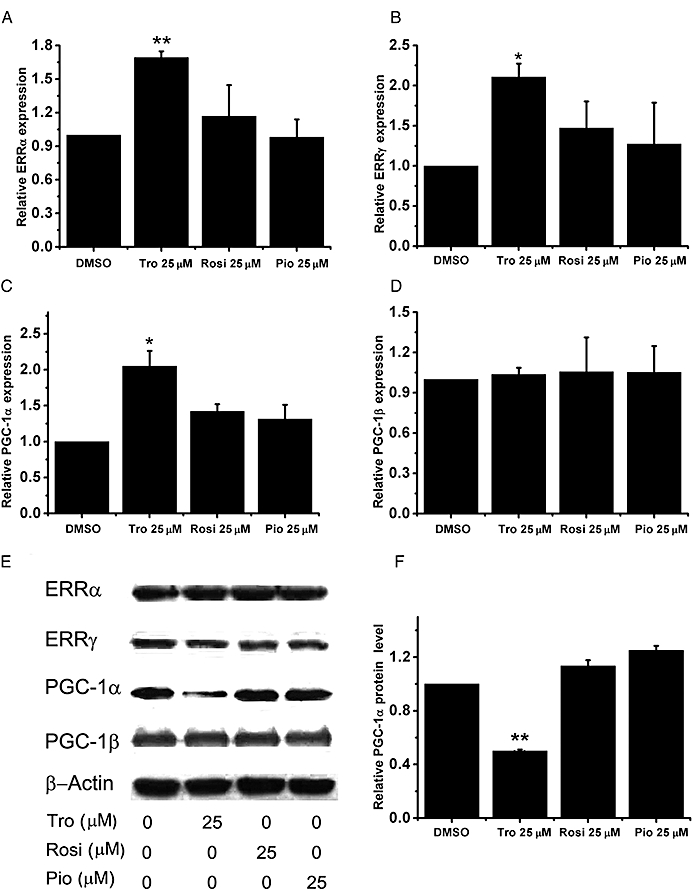
Effect of Tro on PGC-1α protein levels. (A–D) mRNA expression levels of (A) ERRα, (B) ERRγ, (C) PGC-1α and (D) PGC-1β were measured after 24 h drug treatments in HepG2 cells cultured in 2.5% FBS. The relative level under dimethyl sulphoxide (DMSO) treatment was set as 1. *P < 0.05, **P < 0.01. (E) Representative Western blots of ERRα, ERRγ, PGC-1α, PGC-1β, with β-actin as a control. (F) The reductions in PGC-1α protein level from three independent experiments were quantified against DMSO as a control.
Blocking PGC-1α degradation partially reverses the Tro-altered mitochondrial function
Because the mRNA level of PGC-1α was actually modestly increased by Tro, the reduction in the level of PGC-1α protein is probably due to a reduced translation rate and/or an enhanced protein degradation rate. The activity of PGC-1α is subjected to regulation by the ubiquitin–proteasome pathway (Sano et al., 2007). In order to establish that PGC-1α protein degradation is an important aspect of Tro-induced cytotoxicity, we used a proteosome inhibitor MG132 to suppress the activity of the ubiquitin–proteasome pathway. We found that MG132 stabilized the expression of PGC-1α (Supporting Information Figure S4); meanwhile, it partially restored the loss of mitochondrial mass (Figure 5A) and the suppressed expression levels of Tfam, cyt-C and ATP5b (Figure 5B,C; Supporting Information Figure S5). However, MG132 alone strongly increased mitochondrial ROS level (data not shown), negating our ability to analyse its effect on Tro-mediated alteration of ROS production.
Over-expression of PGC-1α partially alleviates the Tro-mediated cytotoxicity
Because MG132 blocks the degradation of not only PGC-1α, but also other proteins, we next determined whether over-expressing PGC-1α is able to restore the reduction of viability induced by Tro. We constructed an adenovirus encoding PGC-1α, and found that it effectively enhanced the protein expression level of PGC-1α compared to a control adenovirus (Supporting Information Figure S6). We found that increasing the expression of PGC-1α was able to partially restore the Tro-mediated reductions of Tfam, cyt-C and ATP5b expression (Figure 6A; data not shown) and mitochondrial mass (Figure 6B). Additionally, an increased expression of PGC-1α was effective in alleviating the Tro-suppressed cell viability (Figure 6C), strongly suggesting that a decrease in the protein level of PGC-1α through degradation is an important event behind the Tro-induced cytotoxicity.
Figure 6.
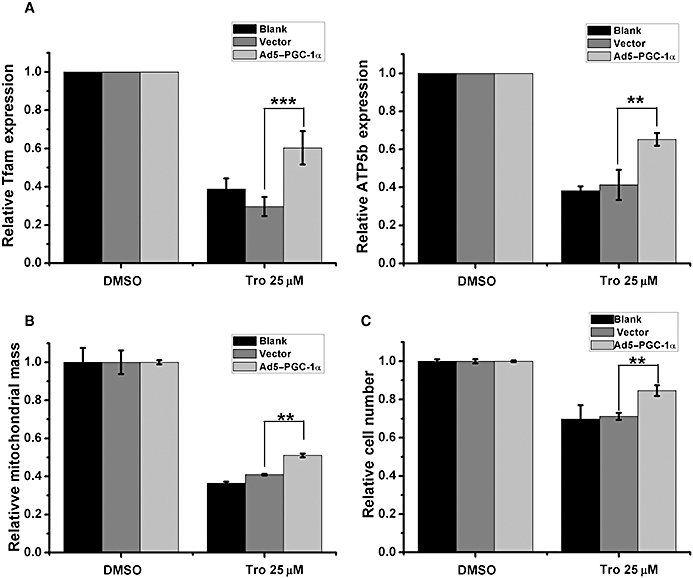
The effect of increasing the expression of PGC-1α on the reduction in cell viability induced by Tro. (A–C) HepG2 cells cultured in 2.5% FBS were mock infected (blank) or infected with either a control adenovirus (vector) or an adenovirus encoding PGC-1α (Ad5–PGC-1α) for 24 h before drug treatments for another 24 h. (A) mRNA expression levels of Tfam (left panel) and ATP5b (right panel) were measured as in Figure 5. (B) The amounts of mitochondrial mass were measured as in Figure 3. (C) Cell viabilities were measured as in Figure 2. (A–C) The relative level under dimethyl sulphoxide treatment was set as 1. *P < 0.05, **P < 0.01.
Discussion
Tro, Rosi and Pio all function well as PPARγ agonists. As members of the TZD class of drugs, these compounds were developed and marketed as anti-diabetic agents albeit target-dependent and compound-specific side effects. Significantly, Tro was withdrawn from the market due to liver toxicity issues. Tro was estimated to induce 10 liver-related deaths in one million (Plosker and Faulds, 1999). Tro treatments also inflicted less deadly, but more frequent, idiosyncratic liver injury characterized by elevations in serum alanine transaminase and aspartate transaminase levels (Plosker and Faulds, 1999).
The mechanism behind the Tro-mediated hepatotoxicity is likely to involve alterations in mitochondrial function (Masubuchi, 2006). PGC-1α serves as a transcriptional co-activator for a number of transcription factors (Handschin, 2009). In particular, PGC-1α functions with ERRα and ERRγ to guide the expression levels of mitochondrial regulators and enzymes (Giguere, 2008). In this study, we found that Tro, but not Rosi or Pio, selectively stimulated the degradation of PGC-1α protein (Figure 4). As a result, Tro reduced mitochondrial mass and induced ROS to initiate apoptosis (Figures 2 and 3). Using a ubiquitin–proteasome inhibitor MG132, we established that blocking PGC-1α degradation partially suppressed the reduction of mitochondrial mass (Figure 5). Importantly, increasing the expression of PGC-1α was partly able to reverse the Tro-induced reduction in mitochondrial mass and its effects on cell viability (Figure 6). Collectively, these results suggest that PGC-1α degradation is an important aspect behind Tro-induced liver toxicity.
Down-regulation of PGC-1α at the protein level is likely to be a primary event preceding some of the mitochondrial dysfunction previously observed with Tro. Specifically, we found that the expression levels of ATP5b, cyt-C and Tfam, which are regulated by PGC-1α with ERRα or ERRγ (Giguere, 2008), were suppressed by Tro, and that blocking PGC-1α degradation by MG132 restored their expressions (Figure 5). Suppressing the expression levels of these oxidative phosphorylation enzymes (ATP5b and cyt-C) and mitochondrial biogenesis regulator (Tfam) is likely to result in reduced oxidative phosphorylation and ability to generate ATP, which may be the main mechanisms behind the decreased Δψm and cellular ATP levels previously reported (Tirmenstein et al., 2002; Nadanaciva et al., 2007).
Although we found that Tro induced the degradation of PGC-1α protein and modestly increased its mRNA level, the mechanism leading to these effects is still not known. The modest increases in ERRα, ERRγ and PGC-1α mRNA levels (Figure 4A–C) may actually reflect a compensatory mechanism to minimize the impact of the reduction in PGC-1α protein induced by Tro (Figure 4E). Because the Tro-induced decrease in PGC-1α protein was partially blocked by the proteasome inhibitor MG132, Tro may enhance the expression level of the ubiquitin E3 ligase, SCFCdc4, which has been shown to induce the degradation of PGC-1α protein (Olson et al., 2008). Tro may also enhance the activities of glycogen synthase kinase 3β (GSK3β) and p38 MAPK; both function to enhance the degradation of PGC-1α mediated by SCFCdc4 (Olson et al., 2008). Alternatively, Tro may alter the expression levels of certain microRNAs that would target the 3′UTR of PGC-1α mRNA suppressing its translation.
Regardless of the mechanism, the Tro-mediated effects are more clearly demonstrated in HepG2 cells supplemented with relatively lower amounts of FBS (Figure 2). This serum concentration-dependent effect may reflect growth factor and/or survival signalling pathways that impact on the stability of PGC-1α protein. We speculate that reductions in growth factor and/or survival signalling pathways may contribute to the extent of Tro-induced liver toxicity in type II diabetics. Liver insulin resistance is a key aspect of type II diabetes (Leclercq et al., 2007). Insulin resistance involves down-regulation of insulin-induced phosphorylation of insulin receptor substrates (IRS1/2) that play important roles in activating phosphoinositide 3-kinase (PI3K) and its downstream kinases, including Akt (Tanti and Jager, 2009). PI3K and Akt are responsible for communicating the survival signal (Vara et al., 2004). Intriguingly, Akt can phosphorylate and suppress the activity of GSK3β (Cross et al., 1995). It is possible that suppressing the survival pathway due to insulin resistance may exacerbate the Tro-induced liver toxicity, partly by attenuating the negative regulation by Akt of GSK3β that promotes SCFCdc4-mediated PGC-1α degradation. Other physiological stresses that activate p38MAPK may further impact on the extent of liver toxicity induced by Tro by stimulating GSK3β phosphorylation of PGC-1α, leading to its degradation by SCFCdc4 (Olson et al., 2008).
Acknowledgments
We would like to thank Mr Linbing Qu for generating the adenovirus. The work was supported by grants from the National Basic Research Program of China (973-Program) [2006CB50390] and the Knowledge Innovation Program of the Chinese Academy of Sciences [KSCX2-YW-R-085].
Glossary
Abbreviations
- Δψm
mitochondrial membrane potential
- ATP5b
ATP synthase
- cyt-C
cytochrome C oxidase
- ERRγ
oestrogen-related receptor γ
- PGC-1α
peroxisome proliferator-activated receptor γ co-activator-1α
- FBS
fetal bovine serum
- JNK
c-Jun N-terminal protein kinase
- PBS
phosphate-buffered saline
- PGC-1β
peroxisome proliferator-activated receptor γ co-activator-1β
- Pio
pioglitazone
- PPARγ
peroxisome proliferator-activated receptor γ
- ERRα
oestrogen-related receptor α
- PPRE
peroxisome proliferator-activated receptor response element
- ROS
reactive oxygen species
- Rosi
rosiglitazone
- SOD1
superoxide dismutase 1
- SOD2
superoxide dismutase 2
- Tfam
mitochondrial transcription factor A
- Tro
troglitazone
- TZD
thiazolidinedione
Conflict of interest
None to disclose.
Supporting information
Additional supporting information may be found in the online version of this article.
Figure S1 Transient transfections were performed as in ‘Materials and Methods’ except for using PPARg2 expression vector. Six hours after transfection, cells were treated with drugs for 24 h. Luciferase activity was measured and the relative activity was calculated and expressed as fold induction over dimethyl sulfoxide (DMSO) as a vehicle control.
Figure S2 HepG2 cells cultured in 2.5% fetal bovine serum (FBS) were treated dose-dependently with troglitazone, rosiglitazone and pioglitazone for (a) 24, (b) 48 and (c) 72 h before cell viability measurement as in ‘Materials and Methods’. The relative level under dimethyl sulfoxide (DMSO) treatment was set as 1. *P < 0.05, **P < 0.01, ***P < 0.00.
Figure S3 The mRNA expression levels of cyt-C in HepG2 cells cultured in 2.5% FBS after drug treatments for 24 hr were measured by quantitative RT-PCR. b-actin was used as a control and the relative level under DMSO treatment was set as 1. **P < 0.01.
Figure S4 HepG2 cells cultured in 2.5% fetal bovine serum (FBS) were treated drugs indicated. Twenty-four hours after treatment, the protein level of PGC-1a and b-actin as a control were measured.
Figure S5 The mRNA expression levels of cyt-C in HepG2 cells cultured in 2.5% FBS after drug treatments for 24 h were measured by quantitative RT-PCR. b-actin was used as a control and the relative level under DMSO treatment was set as 1. ***P < 0.001.
Figure S6 HepG2 cells at 4 × 10⁵ per well in 6-well plates were plated and incubated overnight before mock infection (blank) or infections with either a control adenovirus (vector) or an adenovirus encoding PGC-1a (Ad5-PGC-1a) at a multiplicity of infection of 50. Twenty-four hours after infection, the protein levels of PGC-1a and b-actin as a control were measured.
Table S1 Sequences of primers used for RT-PCR are based on human genes and shown from 5′ to 3′
Please note: Wiley-Blackwell are not responsible for the content or functionality of any supporting materials supplied by the authors. Any queries (other than missing material) should be directed to the corresponding author for the article.
References
- Alexander SPH, Mathie A, Peters JA. Guide to Receptors and Channels (GRAC), 3rd edition. Br J Pharmacol. 2008;153:S1–S209. doi: 10.1038/sj.bjp.0707746. [DOI] [PMC free article] [PubMed] [Google Scholar]
- Bae M-A, Song BJ. Critical role of c-Jun N-terminal protein kinase activation in troglitazone-induced apoptosis of human HepG2 hepatoma cells. Mol Pharmacol. 2003;63:401–408. doi: 10.1124/mol.63.2.401. [DOI] [PubMed] [Google Scholar]
- Chen L, Wong C. Estrogen-related receptor alpha inverse agonist enhances basal glucose uptake in myotubes through reactive oxygen species. Biol Pharm Bull. 2009;32:1199–1203. doi: 10.1248/bpb.32.1199. [DOI] [PubMed] [Google Scholar]
- Cross DA, Alessi DR, Cohen P, Andjelkovich M, Hemmings BA. Inhibition of glycogen synthase kinase-3 by insulin mediated by protein kinase B. Nature. 1995;378:785–789. doi: 10.1038/378785a0. [DOI] [PubMed] [Google Scholar]
- Desvergne B, Wahli W. Peroxisome proliferator-activated receptors: nuclear control of metabolism 10.1210/er.20.5.649. Endocr Rev. 1999;20:649–688. doi: 10.1210/edrv.20.5.0380. [DOI] [PubMed] [Google Scholar]
- Giguere V. Transcriptional control of energy homeostasis by the estrogen-related receptors. Endocr Rev. 2008;29:677–696. doi: 10.1210/er.2008-0017. [DOI] [PubMed] [Google Scholar]
- Handschin C. The biology of PGC-1[alpha] and its therapeutic potential. Trends Pharmacol Sci. 2009;30:322–329. doi: 10.1016/j.tips.2009.03.006. [DOI] [PubMed] [Google Scholar]
- Haskins J, Rowse P, Rahbari R, de la Iglesia F. Thiazolidinedione toxicity to isolated hepatocytes revealed by coherent multiprobe fluorescence microscopy and correlated with multiparameter flow cytometry of peripheral leukocytes. Arch Toxicol. 2001;75:425–438. doi: 10.1007/s002040100251. [DOI] [PubMed] [Google Scholar]
- Home PD, Pocock SJ, Beck-Nielsen H, Gomis R, Hanefeld M, Jones NP, et al. Rosiglitazone evaluated for cardiovascular outcomes – an interim analysis. N Engl J Med. 2007;357:28–38. doi: 10.1056/NEJMoa073394. [DOI] [PubMed] [Google Scholar]
- Kamei Y, Ohizumi H, Fujitani Y, Nemoto T, Tanaka T, Takahashi N, et al. PPARγ coactivator 1β/ERR ligand 1 is an ERR protein ligand, whose expression induces a high-energy expenditure and antagonizes obesity. Proc Natl Acad Sci U S A. 2003;100:12378–12383. doi: 10.1073/pnas.2135217100. [DOI] [PMC free article] [PubMed] [Google Scholar]
- Leclercq IA, Da Silva Morais A, Schroyen B, Van Hul N, Geerts A. Insulin resistance in hepatocytes and sinusoidal liver cells: mechanisms and consequences. J Hepatol. 2007;47:142–156. doi: 10.1016/j.jhep.2007.04.002. [DOI] [PubMed] [Google Scholar]
- Lehmann JM, Moore LB, Smith-Oliver TA, Wilkison WO, Willson TM, Kliewer SA. An antidiabetic thiazolidinedione is a high affinity ligand for peroxisome proliferator-activated receptor γ (PPARγ) J Biol Chem. 1995;270:12953–12956. doi: 10.1074/jbc.270.22.12953. [DOI] [PubMed] [Google Scholar]
- Lim PLK, Liu J, Go ML, Boelsterli UA. The mitochondrial superoxide/thioredoxin-2/Ask1 signaling pathway is critically involved in troglitazone-induced cell injury to human hepatocytes. Toxicol Sci. 2008;101:341–349. doi: 10.1093/toxsci/kfm273. [DOI] [PubMed] [Google Scholar]
- Lincoff AM, Wolski K, Nicholls SJ, Nissen SE. Pioglitazone and risk of cardiovascular events in patients with type 2 diabetes mellitus: a meta-analysis of randomized trials. JAMA. 2007;298:1180–1188. doi: 10.1001/jama.298.10.1180. [DOI] [PubMed] [Google Scholar]
- Masubuchi Y. Metabolic and non-metabolic factors determining troglitazone hepatotoxicity: a review. Drug Metab Pharmacokinet. 2006;21:347–356. doi: 10.2133/dmpk.21.347. [DOI] [PubMed] [Google Scholar]
- Nadanaciva S, Dykens JA, Bernal A, Capaldi RA, Will Y. Mitochondrial impairment by PPAR agonists and statins identified via immunocaptured OXPHOS complex activities and respiration. Toxicol Appl Pharmacol. 2007;223:277–287. doi: 10.1016/j.taap.2007.06.003. [DOI] [PubMed] [Google Scholar]
- Nie Y, Wong C. Suppressing the activity of ERRalpha in 3T3-L1 adipocytes reduces mitochondrial biogenesis but enhances glycolysis and basal glucose uptake. J Cell Mol Med. 2009;13:3051–3060. doi: 10.1111/j.1582-4934.2008.00382.x. [DOI] [PMC free article] [PubMed] [Google Scholar]
- Niemeyer NV, Janney LM. Thiazolidinedione-induced edema. Pharmacotherapy. 2002;22:924–929. doi: 10.1592/phco.22.11.924.33626. [DOI] [PubMed] [Google Scholar]
- Olson BL, Hock MB, Ekholm-Reed S, Wohlschlegel JA, Dev KK, Kralli A, et al. SCFCdc4 acts antagonistically to the PGC-1 transcriptional coactivator by targeting it for ubiquitin-mediated proteolysis. Genes Dev. 2008;22:252–264. doi: 10.1101/gad.1624208. [DOI] [PMC free article] [PubMed] [Google Scholar]
- Ong MMK, Latchoumycandane C, Boelsterli UA. Troglitazone-induced hepatic necrosis in an animal model of silent genetic mitochondrial abnormalities. Toxicol Sci. 2007;97:205–213. doi: 10.1093/toxsci/kfl180. [DOI] [PubMed] [Google Scholar]
- Plosker GL, Faulds D. Troglitazone: a review of its use in the management of type 2 diabetes mellitus. Drugs. 1999;57:409–438. doi: 10.2165/00003495-199957030-00014. [DOI] [PubMed] [Google Scholar]
- Sano M, Tokudome S, Shimizu N, Yoshikawa N, Ogawa C, Shirakawa K, et al. Intramolecular control of protein stability, subnuclear compartmentalization, and coactivator function of peroxisome proliferator-activated receptor γ coactivator 1α. J Biol Chem. 2007;282:25970–25980. doi: 10.1074/jbc.M703634200. [DOI] [PubMed] [Google Scholar]
- Scheen AJ. Combined thiazolidinedione-insulin therapy: should we be concerned about safety? Drug Saf. 2004;27:841–856. doi: 10.2165/00002018-200427120-00002. [DOI] [PubMed] [Google Scholar]
- Shishido S, Koga H, Harada M, Kumemura H, Hanada S, Taniguchi E, et al. Hydrogen peroxide overproduction in megamitochondria of troglitazone-treated human hepatocytes. Hepatology. 2003;37:136–147. doi: 10.1053/jhep.2003.50014. [DOI] [PubMed] [Google Scholar]
- Staels B, Fruchart J-C. Therapeutic roles of peroxisome proliferator-activated receptor agonists. Diabetes. 2005;54:2460–2470. doi: 10.2337/diabetes.54.8.2460. [DOI] [PubMed] [Google Scholar]
- Tang WH, Francis GS, Hoogwerf BJ, Young JB. Fluid retention after initiation of thiazolidinedione therapy in diabetic patients with established chronic heart failure. J Am Coll Cardiol. 2003;41:1394–1398. doi: 10.1016/s0735-1097(03)00159-1. [DOI] [PubMed] [Google Scholar]
- Tanti J-F, Jager J. Cellular mechanisms of insulin resistance: role of stress-regulated serine kinases and insulin receptor substrates (IRS) serine phosphorylation. Curr Opin Pharmacol. 2009;9:753–762. doi: 10.1016/j.coph.2009.07.004. [DOI] [PubMed] [Google Scholar]
- Tirmenstein MA, Hu CX, Gales TL, Maleeff BE, Narayanan PK, Kurali E, et al. Effects of troglitazone on HepG2 viability and mitochondrial function. Toxicol Sci. 2002;69:131–138. doi: 10.1093/toxsci/69.1.131. [DOI] [PubMed] [Google Scholar]
- Vara JAF, Casado E, de Castro J, Cejas P, Belda-Iniesta C, Gonzalez-Baron M. PI3K/Akt signalling pathway and cancer. Cancer Treat Rev. 2004;30:193–204. doi: 10.1016/j.ctrv.2003.07.007. [DOI] [PubMed] [Google Scholar]
- Wang J, Fang F, Huang Z, Wang Y, Wong C. Kaempferol is an estrogen-related receptor [alpha] and [gamma] inverse agonist. FEBS Lett. 2009;583:643–647. doi: 10.1016/j.febslet.2009.01.030. [DOI] [PubMed] [Google Scholar]
- Watkins PB, Whitcomb RW. Hepatic dysfunction associated with troglitazone. N Engl J Med. 1998;338:916–917. doi: 10.1056/NEJM199803263381314. [DOI] [PubMed] [Google Scholar]
- Wu Z, Puigserver P, Andersson U, Zhang C, Adelmant G, Mootha V, et al. Mechanisms controlling mitochondrial biogenesis and respiration through the thermogenic coactivator PGC-1. Cell. 1999;98:115–124. doi: 10.1016/S0092-8674(00)80611-X. [DOI] [PubMed] [Google Scholar]
- Wu F, Wang J, Wang Y, Kwok T-T, Kong S-K, Wong C. Estrogen-related receptor [alpha] (ERR[alpha]) inverse agonist XCT-790 induces cell death in chemotherapeutic resistant cancer cells. Chemico-Biol Interacts. 2009;181:236–242. doi: 10.1016/j.cbi.2009.05.008. [DOI] [PubMed] [Google Scholar]
- Zhang H, Zhang A, Kohan DE, Nelson RD, Gonzalez FJ, Yang T. Collecting duct-specific deletion of peroxisome proliferator-activated receptor γ blocks thiazolidinedione-induced fluid retention. Proc Natl Acad Sci U S A. 2005;102:9406–9411. doi: 10.1073/pnas.0501744102. [DOI] [PMC free article] [PubMed] [Google Scholar]
Associated Data
This section collects any data citations, data availability statements, or supplementary materials included in this article.


