

RNF2, a member of polycomb group proteins, is involved in chromatin remodeling. However, mechanisms that regulate RNF2 function are unknown. To identify such mechanisms, RNF2 was expressed in HEK-293 cells and analyzed by 2D electrophoresis. RNF2 was resolved into at least seven protein spots, migrating toward the lower pI from its expected pI of 6.38, suggesting that RNF2 undergoes post-translational modifications. Western blotting indicated that majority of these RNF2 spots contained phosphoserine(s), which were completely dephosphorylated upon treatment with a phosphatase. SB203580, a specific inhibitor of p38 MAPK, inhibited RNF2 phosphorylation at one site. On the other hand, PD98059, an inhibitor of MEK1/2, inhibited majority of the phosphorylation events in RNF2. Mass spectrometry analysis identified that RNF2 expressed in Sf9 insect cells undergoes co-translational excision of 1Met coupled to N-acetylation of 2Ser, and phosphorylation of 41Ser. Interestingly, 41Ser is a predicted p38/MAPK phosphorylation site, consistent with the loss of phosphorylation induced by SB203580. Further analysis indicated that RNF2 phosphorylation differentially modulates the expression of transcription factors and histone 2B acetylation. These results provide first evidence for phosphorylation of RNF2, and suggest that the mitogen activated protein kinases including p38 MAPK and ERK1/2 regulate growth, stress response, differentiation and other cellular processes, through phosphorylation of RNF2.
Development, cell-cycle, pluripotency in stem cells, cell identity and tumorigenesis are controlled, at least in part, by epigenetic events, including DNA methylation and post-translational modifications of histones. Some of these epigenetic modifications are carried out by polycomb group (PcG) proteins, which are evolutionarily conserved transcriptional repressor protein complexes recruited to the specific DNA sequences through recognition of modified histones [1]. PcG proteins were initially discovered as transcriptional regulators involved in the maintenance of homeobox gene silencing during development of D.melanogaster. PcG proteins exist as at least two major multiprotein complexes, termed Polycomb repressor complex (PRC) 1 and PRC 2 [2, 3]. While the exact compositions of these complexes are unclear at present, analysis of D.melanogaster [3] and mammalian [4] PRC1 complexes indicated that it contains the core components of Polycomb (Pc), posterior sex combs (Psc), polyhomeotic (Ph) and dRing1. There are two or more homologs of each of these core proteins in human and other higher organisms. For instance, the Ring1A and RNF2 (also known as Ring1B) are the human homologs of RING finger containing dRing1 of D. melanogaster, and Bmi-1 and Mel-18 are that of Psc. Importantly, current biochemical evidence points out to the abnormal expression of PcG proteins in many human cancers, implicating a regulatory role for these conserved proteins in malignant transformation as well. Bmi1 and Mel-18 have been shown to display overlapping functions in the activation of oncogenic pathways leading to carcinogenesis [5]. Bmi-1 is overexpressed in medulloblastoma, lung, breast cancers, and invading front of breast tumors [6–8] and has been found to function cooperatively with c-myc in the lymphomagenesis, by repressing the p16INK4A that codes for CDK4/6 inhibitor [9]. Consistent with this notion, overexpression of Bmi-1 has been shown to downregulate the expression of both the p16 and p19ARF transcripts of the INK4A locus [9].
The PRC2 comprising EED, Ezh1 and Ezh2 is a histone methyltransferase complex, which trimethylates 27Lys residue of histone H3 [2]. An interesting functional co-operation between the PRC1 and PRC2, mediates this post-translational event. This mechanism indicates that the chromatin regions containing histone H3 that was trimethylated by PRC2 form the docking sites for PRC1. The PRC1 binding then prevents chromatin from being remodeled by ATP-dependent remodeling factors, leading to inhibition of transcription [10]. RNF2 is a 336-amino acid protein containing a unique C3HC4 RING finger motif spanning the amino acids 40–90. Wang, et al [11] have isolated a core complex containing Ring1A and RNF2 from HeLa cells and shown it as an E3 ubiquitin ligase complex, which mono-ubiquitinates 119Lys of histone H2A. Deletion of RNF2 has led to the loss of histone 2A ubiquitination, establishing that RNF2 is an E3 ubiquitin ligase [12]. Cao, et al [13] have demonstrated that this ubiquitin ligase activity is strongly stimulated by Bmi-1, suggesting that Bmi-1 is a regulator of the ubiquitin E3 ligase activity. Recently, Li et al [14] have determined the structure of RNF2-Bmi-1 complex using proteins expressed in Sf9 insect cells and showed that RNF2 interacts with Bmi-1 through its RING domain, while its N-terminal tail wraps around Bmi-1, suggesting the requirement of such subunit interactions for efficient E3 ubiquitin ligase activity. Significantly, this study pointed out that the entire N-terminal region spanning up to the end of the RING finger domain in RNF2 is important for its function.
Here we report novel observations that RNF2 undergoes post-translational modifications, which include phosphorylation mediated by both the p38 MAPK and ERK1/2 signaling pathways. These data imply that the transcriptional repression function of PcG proteins is regulated by growth factors, mitogens, environmental stresses and inflammatory cytokines, depending on the cellular context.
MATERIALS AND METHODS
Materials
Anti-phosphoserine, anti-phosphotyrosine, anti-phosphothreonine and anti-acetyllysine antibodies, proteomics grade trypsin and PD98059 were obtained from Sigma. Antibodies to p15, β-catenin, p65 and acetyl histone H2B were obtained from Cell Signaling, MA. Anti-c-Myc was obtained from Santa Cruz Biotechnology, CA. Anti-RNF2 antibody was raised in our laboratory, which has been described previously [15]. Precast immobilized pH gradient (IPG) strips with a linear pH 3–10 gradient were obtained from Bio-Rad. SDS-PAGE and western blotting reagents were purchased from Bio-Rad. SB203580 was obtained from Calbiochem CA. Lambda protein phosphatase was purchased from New England Biolabs. All other reagents used were of analytical grade.
RNF2 expression
HEK-293 cells were maintained in DMEM medium, supplemented with 10% (v/v) fetal bovine serum and antibiotics (penicillin, 100 units/ml, and streptomycin, 100 µg/ml) and grown in a 37 °C humidified incubator with 5% CO2. To express RNF2, approximately 1×10⁶ cells were seeded in each well of a 6-well plate and transfected with either the pCMV6-XL6 vector (plasmid control) or the wild-type RNF2 cDNA carrying pCMV6-XL6 vector (RNF2 plasmid), using Lipofectamine-2000 reagent (Invitrogen, CA) as recommended by the manufacturer. Expression of RNF2 was analyzed 24 h post transfection by western blotting. In some experiments, transfected cells were transferred to DMEM containing 0.02% serum 4 hr prior to the addition of either 20 µM SB203580 or 50 µM PD98059. Incubation was continued for another 2 h and the total cellular protein was collected after precipitation with 6% trichloroacetic acid (TCA).
Expression of recombinant RNF2 containing 6-His tag at its C-terminus termed RNF2-6His was expressed in Sf9 insect cells via recombinant baculovirus, as described previously [15].
Preparation of RNF2 for isoelectric focusing
The TCA precipitates of HEK-293 cells prepared as above were washed twice with 80% (v/v) acetone, air dried and then dissolved in one dimensional (1D) isoelectric focusing (IEF) buffer (7 M urea, 2 M thiourea, 0.2% pH 3–10 ampholytes, 3% CHAPS, 1% NP-40 and 1% DTT, 10% glycerol prepared in water) for 1 h at room temperature. The extracts were then centrifuged at 100,000 ×g at 25 °C for 15 min, and the supernatants obtained from each transfection were separated by 2D electrophoresis as described below.
Twenty million Sf9 insect cells infected with the recombinant baculovirus carrying RNF2-6His were washed once in PBS and then lysed in 1 ml of lysis buffer (50 mM NaH2PO4 pH 8.0 containing 0.2 mM DTT, 0.1% NP40, 0.1% Triton-X100, 25 mM NaF, 5 mM sodium orthovanadate and 1X protease inhibitor cocktail) on ice for 15 min with gentle intermittent pipetting. The solubilized cell extracts were centrifuged at 100,000 ×g for 30 min and the supernatants were supplemented with 300 mM NaCl. RNF2-6His present in the supernatants was purified by using Ni-NTA agarose beads, as recommended by the manufacturer (Qiagen, CA). RNF2-6His-bound agarose beads were washed 3 times with the wash buffer (50 mM NaH2PO4, 300 mM NaCl and 20 mM imidazole, pH 8.0,), deionized water and then RNF2 was extracted into minimal volume of 1D IEF buffer for the separation by 1D electrophoresis.
Treatment of purified RNF2 with lambda phosphatase
Ni-NTA agarose beads bound to RNF2 were washed twice and resuspended in the phosphatase reaction buffer (50mM Tris, 100 mM NaCl, 2 mM DTT, 0.1 mM EGTA, 2 mM MnCl2 and 0.1% Brij, pH 7.5). The bead suspension was supplemented with lambda protein phosphatase (1200 U/0.1 ml reaction mixture) and incubated at 30 °C for 16 h. As controls, reactions were carried out without phosphatase. Beads were washed in deionized water several times and RNF2 was extracted in 1D IEF buffer for the separation by 1D electrophoresis.
2D electrophoresis of RNF2 and western blotting
RNF2 resuspended in 1D IEF buffer as described above was loaded onto the entire lengths of 7 cm IPG strips and subjected to isoelectric focusing using the Protean IEF Cell apparatus (Bio-Rad, CA). The IPG strip re-hydration was carried out for 12 h at 50V followed by isoelectric focusing for 10,000 Vh. Proteins in the IPG strips were reduced and alkylated by sequentially incubating the strips in a buffer (375 mM Tris-HCl, pH 8.5, 6M Urea, 2% SDS, 20% glycerol) containing 1% DTT for 15 min followed by incubation in the same buffer containing 2.5% iodoacetamide for 15 min. These IPG strips were loaded on the top of 4.5% acrylamide polymerized on 8% acrylamide separating gels and electrophoresed at 60 V for 10 min and then 120 V till the completion of run. Standard western blotting procedure was used in the detection of RNF2 and post-translational modification using specific primary antibodies in conjunction with appropriate horseradish peroxidase-coupled secondary antibodies and the enhanced chemiluminescence assay kit (Pierce), as described previously [15].
Mass spectrometric analysis
The RNF2-bound agarose beads prepared as above were washed and then resuspended in wash buffer (50 mM NaH2PO4, 300 mM NaCl and 20 mM imidazole, pH 8.0,) containing 1 mM DTT for 10 min at room temperature. The beads were collected after a brief centrifugation and then incubated in the above wash buffer containing 10 mM iodoacetamide for 30 min under subdued light. The beads were washed thrice in the wash buffer and the bound RNF2 was eluted in elution buffer (50 mM NaH2PO4, 300 mM NaCl and 250 mM imidazole, pH 8.0), and the protein was precipitated with ice cold acetone made to 80% (v/v). The dried protein precipitate was dissolved in 50 mM NH4HCO3 and digested with trypsin (20 ng/µl) at 37 °C for 18 h. The peptides released into the solution were collected by brief centrifugation and dried. The peptide mixture was desalted and enriched using solid phase extraction (SPE) on Sep-Pak® Cartridges (Waters, Milford, MA). Briefly, the digested sample was dried and reconstituted in 0.1% TFA and loaded on SPE cartridges equilibrated with 0.1% TFA. After washing, the tryptic peptides were eluted in 1 mL of 70% ACN-0.1%TFA. The eluted peptides were dried and reconstituted in 2% ACN-0.5% TFA for subsequent nanoLC-MS/MS analysis. The nanoLC was carried out by an LC Packings Ultimate integrated capillary HPLC system equipped with a Switchos valve switching unit (Dionex, Sunnyvale, CA). The tryptic peptides (6.4 µL) were injected using a Famous auto sampler onto a C18 µ-precolumn cartridge (5 µm, 300 µm × 5 mm, Dionex) for on-line desalting and then separated on a PepMap C-18 RP nano column (3 µm, 75 µm × 5 mm, Dionex), eluted in a 60-minute gradient of 5% to 45% acetonitrile in 0.1% formic acid at 250 nL/min. The nanoLC was connected in-line to a hybrid triple quadrupole linear ion trap mass spectrometer, 4000 Q Trap from ABI/MDS Sciex (Framingham, MA) equipped with Micro Ion Spray Head II ion source. The data acquisition on the MS was performed using Analyst 1.4.2 software (Applied Biosystems) in the positive ion mode for information dependant acquisition (IDA) analysis. The nanospray voltage used for all experiments was + 1.85 kV and nitrogen was used as the curtain (value of 10) and collision gas (set to high) with the heated interface at 150 °C. The declustering potential was set at 50 eV and Gas1 was 15 (arbitrary unit). In IDA, after each survey scan for m/z 400 to m/z 1550 and an enhanced resolution scan, the three highest intensity ions with multiple charge states were selected for tandem MS (MS/MS) with rolling collision energy applied for detected ions based on different charge states and m/z values. The MS/MS data generated from IDA analysis were submitted to Mascot 2.2 for database searching using in-house licensed Mascot local server and the search was performed to query to NCBInr database (taxonomy: Human) with one missed cleavage site by trypsin allowed. The peptide tolerance was set to 1.5 Da and MS/MS tolerance was set to 0.6 Da. Carbamidomethyl modification of cysteine, a Met oxidation and phosphorylation of serine/threonine were set as variable modifications. Only significant scores for the peptides defined by Mascot probability analysis (www.matrixscience.com/help/scoring_help.html#PBM) greater than “identity” were considered for the peptide identification and phosphorylation site determinations.
To validate the result acquired by IDA analysis, the tryptic digest was then subjected to precursor ion scanning operating in a negative ion mode to selectively detect the precursor ions that give rise to the diagnostic fragment ions (m/z 79) followed by polarity switch to positive ion mode for IDA analysis as reported previously [16]. Precursor ion scanning was performed over a mass range of m/z 400–1400 at 500 amu/s (with Q1 set to low resolution and Q3 set to unit resolution) with an ion spray voltage of −1700 V. Precursors were collided in Q2 with a collision energy ramp of −65 to −90 V across the mass range. A preset threshold of precursor of 79 is 1000 counts/s for automatic trigging positive IDA analysis as described above.
Experiments
Each of the experiments presented in this paper was carried out at least four different times using protein samples obtained from different batches of cells, with essentially identical results.
RESULTS
RNF2 is a phosphoprotein
Expression of the human RNF2 in HEK-293 cells was examined by western blotting, and the results are shown in Fig.1A. HEK-293 cells were transfected with RNF2 plasmid and the cell lysates prepared 24 h post transfection were separated on SDS-PAGE gels, electrotransferred onto polyvinylidine difluoride membranes, and then probed with the RNF2-specific anti-RNF2 antibody. A single band of ~39 kDa was visible in cell lysates obtained from HEK-293 cells transfected with RNF2 plasmid. No detectable anti-RNF2 antibody-reactive proteins were found in any of the several control HEK-293 cell lysates used in this study. Thus, these observations suggested that HEK-293 cells do not express RNF2 endogenously in sufficient quantities to be detectable by the anti-RNF2 antibody and produce RNF2 upon transfection with the RNF2 plasmid. Although these data establish that RNF2 plasmid allows the expression of wild-type RNF2, the molecular mass of the expressed protein was slightly higher than the calculated mass of ~37 kDa, raising the distinct possibility that RNF2 undergoes post-translational modifications.
Figure 1. Analysis of RNF2 expression in HEK-293 cells.
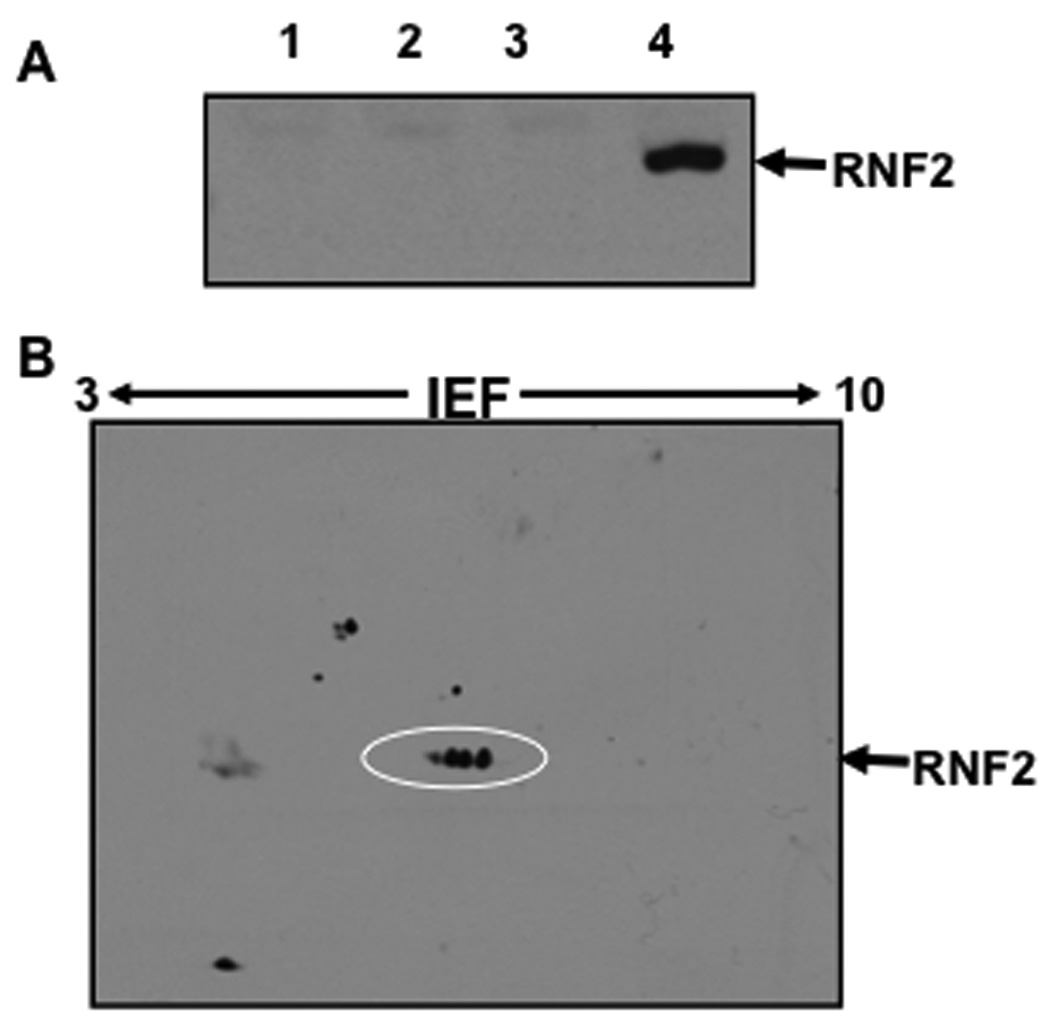
A. Western blotting analysis. HEK-293 cells were transfected with Lipofectamine alone (Lane 2), plasmid control (Lane 3), RNF2 plasmid (Lane 4) and the lysates were analyzed by western blotting using anti-RNF2 antibody as described under Materials and Methods. Lysate from the untransfected cells was loaded in Lane 1. The anti-RNF2 immunoreactive protein band seen in Lane 4 migrated with a molecular mass of ~39 kDa is RNF2.
B. Two dimensional electrophoresis and western blotting of RNF2. RNF2 was transiently expressed in HEK-293 cells and the total cellular protein was separated on pH 3–10 IEF strip followed by SDS-PAGE. Proteins from the PAGE were analyzed by western blotting as described under Materials and Methods. RNF2 was resolved into several protein spots, which are highlighted with a circle. Other protein spots in the blot appear unrelated to RNF2, as these migrated with molecular masses different from that of intact RNF2 molecule.
To further characterize the increased molecular mass, RNF2 expressed in HEK-293 cells was resolved by 2D electrophoresis followed by western blotting, and the results are shown in Fig.1B. HEK-293 cells transfected with RNF2 plasmid were lysed and the lysates were loaded on the entire length of the pH 3–10 IPG strips as described under Materials and Methods. The 2D electrophoresis followed by western blotting using anti-RNF2 revealed that RNF2 resolves into a trail of many spots migrating down from its expected pI of 6.38 (www.expasy.org/pI_tools.html) to lower pI values. Slightly extended exposure of the blot to the X-ray film indicated the presence of at least seven RNF2 spots. To rule out the possibility that the protein spots resulted from the artifacts introduced by detergents used in the 1D electrophoresis, the NP-40 in the IEF buffer was replaced with another detergent such as SDS, triton-X100 or CHAPS. RNF2 however was separated into similar trail of several spots, irrespective of the detergent used in the 1D electrophoresis (data not shown). Thus, the separation of RNF2 into multiple protein species with decreasing pI suggested that RNF2 undergoes covalent modifications.
To determine if phosphorylation is the cause for the resolution of RNF2 into multiple species, RNF2 expressed in Sf9 insect cells was used, as the protein level expressed was higher in this experimental system. Presence of 6-His tag slightly increased the pI value of RNF2 from 6.38 to 6.6, as determined by predictive algorithms (www.expasy.org/pI_tools.html). The recombinant RNF2-6His was purified from Sf9 insect cells by metal-chelation affinity chromatography and separated by 2D electrophoresis followed by western blotting, and the results are shown in Fig.2A. RNF2-6His was resolved into several protein spots, an observation much similar to that of RNF2 expressed in HEK-293 cells, suggesting that RNF2 is subjected to protein modifications in this expression system as well. Multiple western blots were developed using anti-phosphoserine, anti-phosphothreonine, and anti-phosphotyrosine antibodies, which were reprobed with anti-RNF2 to identify the location of RNF2; these analyses showed that RNF2 was not immunoreactive with either anti-phosphothreonine or anti-phosphotyrosine (data not shown), suggesting the absence of phosphorylation of threonine or tyrosine residues in the RNF2 molecule. In addition, RNF2 on the 2D blots did not immunostain with anti-acetyllysine antibody, suggesting the absence of lysine acetylations. However, Fig.2B shows that at least three of the RNF2 protein spots were immunoreactive with anti-phosphoserine, suggesting that RNF2 was phosphorylated at Ser residues. The other proteins in the western blots, which are immunoreactive with anti-phosphoserine antibody, were co-purified with RNF2. Fig.2C shows that prior treatment of the purified RNF2 with lambda protein phosphatase resulted in the loss of anti-phosphoserine staining of RNF2, corroborating the results of the anti-phosphoserine immunostaining. Finally, a western blot developed using anti-RNF2 showed that dephosphorylation resulted in the loss of some RNF2 spots, leaving three prominent spots (Fig.2D). As one of these spots is expected to be an unmodified RNF2, the remaining two RNF2 spots contained post-translational modifications, which are unclear at present. Together, evidence from these different approaches clearly shows that RNF2 is a phosphoprotein, phosphorylated at multiple Ser residues.
Figure 2. Analysis of phosphorylation of RNF2.
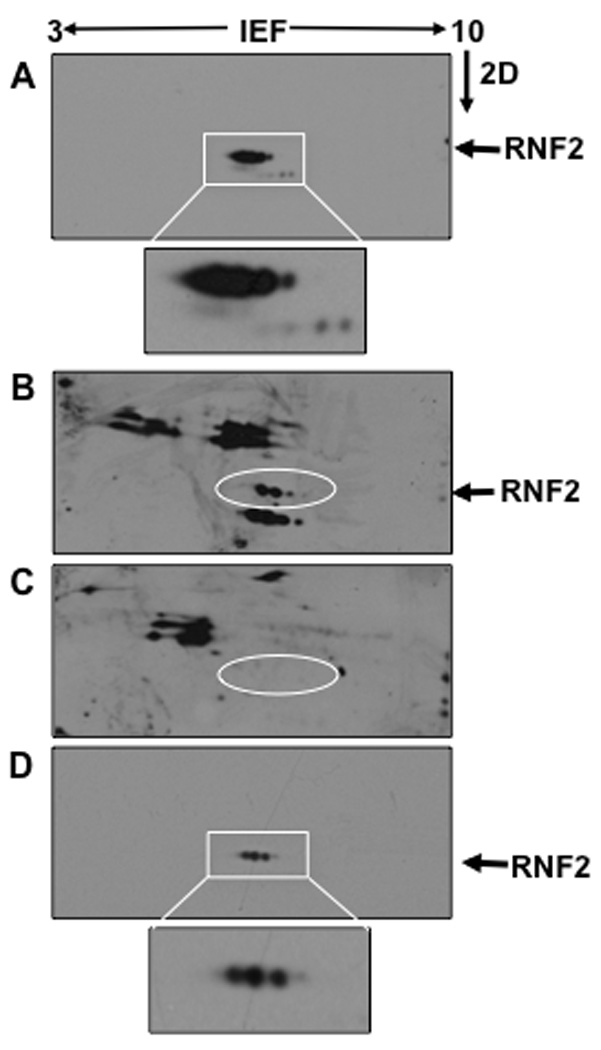
RNF2-6His was expressed in Sf9 insect cells and purified by Ni-NTA agarose beads. A. RNF2-6His was eluted from the beads and separated by isoelectric focusing (IEF) using pH3–10 IEF strips and separated by SDS-PAGE in the second dimension (2D). Proteins thus separated were transferred onto PVDF membranes followed by western blotting using anti-RNF2 antibody. RNF2-6His was resolved into multiple protein spots all of which migrated as ~39 kDa proteins. Boxed region was enlarged to show details of RNF2 spots, which was inserted below the Panel. B. An identical blot of the Panel A was developed with anti-phosphoserine antibody. RNF2-6His protein spots were shown in the circle. C. RNF2-6His eluted from the beads was dephosphorylated with protein phosphatase and then separated by 2D followed by western blotting using anti-phosphoserine antibody. The position of RNF2-6His in this blot was identified with a circle. D. The dephosphorylated RNF2 separated by 2D electrophoresis was analyzed by western blotting using anti-RNF2. Boxed region was enlarged to show details of RNF2 spots, which was inserted below the Panel.
SB203580 and PD98059 inhibit phosphorylation in RNF2
We tested the possibility that RNF2 is a target for phosphorylation by the mitogenic signaling pathways, as over-expression of PcG proteins are known to promote tumorigenesis. HEK-293 cells transfected with RNF2 plasmid were treated with SB203580 [17], an inhibitor of p38 MAPK, and PD98059 [18], an inhibitor of MEK1/2, as described under Materials and Methods and then analyzed by 2D electrophoresis followed by western blotting using anti-RNF2. The results were shown in Fig.3. As seen in Fig.1A, HEK-293 cells do not contain endogenous RNF2 (Fig.3A), thus making it a suitable experimental model for studying the biochemical properties of ectopic RNF2. RNF2 expressed after transient transfection resolved into seven distinct protein spots, which were, for convenience, numbered from one to seven, as indicated in Fig.3B. RNF2 spot 7 corresponded to the unmodified RNF2, as it was concentrated at pI of 6.4, which is close to the expected value of 6.38. Fig.3C shows that treatment of transfected cells with SB203580 resulted in the loss of the minor RNF2 spot 4 (Fig.3C), suggesting that this protein spot was phosphorylated likely by the p38 MAP kinase. On the other hand, treatment of transfected cells with PD98059 resulted in the loss of the major RNF2 spots 1–4 (Fig.3D), suggesting that ERK signaling pathway is involved in the multi-site phosphorylation of RNF2. Finally, the presence of RNF2 spot 6 in these immunoblots even after treatment with the above inhibitors suggested that RNF2 undergoes modification by other unknown kinases or posttranslational events, accounting for the observed pI shift. The fact that RNF2 spot 4 was not phosphorylated in the presence of either SB203580 or PD98059, suggested that both p38 MAPK and ERK pathways are likely to contribute to the modification of this site.
Figure 3. Analysis of the effects of SB203580 and PD98059 on RNF2.
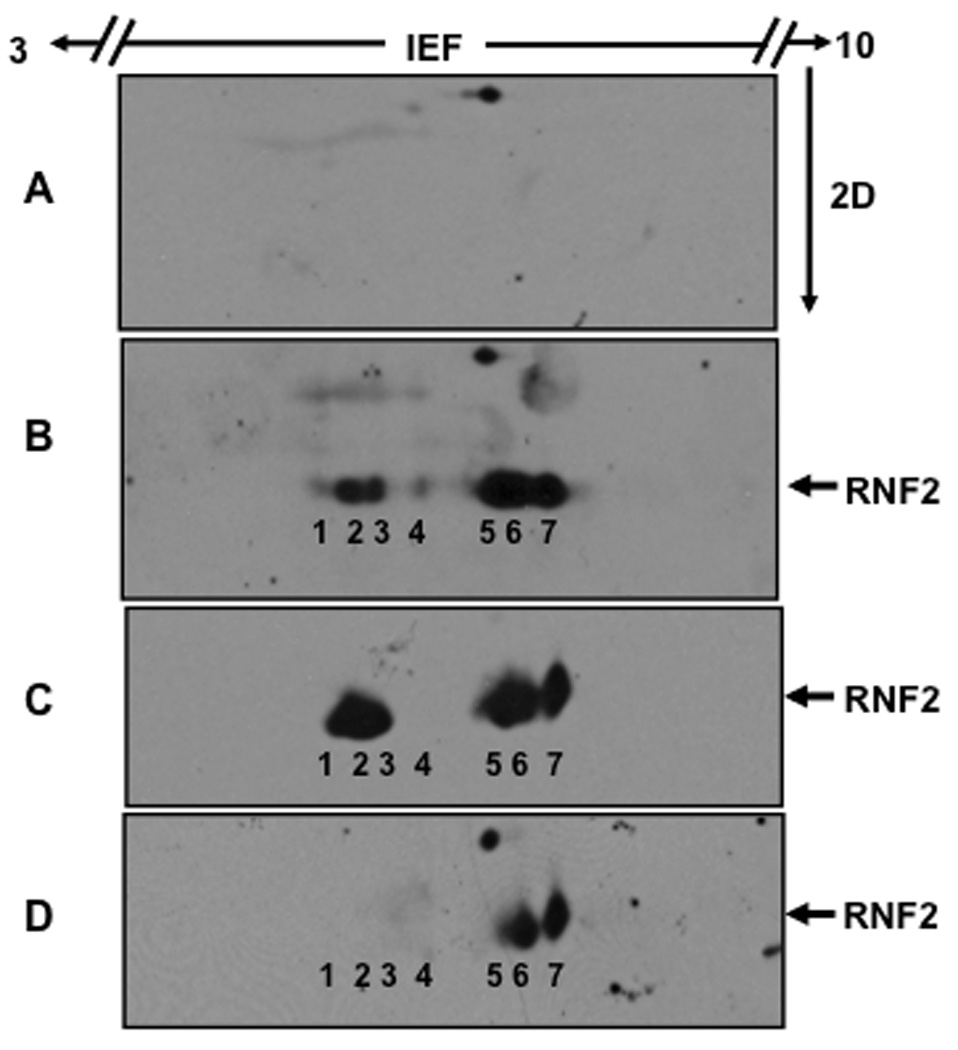
A. Total protein extracts from plasmid control transfected HEK-293 cells were analyzed by 2D electrophoresis followed by western blotting using anti-RNF2 antibody as described under Materials and Methods. The region of the western blot in which RNF2 migrates was shown here. B. RNF2 was expressed transiently in HEK-293 cells and analyzed by 2D electrophoresis followed by western blotting using anti-RNF2. RNF2 was resolved into 7 protein spots, which are numbered for convenience. C. HEK-293 cells expressing RNF2 were treated with 20 µM SB203580 and then analyzed by 2D electrophoresis followed by western blotting using anti-RNF2. D. HEK-293 cells expressing RNF2 were treated with 50 µM PD98059 and then analyzed by 2D electrophoresis followed by western blotting using anti-RNF2.
RNF2 is phosphorylated at 41Ser residue
Since the amount of RNF2 expressed in HEK-293 cells was low for the authentic identification of phosphorylated residues, RNF2-6His expressed in Sf9 insect cells was used. The purified RNF2-6His was digested with trypsin. The tryptic digests were analyzed by nanoLC-MS/MS using a hybrid triple quadrupole linear ion trap mass spectrometer followed by Mascot-based database searching for identifications as described under Material and Methods. The MS/MS results identified 10 distinct proteins with multiple-peptides hit with RNF2 being a top hit with sequence coverage of 78%. All of the peptides identified for RNF2 protein are listed in Table 1. Among the peptides identified for RNF2 by nanoLC-MS/MS were doubly charged species at m/z 913.03 and m/z 952.92, and triply charged species at m/z 609.03 and m/z 635.75 that differed by about 80 amu (the mass of phosphate), corresponding to the native peptide 28-TPQEAITDGLEVVSPR-43, and its single phosphorylated counterpart 28-TPQEAITDGLEVVpSPR-43. The MS/MS spectra for native 28-TPQEAITDGLEVVSPR peptide and its phosphorylated counterpart at 41Ser were shown in Fig. 4A and Fig. 4B respectively. To confirm the above result, the digest was also subjected to precursor ion scanning operating in a negative ion mode to selectively detect the precursor ions that give rise to the diagnostic fragment ions (m/z 79) followed by polarity switch to positive ion mode for IDA analysis, the same peptide with its 41Ser monophosphorylated derivative was the only phosphopeptide detected with decent MS/MS spectra (data not shown). 41Ser was consistently found as a phospho residue in all of our four different RNF2 preparations. Fig. 5 shows the estimated relative abundance of the phosphopeptide and unphosphorylated peptide ions at two different charged states (doubly charged and triply charged ions) based on the peak areas of the extracted ion profiles from the nanoLC/MS/MS analysis. The extracted ion profile shows the elution peak for the specifically selected m/z ion and therefore can be used for integration of peak areas reflecting the estimated abundance of the selected ions under assumption that the ionization efficiency of both native peptide and its phosphorylated counterpart is similar. Based on this quantification, ~6.5% of the RNF2 is singly phosphorylated at41Ser.
Table 1.
List of tryptic peptides obtained from RNF2 and their modifications identified by nanoLC-MS/MS analysis.
| Peptide # | Location in RNF2 |
Missed cleavage |
Amino acid sequence | Theoretical Mass (mono) |
Observed m/z | Charges | Experimental Mass |
Delta | Modified residue |
Mascot score |
|---|---|---|---|---|---|---|---|---|---|---|
| T1 | 2 – 15 | 0 | acetyl-SQAVQTNGTQPLSK | 1499.758 | 750.930 | 2 | 1499.860 | 0.102 | S2 | 61 |
| T1 | 2 – 15 | 0 | acetyl-SQAVQTDGTQPLSK | 1500.617 | 751.342 | 2 | 1500.684 | 0.067 | S2, N7 | 82 |
| T2 | 16 – 26 | 0 | TWELSLYELQR | 1436.730 | 719.381 | 2 | 1436.762 | 0.032 | 58 | |
| T3 | 27 – 43 | 0 | TPQEAITDGLEIVVSPR | 1823.963 | 913.026 | 2 | 1824.052 | 0.089 | 82 | |
| T3 | 27 – 43 | 0 | TPQEAITDGLEIVVSPR | 1823.963 | 609.031 | 3 | 1824.093 | 0.130 | 61 | |
| T3 | 27 – 43 | 0 | TPQEAITDGLEIVVphosSPR | 1903.929 | 952.918 | 2 | 1903.836 | −0.093 | S41 | 91 |
| T3 | 27 – 43 | 0 | TPQEAITDGLEIVVphosSPR | 1903.929 | 635.757 | 3 | 1904.271 | 0.342 | S41 | 52 |
| T4 | 44 – 59 | 0 | SLHSELMCPICLDMLK | 1945.913 | 649.683 | 3 | 1946.049 | 0.064 | 58 | |
| T7 | 71 – 81 | 0 | FCADCIITALR | 1338.642 | 670.368 | 2 | 1338.736 | 0.096 | 69 | |
| T8/T9 | 82 – 91 | 1 | SGNKECPTCR | 1207.507 | 604.793 | 2 | 1207.586 | 0.079 | 53 | |
| T13/T14 | 98 – 112 | 1 | RSLRPDPNFDALISK | 1727.932 | 577.029 | 3 | 1728.027 | 0.095 | 57 | |
| T14 | 99 – 112 | 0 | SLRPDPNFDALISK | 1571.831 | 786.972 | 2 | 1571.944 | 0.113 | 60 | |
| T15/T16 | 113 – 126 | 1 | IYPSRDEYEAHQER | 1791.818 | 896.914 | 2 | 1791.828 | 0.01 | 59 | |
| T16 | 118 – 126 | 0 | DEYEAHQER | 1175.484 | 588.782 | 2 | 1175.564 | 0.08 | 44 | |
| T18/T19 | 131 – 149 | 1 | INKHNNQQALSHSIEEGLK | 2159.108 | 720.780 | 3 | 2159.340 | 0.232 | 53 | |
| T19 | 134 – 149 | 0 | HNNQQALSHSIEEGLK | 1803.886 | 902.929 | 2 | 1803.858 | −0.072 | 98 | |
| T24/T25 | 162 – 196 | 1 | QQIENGSGAEDNGDSSHCSNASTHSNQEAGPSNKR | 3669.533 | 918.363 | 4 | 3669.452 | −0.081 | 56 | |
| T27 | 199 – 239 | 0 | TSDDSGLELDNNNAAMAIDPVMDGASEIELVFRPHPTLMEK | 4442.072 | 1111.706 | 4 | 4442.824 | 0.752 | 37 | |
| T30 | 250 – 261 | 0 | TSGNATVDHLSK | 1228.605 | 410.635 | 3 | 1228.905 | 0.300 | 40 | |
| T32 | 267 – 273 | 0 | LALEELR | 842.486 | 422.281 | 2 | 842.562 | 0.076 | 49 | |
| T33/T34 | 274 – 289 | 1 | SKGESNQMNLDTASEK | 1737.784 | 869.847 | 2 | 1737.694 | −0.090 | 121 | |
| T34 | 276 – 289 | 0 | GESNQMNLDTASEK | 1522.657 | 762.375 | 2 | 1522.750 | 0.093 | 79 | |
| T37 | 321 – 333 | 0 | VNKPMELYYAPTK | 1552.796 | 777.478 | 2 | 1552.956 | 0.150 | 70 | |
| T37/T38 | 321 – 336 | 1 | VNKPMELYYAPTKEHK | 1946.992 | 650.086 | 3 | 1947.258 | 0.260 | 46 |
Figure 4. MS/MS spectra of the doubly charged peptide precursor ions at m/z 913.0 for TPQEAITDGLEIVVSPR (A) and at m/z 953.0 for TPQEAITDGLEIVVphosSPR (B), acquired from nanoLC-MS/MS analysis of tryptic digest of recombinant RNF2.
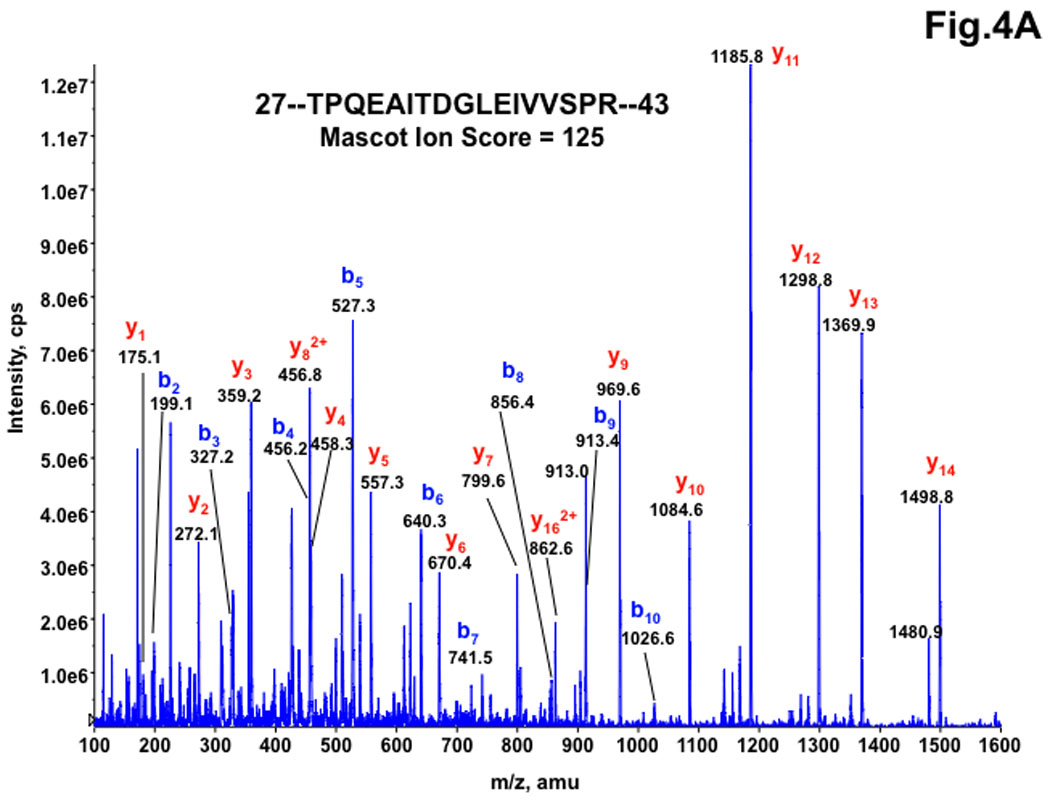
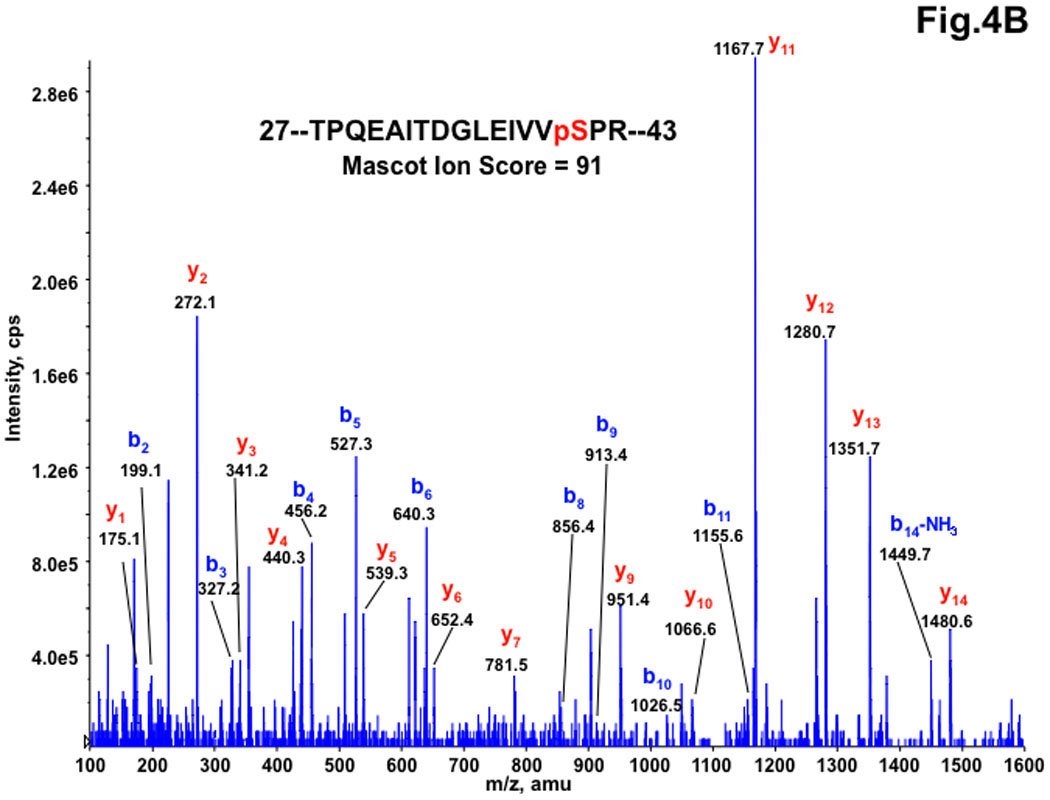
All y-ion series at y3 and higher for the phosphorylated peptide are shifted by −18.0 amu shown at the bottom panel (Panel B) compared to those for the corresponding native peptide at the top panel (Panel A), indicating a net loss of water molecule from the Ser residue due to a neutral loss of phosphogroup (−98 amu) of the phosphorylated Ser residue.
Figure 5. Estimation of phosphopeptide abundance by extracted ion chromatograms of the phosphopeptide (TPQEAITDGLEIVVphosSPR) and its native form.
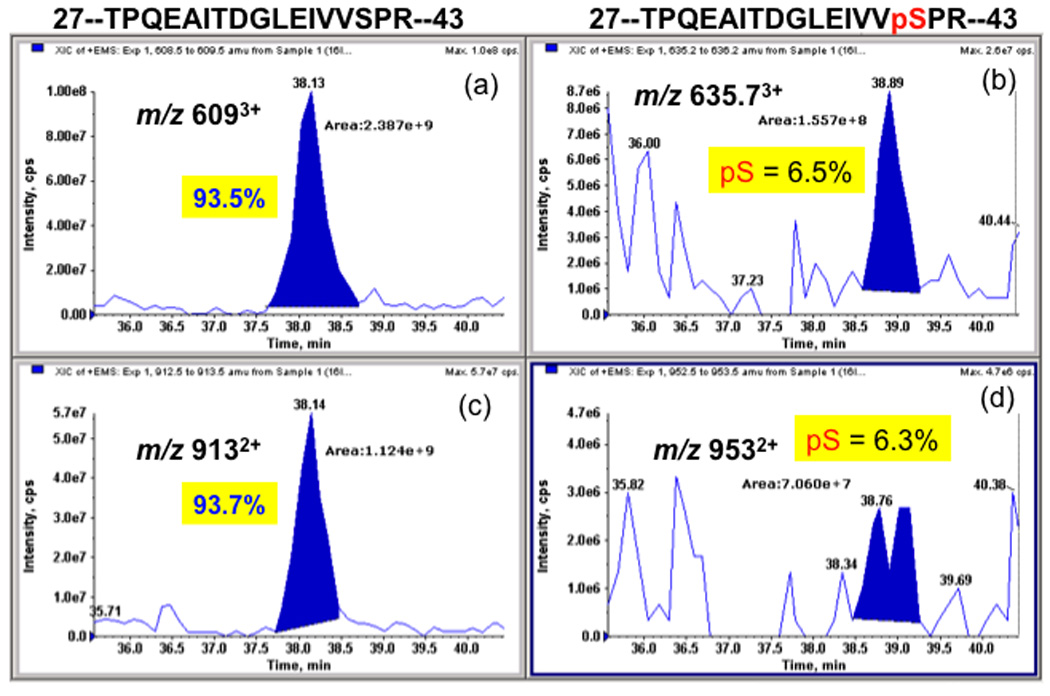
The peak areas of the extracted ions for triply charged native form (Panel A) and its phospho-form (Panel B), and for doubly charged native form (Panel C) and its phosphor-form (Panel D) were used, respectively, for calculation of relative abundance of phosphor-peptide versus its native form. It should be noted that the relative ratios were calculated based on the assumption that both phosphopeptide and its native form have same ionization efficiency as reported [23, 24].
RNF2 is acetylated at its N-terminal 2Ser residue
In our phosphorylation analysis, a modification of acetylation at its N-terminal was also discovered. Peptide mass spectrometry showed that the 42 Da mass increments occurred in the N-terminal tryptic peptide with N-terminal Met excision, and MS/MS peptide sequencing of the N-terminal peptide found that the acetylated modification occurred at the N-terminal Ser residue. The MS/MS spectrum of the N-terminal acetylated peptide (2-SQAVQTNGTQPLSK-15) at 2Ser was shown in Fig. 6. Interestingly, deamidation of 7Asn residue in the acetylated N-terminal peptide was also detected (see Table 1). However, there is no equivalent non-acetylated N-terminal sequence being identified in this study. The result is consistent with the observation that proteins that had undergone both N-terminal Met cleavage and N-acetylation were found to be strongly overrepresented in the protein population relative to those retaining their genuine unblocked Met [19].
Figure 6. MS/MS spectrum of the doubly charged peptide acetylSQAVQTNGTQPLSK, acquired from nanoLC-MS/MS analysis of RNF2 tryptic digest.
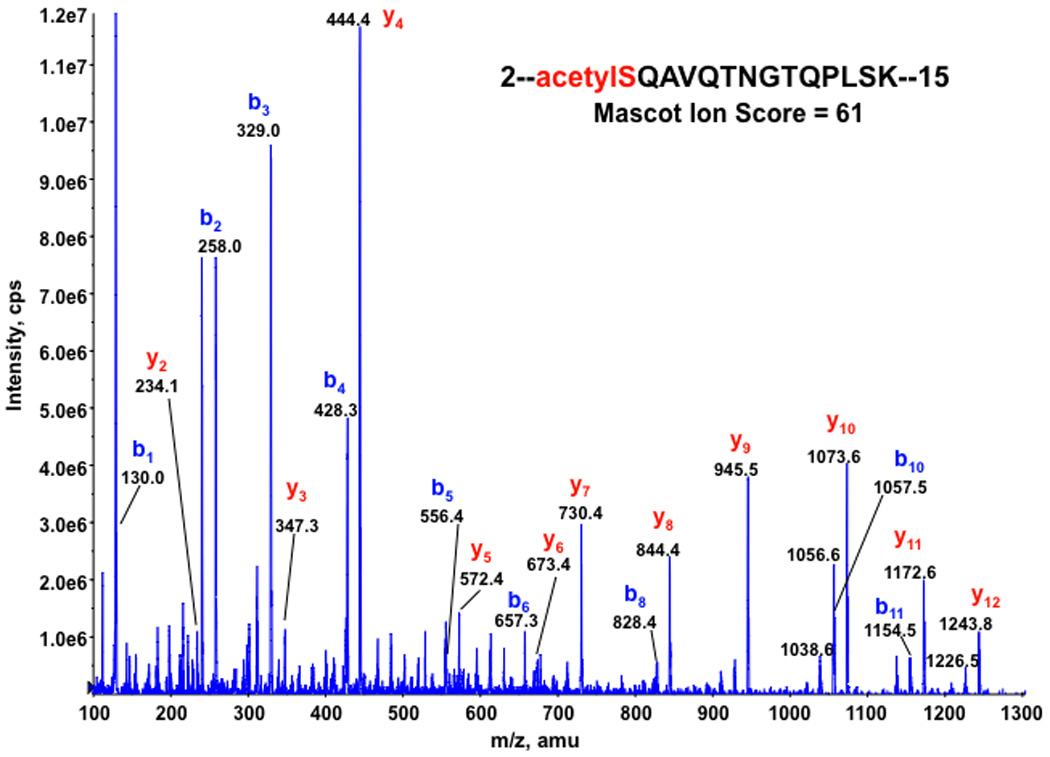
All b-ion series for the peptide are shifted by + 42.0 amu compared to those for the predicted native peptide (data not shown) with matched mass increase of 42 amu for the peptide, confirming its N-terminal acetylation of the peptide.
Functional role of RNF2 phosphorylation
To determine the effects of RNF2 phosphorylation, protein levels of various genes were analyzed in cells expressing RNF2 in the presence and absence of SB203580 or PD98059. Fig.7 shows that p15INK4b level was unchanged in the presence of phosphorylated RNF2. However, dephosphorylation of RNF2 either with SB203580 or PD98059 resulted in a decrease in the amount of p15INK4b, suggesting that dephosphorylated RNF2 is involved in the transcriptional silencing of p15INK4b gene. On the other hand, the β-catenin levels were significantly higher than in cells transfected with vector control and treated with the above kinase inhibitors. Analysis of c-myc expression indicated that although c-myc levels were nearly identical in both control and RNF2-expressing cells, dephosphorylation of RNF2 by PD98059 led to its increased levels. However, there was no effect of RNF2 on the expression of p65. Finally, analysis of histone acetylation indicated that dephosphorylation of RNF2 results in the increased acetylation of histone H2B, but not other histone isoforms (not shown). Thus, these results together suggested that phosphorylation of RNF2 influences the expression pattern of specific genes involved in the transcription and chromatin remodeling.
Figure 7. The effects of RNF2 phosphorylation on the expression of other genes.
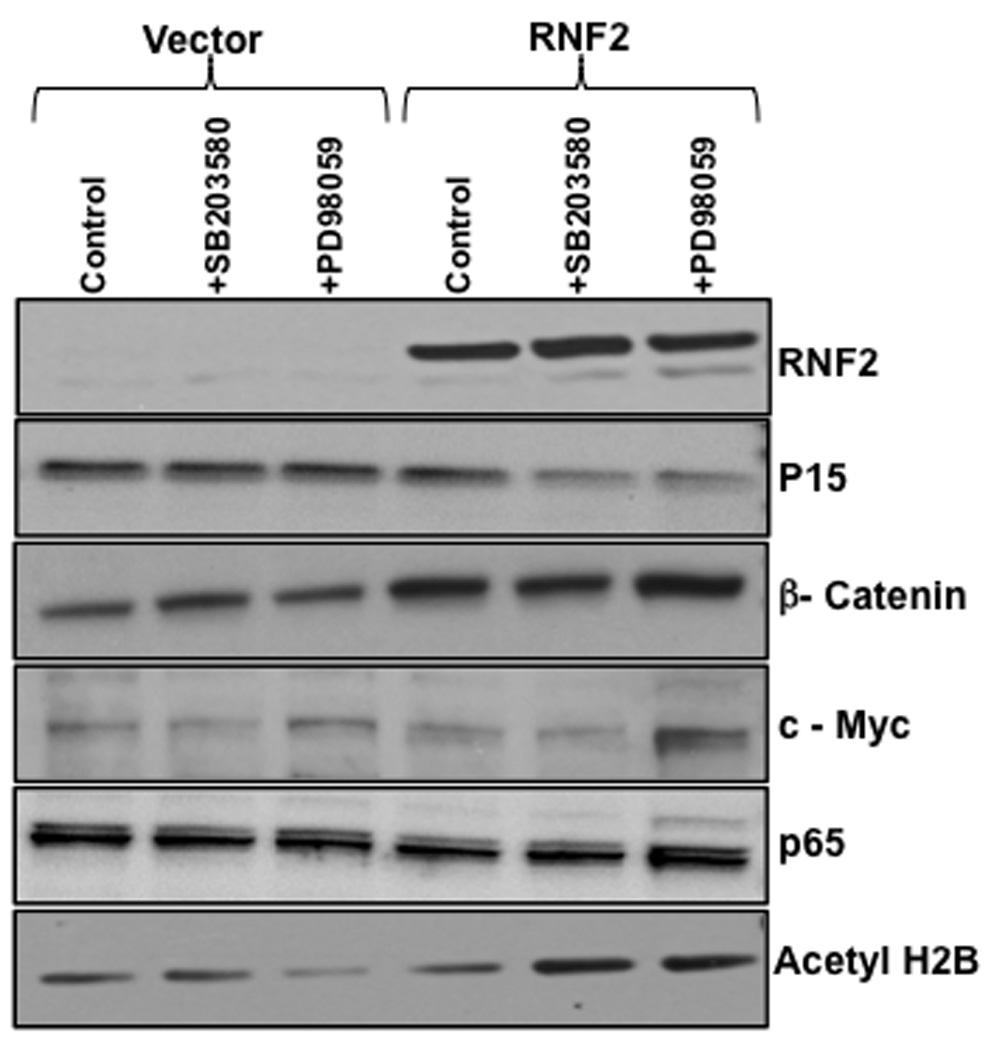
HEK-293 cells were transiently transfected with vector control and RNF2 plasmid and then treated with dimethylsulfoxide (control treatment), SB203580 and PD98059 for 24 h. Cells were lysed and 10 µg of total protein from each sample was analyzed by western blotting using antibodies indicated in the figure.
DISCUSSION
We recently reported that RNF2 interacts in vitro with the linker region of P-glycoprotein, a drug efflux transporter involved in the development of multidrug resistance in cancer [15]. Interestingly, these studies have indicated that the anti-RNF2 antibody reactive RNF2 in the breast cancer MCF-7 cells is a ~39 kDa protein, which is slightly higher than the calculated size of ~37 kDa, raising a possibility that RNF2 undergoes post-translational modifications. Since the amount of RNF2 expressed in MCF-7 cells was minimal and could not be immunoprecipitated, precluding for further characterization, here we utilized HEK-293 cells to prepare recombinant RNF2, as these cells lacked endogenous RNF2 (Fig.1A). Furthermore, RNF2 expressed in these cells migrated with a molecular mass of ~39 kDa, similarly as the endogenous RNF2 expressed in MCF-7 cells, providing an alternative option for the characterization of post-translational modifications in RNF2. RNF2 separated on 2D electrophoresis resolved into a trail of at least seven protein species, confirming our predictions of post-translational modifications in the molecule. Its migration on IEF towards lower pI values from its expected pI of 6.38 is due to the presence of varied number of acidic moieties. Incidentally, Voncken, et al [20] have recently shown that Bmi-1 undergoes phosphorylation by MAPKAP kinase p3, raising the possibility that other PcG proteins including RNF2 might be modulated by phosphorylations. To establish that RNF2 is a phosphoprotein, we utilized RNF2 expressed in the Sf9 insect cells instead of RNF2 expressed in HEK-293 cells for the following reasons. First, the amount of RNF2 expressed in HEK-293 cells was low. In addition, the presence of large number of endogenous HEK-293 cell phosphoproteins precluded an unequivocal identification of phosphorylation sites in RNF2. Second, RNF2 expressed in HEK-293 cells was weakly immunoreactive with phosphoamino acid antibodies. Third, anti-RNF2 antibody, for unknown reasons, could not immunoprecipitate RNF2 expressed in HEK-293 cells. Fourth, RNF2 expressed in Sf9 insect cells exhibits E3 ubiquitin ligase activity, thus is functional [14]. Finally, RNF2 expressed as 6His-tagged protein in Sf9 insect cells could be purified in large amounts. Our data showed that RNF2 obtained from Sf9 insect cells was resolved into multiple protein spots on 2D electrophoresis (Fig.2), similar to the protein expressed in HEK-293 cells, suggesting occurrence of post-translational modifications in RNF2 in both of these expression systems. However, as these two cell types are evolutionarily far apart, it is likely, post-translational modifications that occurred in RNF2 in these two expression systems may differ in the type, location and the extent. Detailed analysis of RNF2 obtained from these two sources will be required to establish further the identity of these post-translational modifications.
Mass spectrometric analysis indicated that the N-terminus of RNF2 begins with 2Ser with N-acetylation modification, suggesting that RNF2 undergoes co-translational excision of 1Met and subsequent N-acetylation of 2Ser residue. Although greater than 60% of the eukaryotic proteins are known to undergo this co-translational modification [19], the significance of this modification in RNF2 is unclear at present. It is possible this modification is involved in maintaining RNF2 stability.
Importantly, the mass spectrometric analysis identified 41Ser as the phosphorylated residue, which was predicted by the web-based predictive algorithms as the p38 MAPK phosphorylation site (www.cbs.dtu.dk/services/NetPhosK/). Although these algorithms predicted many other putative phosphorylation sites in RNF2, no other phosphorylated residue was identified in all of our four attempts of mass spectrometric analyses. Also, this procedure did not identify any other post-translational events; this could be due to the loss of phosphate moieties from protein during sample handling and/or limitations of mass spectrometry in analyzing a variety of post-translational modifications that occur in proteins. Most significantly, RNF2 expressed in HEK-293 cells was phosphorylated at an SB203580-sensitive site, clearly suggesting that 41Ser is a target for modification by p38 MAPK signaling. As mentioned in the Introduction, the RING finger domain in RNF2 spans from ~40 to 90 residues, which is involved in the protein-protein interactions with Bmi-1. Thus, it is likely that phosphorylation of 41Ser will modulate the interactions between RNF2 and Bmi-1 as well as other unknown function of RNF2. Finally, RNF2 was phosphorylated at multiple sites by MEK1/2, as judged by the use of specific inhibitor, PD98059.
RNF2 phosphorylation by p38 MAPK and ERK1/2 pathways differentially modulates the protein levels of various genes (Fig.7). Since RNF2 is a nuclear protein [15], and an integral component of PcG proteins involved in the transcriptional regulation, it is reasonable to suggest that the effects observed are most likely related to the alterations in the transcription rather than protein stability. Thus, the reduced levels of the p15INK4b, a tumor suppressor protein encoded by the INK4b-ARF-INK4a locus [21] stably silenced in a variety of human cancers, suggest that dephosphorylated RNF2 is involved in silencing this tumor suppressor locus. Although the β-catenin levels were increased by RNF2, the levels of p65 were essentially unaltered, suggesting that RNF2 is involved in selective regulation of transcription factors. Acetylation of histone 2B is known to promote transcription [22]. Thus, our observations that increased histone 2B acetylation occurs in the presence of dephosphorylated RNF2, suggest that RNF2 mediates chromatin remodeling through altering the acetylation of histone 2B. Together these observations suggest that the RNF2 phosphorylation plays an important role both in the transcriptional silencing and activation, which is gene-specific.
Our findings shed some light on how the PcG proteins may function and contribute to gene silencing/activation in diverse physiological settings such as the embryogenesis, morphogenesis, tissue development, cell cycle progression, acute and chronic responses to stress, and oncogenesis. The MAPK pathways identified here to affect RNF2 are potently activated by distinct set of stimuli, allowing cells to respond coordinately to multiple and divergent inputs. The major MAPKs, comprising the p38 (α/β/γ/δ), ERK1/2, and the JNKs can be activated by wide variety of stimuli including hormones, growth factors, inflammatory cytokines, cellular injuries, oxidative imbalance and stresses due to environmental and therapeutic causes. These stimuli may act through different receptor families that are coupled to receptor tyrosine kinases, G protein-coupled receptors and cytokine receptors to orchestrate cellular activities like gene expression, cell cycle progression, metabolism, motility, survival, apoptosis and differentiation. Therefore, it is tempting to speculate that the multi-site phosphorylation of RNF2 elicited through the MAPK and ERK1/2 regulatory cascades may critically govern the ability of RNF2 to associate with PRC1 components, its nuclear translocation, ubiquitin ligase activity, as well as its yet undefined functions to ultimately regulate gene expression in a variety of contexts. As such, it will be of considerable interest to characterize the impact of MAPK and ERK1/2 phosphorylations of RNF2, singly, and in combination on its biochemical functions both in vitro and in vivo.
ACKNOWLEDGEMENTS
This work was supported by grants from the National Institutes of Health CA106625 and Laura W. Bush Research Institute for Women’s Health to U.S. Rao.
REFERENCES
- 1.Schwartz YB, Pirrotta V. Polycomb silencing mechanisms and the management of genomic programmes. Nat Rev Genet. 2007;8:9–22. doi: 10.1038/nrg1981. [DOI] [PubMed] [Google Scholar]
- 2.Cao R, Wang L, Wang H, Xia L, et al. Role of histone H3 lysine 27 methylation in Polycomb-group silencing. Science. 2002;298:1039–1043. doi: 10.1126/science.1076997. [DOI] [PubMed] [Google Scholar]
- 3.Shao Z, Raible F, Mollaaghababa R, Guyon JR, et al. Stabilization of chromatin structure by PRC1, a Polycomb complex. Cell. 1999;98:37–46. doi: 10.1016/S0092-8674(00)80604-2. [DOI] [PubMed] [Google Scholar]
- 4.Levine SS, Weiss A, Erdjument-Bromage H, Shao Z, et al. The core of the polycomb repressive complex is compositionally and functionally conserved in flies and humans. Mol Cell Biol. 2002;22:6070–6078. doi: 10.1128/MCB.22.17.6070-6078.2002. [DOI] [PMC free article] [PubMed] [Google Scholar]
- 5.Wiederschain D, Chen L, Johnson B, Bettano K, et al. Contribution of polycomb homologues Bmi-1 and Mel-18 to medulloblastoma pathogenesis. Mol Cell Biol. 2007;27:4968–4979. doi: 10.1128/MCB.02244-06. [DOI] [PMC free article] [PubMed] [Google Scholar]
- 6.Dimri GP, Martinez JL, Jacobs JJ, Keblusek P, et al. The Bmi-1 oncogene induces telomerase activity and immortalizes human mammary epithelial cells. Cancer Res. 2002;62:4736–4745. [PubMed] [Google Scholar]
- 7.Leung C, Lingbeek M, Shakhova O, Liu J, et al. Bmi1 is essential for cerebellar development and is overexpressed in human medulloblastomas. Nature. 2004;428:337–341. doi: 10.1038/nature02385. [DOI] [PubMed] [Google Scholar]
- 8.Vonlanthen S, Heighway J, Altermatt HJ, Gugger M, et al. The bmi-1 oncoprotein is differentially expressed in non-small cell lung cancer and correlates with INK4A-ARF locus expression. Br J Cancer. 2001;84:1372–1376. doi: 10.1054/bjoc.2001.1791. [DOI] [PMC free article] [PubMed] [Google Scholar]
- 9.Jacobs JJ, Scheijen B, Voncken JW, Kieboom K, et al. Bmi-1 collaborates with c-Myc in tumorigenesis by inhibiting c-Myc-induced apoptosis via INK4a/ARF. Genes Dev. 1999;13:2678–2690. doi: 10.1101/gad.13.20.2678. [DOI] [PMC free article] [PubMed] [Google Scholar]
- 10.Francis NJ, Saurin AJ, Shao Z, Kingston RE. Reconstitution of a functional core polycomb repressive complex. Mol Cell. 2001;8:545–556. doi: 10.1016/s1097-2765(01)00316-1. [DOI] [PubMed] [Google Scholar]
- 11.Wang H, Wang L, Erdjument-Bromage H, Vidal M, et al. Role of histone H2A ubiquitination in Polycomb silencing. Nature. 2004;431:873–878. doi: 10.1038/nature02985. [DOI] [PubMed] [Google Scholar]
- 12.Stock JK, Giadrossi S, Casanova M, Brookes E, et al. Ring1-mediated ubiquitination of H2A restrains poised RNA polymerase II at bivalent genes in mouse ES cells. Nat Cell Biol. 2007;9:1428–1435. doi: 10.1038/ncb1663. [DOI] [PubMed] [Google Scholar]
- 13.Cao R, Tsukada Y, Zhang Y. Role of Bmi-1 and Ring1A in H2A ubiquitylation and Hox gene silencing. Mol Cell. 2005;20:845–854. doi: 10.1016/j.molcel.2005.12.002. [DOI] [PubMed] [Google Scholar]
- 14.Li Z, Cao R, Wang M, Myers MP, et al. Structure of a Bmi-1-Ring1B polycomb group ubiquitin ligase complex. J Biol Chem. 2006;281:20643–20649. doi: 10.1074/jbc.M602461200. [DOI] [PubMed] [Google Scholar]
- 15.Rao PS, Mallya KB, Srivenugopal KS, Balaji KC, Rao US. RNF2 interacts with the linker region of the human P-glycoprotein. Int J Oncol. 2006;29:1413–1419. [PubMed] [Google Scholar]
- 16.Williamson BL, Marchese J, Morrice NA. Automated identification and quantification of protein phosphorylation sites by LC/MS on a hybrid triple quadrupole linear ion trap mass spectrometer. Mol Cell Proteomics. 2006;5:337–346. doi: 10.1074/mcp.M500210-MCP200. [DOI] [PubMed] [Google Scholar]
- 17.Cuenda A, Rouse J, Doza YN, Meier R, et al. SB 203580 is a specific inhibitor of a MAP kinase homologue which is stimulated by cellular stresses and interleukin-1. FEBS Lett. 1995;364:229–233. doi: 10.1016/0014-5793(95)00357-f. [DOI] [PubMed] [Google Scholar]
- 18.Dudley DT, Pang L, Decker SJ, Bridges AJ, Saltiel AR. A synthetic inhibitor of the mitogen-activated protein kinase cascade. Proc Natl Acad Sci U S A. 1995;92:7686–7689. doi: 10.1073/pnas.92.17.7686. [DOI] [PMC free article] [PubMed] [Google Scholar]
- 19.Giglione C, Boularot A, Meinnel T. Protein N-terminal methionine excision. Cell Mol Life Sci. 2004;61:1455–1474. doi: 10.1007/s00018-004-3466-8. [DOI] [PMC free article] [PubMed] [Google Scholar]
- 20.Voncken JW, Niessen H, Neufeld B, Rennefahrt U, et al. MAPKAP kinase 3pK phosphorylates and regulates chromatin association of the polycomb group protein Bmi1. J Biol Chem. 2005;280:5178–5187. doi: 10.1074/jbc.M407155200. [DOI] [PubMed] [Google Scholar]
- 21.Gil J, Peters G. Regulation of the INK4b-ARF-INK4a tumour suppressor locus: all for one or one for all. Nat Rev Mol Cell Biol. 2006;7:667–677. doi: 10.1038/nrm1987. [DOI] [PubMed] [Google Scholar]
- 22.Myers FA, Chong W, Evans DR, Thorne AW, Crane-Robinson C. Acetylation of histone H2B mirrors that of H4 and H3 at the chicken beta-globin locus but not at housekeeping genes. J Biol Chem. 2003;278:36315–36322. doi: 10.1074/jbc.M305822200. [DOI] [PubMed] [Google Scholar]
- 23.Tsay YG, Wang YH, Chiu CM, Shen BJ, Lee SC. A strategy for identification and quantitation of phosphopeptides by liquid chromatography/tandem mass spectrometry. Anal Biochem. 2000;287:55–64. doi: 10.1006/abio.2000.4837. [DOI] [PubMed] [Google Scholar]
- 24.Britton DJ, Scott GK, Schilling B, Atsriku C, et al. A novel serine phosphorylation site detected in the N-terminal domain of estrogen receptor isolated from human breast cancer cells. J Am Soc Mass Spectrom. 2008;19:729–740. doi: 10.1016/j.jasms.2008.02.008. [DOI] [PMC free article] [PubMed] [Google Scholar]