Abstract
Dietary protein can stimulate pancreatic growth in the absence of CCK release, but there is little data on the regulation of CCK-independent growth. To identify mechanisms whereby protein stimulates pancreatic growth in the absence of CCK release, C57BL/6 control and CCK-null male mice were fed normal-protein (14% casein) or high-protein (75% casein) chow for 7 days. The weight of the pancreas increased by 32% in C57BL/6 mice and 26% in CCK-null mice fed high-protein chow. Changes in pancreatic weight in control mice were due to both cell hypertrophy and hyperplasia since there was an increase in protein-to-DNA ratio, total DNA content, and DNA synthesis. In CCK-null mice pancreatic growth was almost entirely due to hypertrophy with both protein-to-DNA ratio and cell size increasing without significant increases in DNA content or DNA synthesis. ERK, calcineurin, and mammalian target of rapamycin complex 1 (mTORC1) are activated in models of CCK-induced growth, but there were no differences in ERK or calcineurin activation between fasted and fed CCK-null mice. In contrast, mTORC1 activation was increased after feeding and the duration of activation was prolonged in mice fed high-protein chow compared with normal-protein chow. Changes in pancreatic weight and RNA content were completely inhibited, and changes in protein content were partially abated, when the mTORC1 inhibitor rapamycin was administered during high-protein chow feeding. Prolonged mTORC1 activation is thus required for dietary protein-induced pancreatic growth in the absence of CCK.
Keywords: pancreatic acinar cell, hyperplasia, hypertrophy, amino acids, mammalian target of rapamycin complex 1
consumption of large amounts of dietary protein induces growth of the adult rodent pancreas (15, 33). Dietary protein stimulates secretion of the gastrointestinal hormone cholecystokinin (CCK) (15, 21), and administration of exogenous CCK induces both growth of the pancreas in vivo (5, 11, 27) and pancreatic acinar cell division in vitro (22). Moreover, feeding oral trypsin inhibitors causes circulating CCK levels to be chronically elevated and stimulates pancreatic growth in rats (13) and mice (27, 35), largely through an increase in cell number (hyperplasia).
The association between protein ingestion and CCK secretion initially led to the hypothesis that CCK is required for dietary protein-induced growth. Although some experiments utilizing pharmacological CCK receptor antagonists in rats seemed to support this hypothesis (14, 25), it has been demonstrated that rats fed high concentrations of amino acids, which unlike protein do not stimulate CCK secretion (21), have significant pancreatic hypertrophy (18). More definitively, Lacourse et al. (20) generated a CCK-deficient mouse and demonstrated that pancreatic hypertrophy resulting from feeding a protein-enriched diet is similar in CCK-deficient mice and wild-type littermates. Thus dietary protein can stimulate pancreatic growth independent of CCK, but the underlying mechanisms are currently unresolved.
Recent studies have demonstrated that several signal transduction pathways associated with cell growth are activated in the pancreas of wild-type mice fed an oral trypsin inhibitor. The extracellular signal-regulated kinases (ERKs) are transiently activated following trypsin inhibitor feeding, whereas the c-Jun NH2-terminal kinases (JNKs) are quickly activated following the initiation of feeding and remain activated while trypsin inhibitors are in the diet (34). Much like the JNKs, the protein phosphatase calcineurin, and the protein kinases Akt and mammalian target of rapamycin complex 1 (mTORC1) remain activated for the duration of trypsin inhibitor feeding (8, 35). Furthermore, it has been demonstrated that inhibition of either calcineurin (35) or mTORC1 (8) activation prevents trypsin inhibitor-induced pancreatic growth in wild-type mice.
The mTORC1 pathway is activated in isolated pancreatic acinar cells by amino acids (31) and feeding of the branched-chain amino acid leucine stimulates mTORC1 activation in the pancreas of CCK-deficient mice (30). Both the amplitude and duration of hyperaminoacidemia following a single meal is dependent on the amount of protein consumed (24), and, in rats being adapted to a high-protein diet, plasma concentrations of the branched-chain amino acids remain elevated after 14 days of feeding whereas those of the other amino acids return to basal levels within 2 days of altering the protein composition of the diet (1). Studies in skeletal muscle indicate that activation of mTORC1 by leucine is dose dependent (7); therefore it is plausible that consumption of large amounts of dietary protein induces pancreatic growth independently of CCK via changes in the magnitude and duration of mTORC1 activation by branched-chain amino acids. The purpose of this study was 1) to identify CCK-independent signaling pathways that are activated in the pancreas following dietary protein consumption and 2) to elucidate whether activation of these pathways is necessary for dietary protein-induced exocrine pancreas growth.
METHODS
Materials.
Animal chow was from Dyets (Bethlehem, PA). Protease inhibitors were from Roche (Indianapolis, IN). Bovine anti-goat horseradish peroxidase-conjugated IgG was obtained from Santa Cruz Biotechnology (Santa Cruz, CA); sheep anti-mouse and donkey anti-rabbit horseradish peroxidase-conjugated IgG were from Amersham Pharmacia Biotech (Piscataway, NJ); enhanced chemiluminescence reagents were from Amersham and Pierce (Rockford, IL); precast electrophoresis gels, SDS-PAGE molecular weight markers, nitrocellulose membranes, and protein assay reagent were from Bio-Rad (Hercules, CA). 4E-BP1 antibody was obtained from Calbiochem (San Diego, CA). Ribosomal protein S6 (S6) and GAPDH antibodies were from Santa Cruz. Phosphorylated Akt, phosphorylated p42/44 ERK, and phosphorylated S6 antibodies were from Cell Signaling (Beverly, MA). Amylase antibody was from Sigma, and chymotrypsin, ribonuclease, and lipase antibodies were from Cortex (San Leandro, CA). Antibody to 5-bromo-2-deoxyuridine (BrdU) was a rat monoclonal from Accurate Chemical (Westbury, NY); CRHSP-24 antibody has been described previously (16). Rapamycin was from LC Laboratories (Woburn, MA) and BrdU was from Invitrogen. The oral trypsin inhibitor camostat (FOY-305) was generously provided by Ono Pharmaceuticals (Osaka, Japan).
Animal care.
Six- to 9-wk-old male C57BL/6 (Jackson Laboratories; Bar Harbor, ME) and homozygous CCK-null mice on C57BL/6 background (greater than 10 generations) were maintained on a 12:12-h light-dark cycle with free access to water and chow. All animals were euthanized under carbon dioxide anesthesia by exsanguination. The University of Michigan Committee on Use and Care of Animals approved the animal facilities and the experimental protocol used in these studies.
Experimental design.
In all experiments, animals were acclimated to normal-protein chow (AIN-93M; 3,602 kcal/kg, 140 g/kg casein, 100 g/kg sucrose, 466 g/kg cornstarch, 40 g/kg soybean oil) for 3 days prior to further experimental manipulation. Animals were food deprived for 16 h and then refed with either normal-protein chow or modified high-protein AIN-93M chow that was isocaloric due to decreased starch content (3,640 kcal/kg, 750 g/kg casein, 101 g/kg sucrose, 41 g/kg soybean oil). In separate experiments, mice received an intraperitoneal injection of either a 2% carboxymethylcellulose (CMC) solution (1 ml/100 g body wt) or rapamycin (0.2 mg/100 g body wt) suspended in 2% CMC 1 h prior to the administration of experimental chow and subsequent daily injections of rapamycin for 7 days. Blood was collected via cardiac puncture under carbon dioxide anesthesia and the pancreas was quickly excised and weighed. Portions of the pancreas were processed, either immediately or after freezing in liquid nitrogen, for further analysis.
Quantitation of pancreatic growth.
Following removal of the pancreas and rapid determination of total pancreatic wet weight, a frozen portion was weighed and homogenized in a solution (2 ml/100 mg pancreas) containing 0.1% Triton X-100 (vol/vol) and 5 mM MgCl2 and subsequently sonicated for 15 s. Protein was determined spectrophotometrically by using Bio-Rad protein assay reagent. DNA and RNA were assayed fluorometrically with kits from Sigma-Aldrich (St. Louis, MO) and Molecular Probes (Eugene, OR), respectively and a Perkin Elmer LS 55 luminescence spectrometer (Perkin Elmer Instruments; Norwalk, CT). Total pancreatic protein DNA and RNA were then calculated.
To determine DNA synthesis, mice were fed either normal or high-protein diet for 2 days; as a positive control camostat was added to normal diet at 0.1%. BrdU was administered intraperitoneally at 50 mg/kg 2 h prior to euthanasia. The pancreas was fixed in 4% formaldehyde and processed for BrdU immunohistochemistry as previously described. Total nuclei were visualized with 4,6-diamidino-2-phenylindole (DAPI) (8).
To determine changes in cell size we quantitated the density of nuclei stained with DAPI using Metamorph software as modified from a previous study (6). Four mice from each of the following conditions were analyzed for number of nuclei per unit area of mouse pancreas: wild-type and CCK receptor knockout mice on either normal diet or high-protein diet for 7 days. Cryostat sections (6 μm thick) of tissue blocks, fixed with 4% paraformaldehyde in PBS, were picked up on glass slides and coverslipped with mounting medium containing the nuclear stain, DAPI (Prolong Gold, Invitrogen), and viewed via a ×40 objective with an Olympus BX-51 fluorescence microscope. Five random fields containing DAPI-fluorescent nuclei (DAPI filter cube) were digitally recorded for each animal. Fields containing islets were avoided. Fluorescence images, using a FITC filter cube, were also recorded for use in determining tissue area. Counts of DAPI-stained nuclei were performed by using the Count Nuclei application in Metamorph software. To correct for varying tissue areas in each of the five images per animal, images recorded with the FITC cube were thresholded in Metamorph to distinguish tissue background fluorescence from the low pixel values associated with nontissue spaces. Nuclear counts were expressed as number of nuclei per 100 μm2 tissue area.
Immunoblot analysis.
Sample preparation, gel electrophoresis, and visualization was performed exactly as described previously (8). Total amounts of digestive enzymes and changes in the phosphorylation state of p42/44 ERK, Akt, and S6 are expressed as a percentage of fasted control values; GAPDH was used as a loading control. When subjected to SDS-PAGE, 4E-BP1 resolves into multiple electrophoretic forms whereby the most highly phosphorylated γ-form exhibits the slowest mobility. Changes in 4E-BP1 phosphorylation were assessed by calculating the proportion of 4E-BP1 in the γ-form.
Morphology.
At least five mice in each dietary group (normal protein, high protein, normal protein plus rapamycin, and high protein plus rapamycin) were evaluated. Small blocks of pancreas were fixed for 2 h with a mixture of 2% glutaraldehyde and 2% formaldehyde (prepared fresh from paraformaldehyde) in PBS, postfixed for 45 min with 1% OsO4, and then dehydrated and embedded in Epon. Semithin plastic sections (1 μm thick) were stained with 1% toluidine blue in 1% sodium borate and examined with an Olympus BX-51 light microscope equipped with a digital camera. Ultrathin sections were prepared from two mice for each group and stained with uranyl acetate and lead citrate and at least 10 images were recorded digitally for each pancreas via a Philips CM-100 electron microscope.
Statistical analysis.
Data are expressed as means ± SE. Data were analyzed using the GraphPad Prism statistical software package (GraphPad Software, San Diego, CA). Statistical significance was assessed by one-way or two-way ANOVA and Bonferroni's multiple comparison posttest. P values <0.05 were considered significant.
RESULTS
Feeding a protein-enriched diet stimulates pancreatic hypertrophy in control and CCK-null mice.
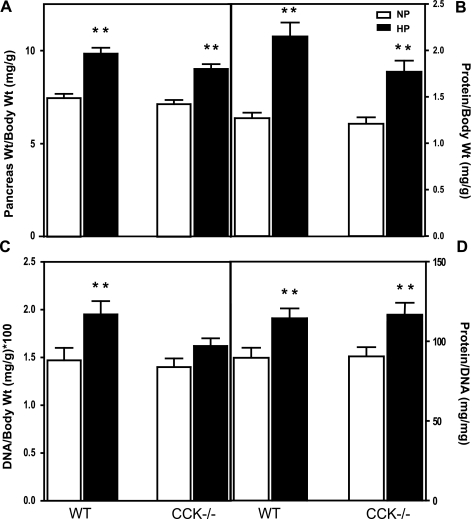
Lacourse et al. (20) have previously shown that feeding large amounts of dietary protein for 15 days can stimulate pancreatic growth in CCK-deficient mice. In the present study, control and CCK-null mice (both on C57BL/6 background) were fed normal protein (140 g/kg casein) or high-protein (750 g/kg casein) chow for 7 days. The weight of the pancreas (Fig. 1A) in CCK-null mice fed normal-protein chow was similar to that of control mice fed the same chow. In both control and CCK-null mice the weight of the pancreas increased in response to feeding high-protein chow: 32 and 26% in control and CCK-null mice, respectively. Changes in pancreatic weight in control mice involved an increase in both protein and DNA with a 68% increase in protein content (Fig. 1B) and a 32% increase in DNA content (Fig. 1C). The larger increase in protein is consistent with hypertrophy; this was validated when the individual protein-to-DNA ratios were evaluated (Fig. 1D). There was no significant increase in DNA in CCK-null mice; however, protein content and the protein-to-DNA ratio were increased (Fig. 1, B–D). Because changes in weight can result from changes in water content we evaluated the percent of water in the pancreas. There was no change in percent water between the four groups, and increases in dry weight paralleled the increases in wet weight (data not shown).
Fig. 1.
Effect of dietary protein on pancreatic growth in control and CCK-null mice. Changes in pancreas weight (A), protein content (B), DNA content (C), and protein-to-DNA ratio (D) after feeding normal-protein or high-protein chow for 7 days. NP, normal-protein 140 g/kg casein chow; HP, high-protein 750 g/kg casein chow; WT, C57Bl/6 mice; CCK−/−; homozygous CCK-null mice on C57Bl/6 background. Values represent means ± SE; n = 23–26 mice per group. Significantly different from respective 140 g/kg chow value, **P < 0.01 as determined by 2-way ANOVA.
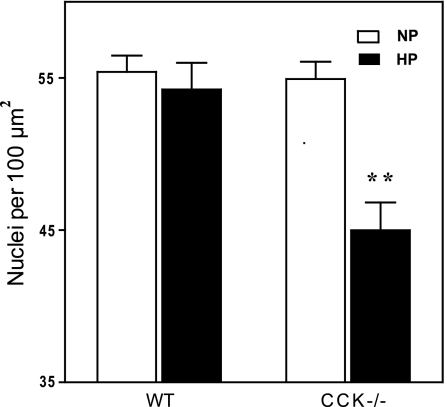
To further evaluate hypertrophy we carried out counts of nuclei per unit area in the exocrine pancreas as described in methods. The average control nuclear density was 55.4 per 100 μm2 and this was unchanged in CCK-null mice and essentially unchanged (54.2) in control mice fed high-protein chow (Fig. 2). When CCK-null mice were fed high-protein chow the nuclear density decreased significantly to 45.0 nuclei per 100 μm2. By this measure cellular hypertrophy was seen in CCK-null but not wild-type mice fed high-protein.
Fig. 2.
Effect of dietary protein on average cell size in wild-type and CCK-null mice. Mice were fed the specified diet for 7 days. Nuclei were stained with 4,6-diamidino-2-phenylindole (DAPI) and quantitated with Metamorph software as detailed in methods. An increase in cell size leads to a decrease in nuclear density. N = 4 mice per group; **P < 0.01 compared with similar mice on a control diet as determined by 2-way ANOVA.
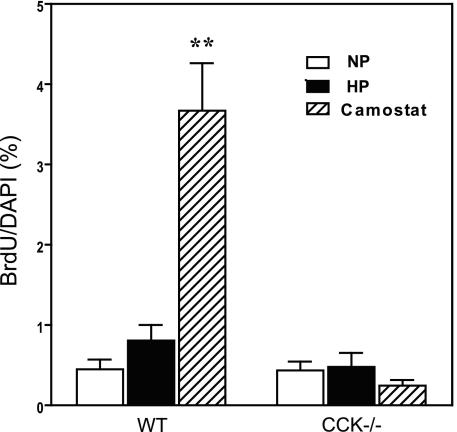
To further evaluate hyperplasia we evaluated DNA synthesis by measurement of BrdU incorporation into acinar cell nuclei (Fig. 3). Utilizing a 2-h exposure to BrdU the basal labeling rate in wild-type mice was 0.40%. This incorporation rate was essentially doubled in mice fed high-protein chow for 2 days although the increase was not statistically significant (P < 0.1 but > 0.05). BrdU incorporation into mice fed camostat in normal chow was increased 10-fold, consistent with earlier studies. By contrast, in CCK-null mice BrdU rates were unchanged regardless of diet or camostat and not different from control mice on control chow. Based on the entirety of the above data we conclude that feeding a high-protein diet to C57Bl/6 mice induces mixed hypertrophy and hyperplasia whereas in CCK-null mice high-protein chow induces only hypertrophy. This conclusion is complementary to previous results showing that increasing CCK by feeding camostat induces pure hyperplasia (35).
Fig. 3.
Effect of feeding a high-protein diet or camostat on 5-bromo-2-deoxyuridine (BrdU) incorporation into pancreas of wild-type or CCK-null mice. Mice were fed the specified diet for 2 days before BrdU labeling. N = 6–8 mice per group. Both normal and CCK-null mice were analyzed by 1-way ANOVA. **P < 0.01 compared with control normal protein diet.
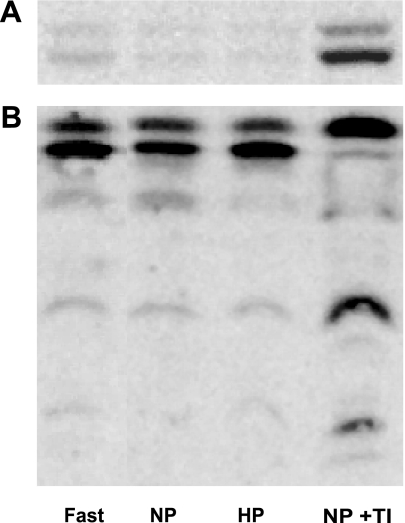
Feeding a protein-enriched diet does not stimulate MAPK or calcineurin activity in the pancreas of CCK-null mice. Previous studies from our laboratory have demonstrated that oral trypsin inhibitor-induced pancreatic growth is associated with activation of p42/44 ERK (10, 34) and the protein phosphatase calcineurin (35). To elucidate whether dietary protein stimulates these pathways independently of CCK, CCK-null mice were food deprived for 16 h and then allowed access to either normal-protein or high-protein chow for 2 h. In contrast, to control mice fed normal-protein chow supplemented with trypsin inhibitor (Fig. 4A), consumption of normal protein or high-protein chow alone was not associated with increases in p42/44 ERK phosphorylation in CCK-null mice (Fig. 4A). Similarly, whereas there were dramatic changes in phosphorylation of the calcineurin substrate CRHSP-24 in control mice fed normal-protein chow supplemented with trypsin inhibitor (Fig. 4B), these changes were not observed in CCK-null mice fed normal protein or high-protein chow alone (Fig. 4B). Our laboratory has previously reported that CCK induces nuclear localization of the calcineurin substrate NFACTc2 (17). Changes in NFATc2 localization were, however, not observed in CCK-null mice fed normal-protein or high-protein chow (data not shown).
Fig. 4.
Effect of dietary protein on signal transduction pathway activation in the pancreas of CCK-null mice. Changes in the phosphorylation of p42/44 ERK (A) and the calcineurin substrate CRHSP-24 (B) after feeding normal-protein or high-protein chow. Fast, food deprived for 16 h; NP, refed 140 g/kg casein chow for 2 h; HP, refed 750 g/kg casein chow for 2 h; NP+TI, C57Bl/6 mouse refed 140 g/kg casein chow supplemented with 0.1% trypsin inhibitor for 2 h.
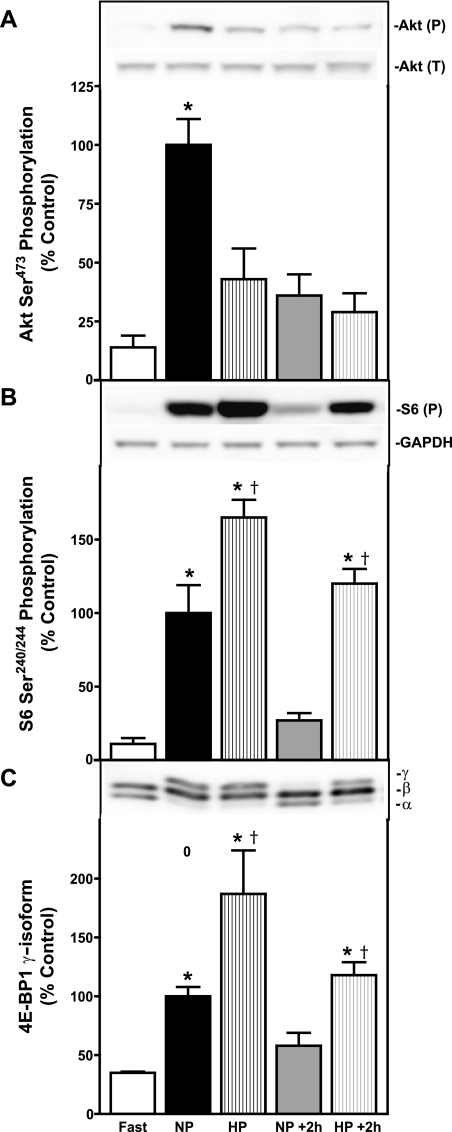
Feeding a protein-enriched diet stimulates mTORC1 activity in the pancreas of CCK-null mice. CCK-induced pancreatic growth is associated with activation of the PI3K-Akt-mTORC1 pathway (4, 8, 9, 34). In the present study, feeding normal-protein chow for 2 h following 16 h of food deprivation resulted in statistically significant increases in the phosphorylation of Akt (Fig. 5A) and two downstream targets of mTORC1, S6 (Fig. 5B), and 4E-BP1 (Fig. 5C) above fasting levels. Feeding high-protein chow did not result in statistically significant increases in Akt phosphorylation (Fig. 5A) above fasting levels; however, phosphorylation of ribosomal protein S6 (Fig. 5B) and 4E-BP1 (Fig. 5C) was greater than in both fasted mice and those fed normal-protein chow. To determine whether the duration of mTORC1 activation is different between mice fed normal-protein and high-protein chow, mice were food deprived for an additional 2 h following the initial 2 h feeding period. Phosphorylation of Akt (Fig. 5A), S6 (Fig. 5B) and 4E-BP1 (Fig. 5C) returned to fasted values after 2 h of food deprivation in mice initially fed normal-protein chow. Phosphorylation of Akt (Fig. 5A) remained unchanged in mice initially fed high-protein chow, but phosphorylation of S6 (Fig. 5B) and 4E-BP1 (Fig. 5C) remained significantly elevated above fasting values. Thus, in response to high-protein chow, activation of mTORC1 is greater in both magnitude and duration. An explanation of the lack of change in Akt phosphorylation in response to high-protein chow is presented in the discussion.
Fig. 5.
Effect of dietary protein on mammalian target of rapamycin (mTORC1) pathway activation in the pancreas of CCK-null mice. Changes in the phosphorylation of Akt (A), ribosomal protein S6 (B), and 4E-BP1 (C) after feeding normal protein or high-protein chow. Fast, food deprived for 16 h; NP, refed 140 g/kg casein chow for 2 h; HP, refed 750 g/kg casein chow for 2 h; NP+2h; 2 h after completed refeeding of 140 g/kg casein chow; HP+2h; 2 h after completed refeeding of 750 g/kg casein chow. Insets: representative immunoblots. Akt (P), Akt phosphorylated on Ser473; Akt (T), total Akt content; S6(P), S6 phosphorylated on Ser240/244; GAPDH (loading control); γ, γ-form of 4E-BP1; β, β-form of 4E-BP1; α, α-form of 4E-BP1. Values represent means ± SE; n = 6–8. *Significantly different from 16 h food-deprived value; †significantly different from respective normal-protein chow value (chow effect), P < 0.05 as determined by 1-way ANOVA.
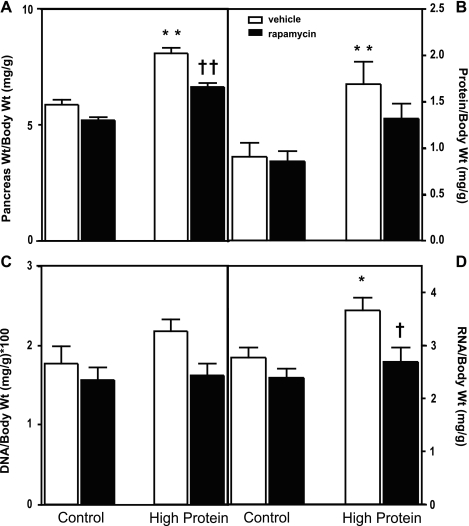
mTORC1 activation is required for dietary protein-induced pancreatic growth in CCK-null mice. To elucidate whether CCK-independent mTORC1 activation is required for dietary protein-induced pancreatic growth, the mTORC1 inhibitor rapamycin was administered daily to CCK-null mice fed normal protein or high-protein chow for 7 days. Rapamycin administration resulted in decreases in pancreatic weight (Fig. 6A) in mice fed both normal-protein and high-protein chow, but this was only significant for mice fed high protein. The decrease in pancreatic weight induced by rapamycin in high-protein-fed mice was associated with comparable decreases in pancreatic protein (Fig. 6B) and DNA (Fig. 6C) content, but variability in the data prevented the decreases from being statistically significant. Rapamycin administration resulted in a complete inhibition of the high-protein-induced increase in RNA content that was statistically significant (Fig. 6D).
Fig. 6.
Effect of rapamycin administration on pancreatic growth in CCK-null mice. Changes in pancreas weight (A), protein content (B), DNA content (C), and RNA content (D) in mice fed normal- or high-protein diet and administered vehicle or rapamycin for 7 days. Values represent means ± SE; n = 9–11 mice. *Significantly different from normal protein diet (protein effect); †significantly different from vehicle-treated value (rapamycin effect), 1 symbol P < 0.05; 2 symbols P < 0.01 as determined by 2-way ANOVA.
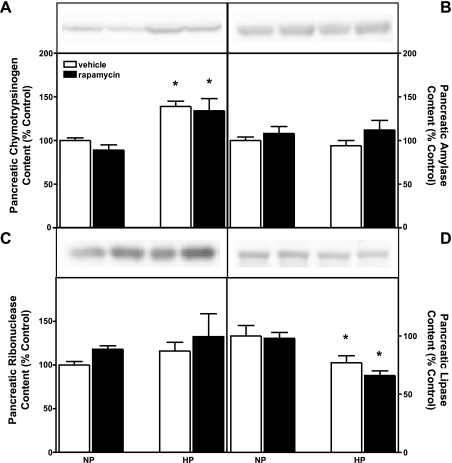
Inhibition of mTORC1 does not decrease pancreatic digestive enzyme content in CCK-null mice. The mTORC1 pathway plays a significant role in the regulation of cell growth via modulation of protein and rRNA synthesis (23, 26, 37). However, much of the protein content of pancreatic acinar cells consists of digestive enzyme zymogens, and prior results from our laboratory indicate that the mTORC1 pathway does not directly regulate the synthesis of these enzymes (6). Therefore, Western blotting was performed on pancreas samples from postabsorptive mice (i.e., collected at 9 AM without prior fasting or refeeding so as to minimize potential changes in digestive enzyme content resulting from secretion) to elucidate whether rapamycin-induced decreases in pancreatic weight are associated with decreased pancreatic digestive enzyme content. Feeding high-protein chow for 7 days was associated with a significant increase in the amount of chymotrypsin per milligram of pancreatic protein (Fig. 7A). In contrast, the amount of amylase (Fig. 7B) and ribonuclease (Fig. 7C) was unaltered, and the amount of lipase (Fig. 7D) was decreased, after feeding high-protein chow for 7 days. Rapamycin administration did not affect the amount of any of the four digestive enzymes in mice fed high-protein chow.
Fig. 7.
Effect of rapamycin administration on pancreatic digestive enzyme content in postabsorptive CCK-null mice. Relative pancreatic content of chymotrypsinogen (A), amylase (B), ribonuclease (C), and lipase (D) in mice administered vehicle or rapamycin for 7 days. NP, 140 g/kg casein chow; HP, 750 g/kg casein chow. Values represent means ± SE; n = 9–11. *Significantly different from vehicle-treated control chow value (chow effect), P < 0.05 as determined by 2-way ANOVA.
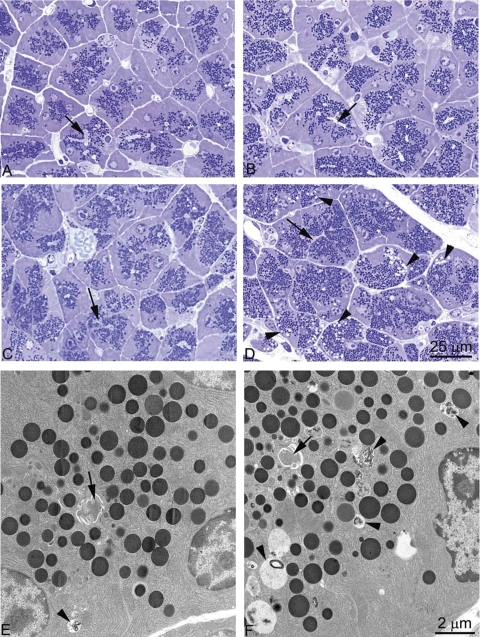
Morphologically, pancreas cellular structure was similar for mice fed either normal protein (Fig. 8A) or high-protein diet (Fig. 8B) and was not affected when rapamycin was administered to mice fed a normal-protein diet (Fig. 8C). When rapamycin was administered to mice on a high-protein diet (Fig. 8D) the zymogen granule content appeared to be increased, although this was not quantified. The striking change was the appearance of a population of vacuoles (Fig. 8D). Electron microscopy revealed that these structures were predominately autophagic vacuoles (Fig. 8F) with some structures resembling decondensing granules; vacuoles were not prominent when rapamycin was given to mice on a normal protein diet (Fig. 8E). Counting autophagic vacuoles on micrographs taken at ×4,600 showed an average of 13.3 per micrograph for rapamycin plus high protein compared with 1.3 in rapamycin plus normal protein, 1.3 for high-protein diet alone and 0.6 on normal-protein diet. The mechanism of this increase in autophagy will require further study.
Fig. 8.
Effect of dietary protein on pancreatic morphology in postabsorptive CCK-null mice. Semithin plastic sections stained with toluidine blue of Epon-embedded pancreatic tissue from mice fed 140 g/kg casein chow for 7 days (A), 750 g/kg casein chow for 7 days (B), 140 g/kg casein chow for 7 days while administered daily intraperitoneal (IP) injections of rapamycin (C), and 750 g/kg casein chow for 7 days while administered daily IP injections of rapamycin (D). Ultrathin sections stained with uranyl acetate and lead citrate of Epon embedded pancreatic tissue from mice fed 140 g/kg casein chow for 7 days while administered daily IP injections of rapamycin (E) and 750 g/kg casein chow for 7 days while administered daily IP injections of rapamycin (F). Arrows point to acinar lumens; arrowheads point to vacuoles.
DISCUSSION
Despite slight differences in diet composition, feeding protocol, and genetic background of the animals utilized, the observation in the present study that growth of the pancreas in response to a protein-enriched diet is unaltered in CCK-deficient mice is consistent with the previously published results of Lacourse et al. (20). In the present study, the weight of the pancreas in CCK-deficient mice on control diet was similar to that of wild-type mice, but the percent increases in pancreatic wet weight and protein content in response to high-protein chow were parallel between CCK-deficient and wild-type mice.
The percent increases in pancreatic wet weight, protein, and DNA content from CCK-deficient mice fed high-protein chow are remarkably similar to those observed by Morisset et al. (25) in rats fed high-protein chow. In that study however, constant infusion of the CCK receptor antagonist MK-329 (also known as L-364,718) appeared to prevent pancreatic growth entirely. Thus it is possible that CCK is necessary for dietary protein-induced pancreatic growth in rats, but not in mice. This possibility seems unlikely, however, given the finding that feeding large doses of amino acids also stimulates pancreatic hypertrophy in rats (18). In the same study by Hara et al. (18), it was shown that there is a significant increase in pancreatic weight and protein content in rats administered MK-329 and fed high-protein chow compared with those administered MK-329 and fed normal-protein chow. Importantly, the pancreatic weight and protein content of rats fed normal-protein chow and administered MK-329 was significantly less than that of rats fed normal-protein chow and administered vehicle. Because a control group infused with MK-329 was omitted in the study by Morisset et al., it is not possible to establish whether dosage and route of administration underlie the aforementioned differences in MK-329's effect on pancreatic growth, but it appears that MK-329 affects the maintenance of basal pancreatic size, not dietary protein-induced pancreatic growth. Interestingly, rats were maintained on a low-protein diet for 9 days prior to the start of experimentation in the study by Morisset et al. Such a diet might result in pancreatic atrophy (6), making it all the more likely that the observed changes in pancreatic size following MK-329 administration in the study by Morisset et al. primarily reflect changes in basal pancreatic size. Elucidating whether MK-329's effect on basal pancreatic size is due directly to CCK-receptor antagonism would be an important subject for future research. Our observation from the present study as well as previously published results (6, 20) that the weight of the pancreas from CCK-deficient mice is similar to that of age-matched controls suggest that CCK may not have a role in the development of the pancreas and establishing basal pancreatic mass. However, regeneration of the pancreas following pancreatitis is incomplete in rats lacking pancreatic CCK receptor gene expression (32). Given the possible importance of CCK during development, future studies utilizing conditional knockout mice wherein CCK deficiency is only induced at the time of high-protein feeding will be needed to confirm that CCK-independent protein-mediated pancreatic growth is not a result of adaptive growth signaling pathways initiated by CCK deficiency during development.
Previous studies have shown that oral trypsin inhibitor-induced pancreatic growth is associated with activation of the ERKs and the protein phosphatase calcineurin (34, 35). In the present study, feeding high-protein chow did not result in the activation of either p42/44 ERK or calcineurin in the pancreata of CCK-deficient mice. Activation of these pathways was not assessed in wild-type mice. Thus, although it is possible that either of these proteins may be activated in response to physiological increases in circulating CCK associated with consumption of high-protein chow, these results definitively demonstrate that their activation is not required for dietary protein-induced pancreatic growth. Otherwise, differences in pancreatic growth between CCK-deficient mice and wild-type controls would have been observed.
Oral trypsin inhibitor-induced pancreatic growth is associated with activation of the PI3K-Akt-mTORC1 pathway in the pancreas (8, 35). In the present study, feeding normal-protein chow was also associated with activation of this pathway. However, an important distinction is that consumption of normal-protein chow supplemented with trypsin inhibitor leads to chronic activation of this pathway whereas normal-protein chow alone elicits only transient activation. In contrast, feeding high-protein chow resulted in a more robust activation of mTORC1, with phosphorylation of its downstream effectors being greatly increased 4 h after the initiation of feeding (and ∼3 h after the cessation of feeding according to our own observations). Furthermore, feeding high-protein chow resulted in only a transient, and not statistically significant, increase in Akt phosphorylation. The regulation of mTORC1 has been reviewed recently (2), and it is now well established that, whereas growth factors such as insulin activate mTORC1 via upstream activation of Akt, branched-chain amino acids stimulate mTORC1 through a still poorly defined Akt-independent mechanism. Moreover, prolonged activation of mTORC1 is associated with feedback inhibition of Akt (29), which may further explain the lack of increase in Akt phosphorylation in mice fed high-protein chow. Adaptation to a protein-enriched diet results in chronically elevated plasma concentrations of the branched-chain amino acids (1). Therefore, the robust activation of mTORC1 observed in mice fed high-protein chow is undoubtedly due, at least in part, to branched-chain amino acid stimulation.
Administration of the mTORC1 inhibitor rapamycin significantly decreased pancreatic weight and RNA content in mice fed high-protein chow. These findings indicate that mTORC1 activation is necessary for dietary protein-induced pancreatic hypertrophy. Inhibition of pancreatic growth was not complete; however, this finding is not unexpected given that mTORC1 inhibition may have waned over the 24-h period between rapamycin injections. Moreover, a recent study demonstrated that mTORC1 has some rapamycin-resistant activity (36). Seemingly at odds with the conclusion that mTORC1 activation is required for dietary protein-induced growth is the observation that rapamycin administration did not significantly decrease pancreatic protein content in these mice. Given the relatively small increases in pancreatic protein content observed after feeding high-protein chow in the present study; however, inhibition of this process would need to be nearly complete to attain statistical significance. As already discussed, inhibition of mTORC1 by rapamycin is unlikely to be complete, and therefore the lack of significant change in protein content following rapamycin administration is not surprising. Moreover, unlike most tissues wherein the bulk of the cellular protein content consists of structural proteins, a large portion of pancreatic protein consists of digestive enzyme zymogens. Results from the present study, as well as our previously published results (6), demonstrate that rapamycin administration does not decrease pancreatic digestive enzyme content. Therefore, we believe that the small changes in pancreatic protein content occurring with rapamycin administration do reflect changes in pancreatic growth.
Although it is well established that consuming large amounts of dietary protein and inducing supraphysiological increases in CCK in mice fed normal amounts of dietary protein can both stimulate pancreatic growth in mice, the differences in the modes of growth between the two models have received little attention. In the latter model, pancreatic growth typically plateaus between 7 and 10 days with pancreatic weight, DNA, and protein content all having doubled (27, 35), a model of hyperplastic cell growth. The former model is also characterized by a growth plateau after 1 wk, but as demonstrated in the present study and in the study by Lacourse et al. (20), with the weight of pancreas having only increased by 35%, pancreatic protein increased by ∼75%, and pancreatic DNA increased by ∼25%. Thus dietary protein stimulates far less growth than supraphysiological CCK and occurs primarily through cellular hypertrophy.
To evaluate the effect of dietary protein in the absence of CCK we utilized CCK-null mice. In these mice, evidence for protein induced hypertrophy include an increase in protein-to-DNA ratio, a decrease in nuclear density, and the absence of a change in DNA content or BrdU incorporation. By contrast, in wild-type mice high protein would be expected to stimulate a modest increase in CCK. We believe this CCK stimulation is responsible for the increase in DNA content and the trend toward an increase in BrdU incorporation. Increased cell division would counteract an increase in cell size. Here the evidence on cell size is less conclusive. High-protein increased the protein-to-DNA ratio but had no change on the nuclear density. How this translates into cell size will require further investigation.
Differences in signal transduction pathway activation, and resultant differences in gene expression, undoubtedly underlie these very different modes of pancreatic growth. The present study illustrates some major differences in pathway activation between these modes of growth. For example, whereas activation of both mTORC1 and calcineurin is required for hyperplastic growth (8, 35), calcineurin activation is not required for hypertrophic growth. Recently, our laboratory utilized gene-array technology to identify major changes in gene expression associated with trypsin inhibitor-induced pancreatic hyperplasia (G. Gurda and J. A. Williams, unpublished data). Identifying changes in gene expression associated with dietary protein-induced pancreatic hypertrophy and comparing them with those identified in the aforementioned study will provide important insights into the regulatory mechanisms affecting pancreatic growth.
In conclusion, this study confirms that consumption of a protein-enriched diet stimulates pancreatic growth in mice and that this growth does not require CCK. We have shown that, unlike in control mice fed normal-protein chow supplemented with oral trypsin inhibitors, activation of p42/44 ERK and the protein phosphatase calcineurin does not occur in CCK-deficient mice fed high-protein chow. Feeding protein-enriched chow does, however, result in prolonged activation of mTORC1 in CCK-deficient mice. This activation does not require concomitant activation of Akt and appears to be mediated by amino acids. Moreover, we have shown that mTORC1 activation is required for dietary protein-induced pancreatic growth. Identifying additional CCK-dependent and CCK-independent signaling pathways that are required for dietary protein-induced pancreatic growth will provide important insight into how the exocrine pancreas senses and responds to dietary changes to maintain normal digestive function.
GRANTS
This work was supported by National Institutes of Health grants F32 DK-0077423 (to S. J. Crozier) and R01 DK-59578 (to J. A. Williams). Morphological analysis was provided by the combined Morphology and Image Analysis Core of the Michigan Gastrointestinal Peptide Center (P30 DK-34933) and the Michigan Diabetes Research and Training Center (P60 DK-20572).
DISCLOSURES
No conflicts of interest, financial or otherwise, are declared by the author(s).
ACKNOWLEDGMENTS
The authors sincerely thank Brad Nelson, Lauren Ginsburg, and Nancy Vogel for technical assistance and Dr. Linda Samuelson for supplying CCK-null mice.
REFERENCES
- 1.Anderson HL, Benevenga NJ, Harper AE. Associations among food and protein intake, serine dehydratase, and plasma amino acids. Am J Physiol 214: 1008–1013, 1968 [DOI] [PubMed] [Google Scholar]
- 2.Avruch J, Long X, Ortiz-Vega S, Rapley J, Papageorgiou A, Dai N. Amino acid regulation of TOR complex 1. Am J Physiol Endocrinol Metab 296: E592–E602, 2009 [DOI] [PMC free article] [PubMed] [Google Scholar]
- 3.Bentzinger CF, Romanino K, Cloetta D, Lin S, Mascarenhas JB, Oliveri F, Xia J, Casanova E, Costa CF, Brink M, Zorzato F, Hall MN, Ruegg MA. Skeletal muscle-specific ablation of raptor, but not of rictor, causes metabolic changes and results in muscle dystrophy. Cell Metab 8: 411–424, 2008 [DOI] [PubMed] [Google Scholar]
- 4.Bragado MJ, Groblewski GE, Williams JA. p70s6k is activated by CCK in rat pancreatic acini. Am J Physiol Cell Physiol 273: C101–C109, 1997 [DOI] [PubMed] [Google Scholar]
- 5.Brants F, Morisset J. Tropic effect of cholecystokinin-pancreozymin on pancreatic acinar cells from rats of different ages. Proc Soc Exp Biol Med 153: 523–527, 1976 [DOI] [PubMed] [Google Scholar]
- 6.Crozier SJ, D'Alecy LG, Ernst SA, Ginsburg LE, Williams JA. Molecular mechanisms of pancreatic dysfunction induced by protein malnutrition. Gastroenterology 137: 1093–1101, 2009 [DOI] [PMC free article] [PubMed] [Google Scholar]
- 7.Crozier SJ, Kimball SR, Emmert SW, Anthony JC, Jefferson LS. Oral leucine administration stimulates protein synthesis in rat skeletal muscle. J Nutr 135: 376–382, 2005 [DOI] [PubMed] [Google Scholar]
- 8.Crozier SJ, Sans MD, Guo L, D'Alecy LG, Williams JA. Activation of the mTOR signalling pathway is required for pancreatic growth in protease-inhibitor-fed mice. J Physiol 573: 775–786, 2006 [DOI] [PMC free article] [PubMed] [Google Scholar]
- 9.Crozier SJ, Sans MD, Lang CH, D'Alecy LG, Ernst SA, Williams JA. CCK-induced pancreatic growth is not limited by mitogenic capacity in mice. Am J Physiol Gastrointest Liver Physiol 294: G1148–G1157, 2008 [DOI] [PubMed] [Google Scholar]
- 10.Dabrowski A, Groblewski GE, Schafer C, Guan KL, Williams JA. Cholecystokinin and EGF activate a MAPK cascade by different mechanisms in rat pancreatic acinar cells. Am J Physiol Cell Physiol 273: C1472–C1479, 1997 [DOI] [PubMed] [Google Scholar]
- 11.Dembinski AB, Johnson LR. Stimulation of pancreatic growth by secretin, caerulein, and pentagastrin. Endocrinology 106: 323–328, 1980 [DOI] [PubMed] [Google Scholar]
- 12.Donella-Deana A, Krinks MH, Ruzzene M, Klee C, Pinna LA. Dephosphorylation of phosphopeptides by calcineurin (protein phosphatase 2B). Eur J Biochem 219: 109–117, 1994 [DOI] [PubMed] [Google Scholar]
- 13.Goke B, Printz H, Koop I, Rausch U, Richter G, Arnold R, Adler G. Endogenous CCK release and pancreatic growth in rats after feeding a proteinase inhibitor (camostate). Pancreas 1: 509–515, 1986 [DOI] [PubMed] [Google Scholar]
- 14.Green GM, Jurkowska G, Berube FL, Rivard N, Guan D, Morisset J. Role of cholecystokinin in induction and maintenance of dietary protein-stimulated pancreatic growth. Am J Physiol Gastrointest Liver Physiol 262: G740–G746, 1992 [DOI] [PubMed] [Google Scholar]
- 15.Green GM, Levan VH, Liddle RA. Plasma cholecystokinin and pancreatic growth during adaptation to dietary protein. Am J Physiol Gastrointest Liver Physiol 251: G70–G74, 1986 [DOI] [PubMed] [Google Scholar]
- 16.Groblewski GE, Yoshida M, Bragado MJ, Ernst SA, Leykam J, Williams JA. Purification and characterization of a novel physiological substrate for calcineurin in mammalian cells. J Biol Chem 273: 22738–22744, 1998 [DOI] [PubMed] [Google Scholar]
- 17.Gurda GT, Guo L, Lee SH, Molkentin JD, Williams JA. Cholecystokinin activates pancreatic calcineurin-NFAT signaling in vitro and in vivo. Mol Biol Cell 19: 198–206, 2008 [DOI] [PMC free article] [PubMed] [Google Scholar]
- 18.Hara H, Narakino H, Kiriyama S, Kasai T. Induction of pancreatic growth and proteases by feeding a high amino acid diet does not depend on cholecystokinin in rats. J Nutr 125: 1143–1149, 1995 [DOI] [PubMed] [Google Scholar]
- 19.Klionsky DJ, Cuervo AM, Seglen PO. Methods for monitoring autophagy from yeast to human. Autophagy 3: 181–206, 2007 [DOI] [PubMed] [Google Scholar]
- 20.Lacourse KA, Swanberg LJ, Gillespie PJ, Rehfeld JF, Saunders TL, Samuelson LC. Pancreatic function in CCK-deficient mice: adaptation to dietary protein does not require CCK. Am J Physiol Gastrointest Liver Physiol 276: G1302–G1309, 1999 [DOI] [PubMed] [Google Scholar]
- 21.Liddle RA, Green GM, Conrad CK, Williams JA. Proteins but not amino acids, carbohydrates, or fats stimulate cholecystokinin secretion in the rat. Am J Physiol Gastrointest Liver Physiol 251: G243–G248, 1986 [DOI] [PubMed] [Google Scholar]
- 22.Logsdon CD. Stimulation of pancreatic acinar cell growth by CCK, epidermal growth factor, and insulin in vitro. Am J Physiol Gastrointest Liver Physiol 251: G487–G494, 1986 [DOI] [PubMed] [Google Scholar]
- 23.Martin DE, Hall MN. The expanding TOR signaling network. Curr Opin Cell Biol 17: 158–166, 2005 [DOI] [PubMed] [Google Scholar]
- 24.McLaughlan JM. Relationship between protein quality and plasma amino acid levels. Fed Proc 22: 1122–1125, 1963 [PubMed] [Google Scholar]
- 25.Morisset J, Guan D, Jurkowska G, Rivard N, Green GM. Endogenous cholecystokinin, the major factor responsible for dietary protein-induced pancreatic growth. Pancreas 7: 522–529, 1992 [DOI] [PubMed] [Google Scholar]
- 26.Nader GA, McLoughlin TJ, Esser KA. mTOR function in skeletal muscle hypertrophy: increased ribosomal RNA via cell cycle regulators. Am J Physiol Cell Physiol 289: C1457–C1465, 2005 [DOI] [PubMed] [Google Scholar]
- 27.Niederau C, Liddle RA, Williams JA, Grendell JH. Pancreatic growth: interaction of exogenous cholecystokinin, a protease inhibitor, and a cholecystokinin receptor antagonist in mice. Gut 28: 63–69, 1987 [DOI] [PMC free article] [PubMed] [Google Scholar]
- 28.Polak P, Cybulski N, Feige JN, Auwerx J, Ruegg MA, Hall MN. Adipose-specific knockout of raptor results in lean mice with enhanced mitochondrial respiration. Cell Metab 8: 399–410, 2008 [DOI] [PubMed] [Google Scholar]
- 29.Sabatini DM. mTOR and cancer: insights into a complex relationship. Nat Rev Cancer 6: 729–734, 2006 [DOI] [PubMed] [Google Scholar]
- 30.Sans MD, Tashiro M, Vogel NL, Kimball SR, D'Alecy LG, Williams JA. Leucine activates pancreatic translational machinery in rats and mice through mTOR independently of CCK and insulin. J Nutr 136: 1792–1799, 2006 [DOI] [PubMed] [Google Scholar]
- 31.Sans MD, Williams JA. Translational control of protein synthesis in pancreatic acinar cells. Int J Gastrointest Cancer 31: 107–115, 2002 [DOI] [PubMed] [Google Scholar]
- 32.Sato T, Niikawa J, Usui I, Imamura T, Yoshida H, Tanaka S, Mitamura K. Pancreatic regeneration after ethionine-induced acute pancreatitis in rats lacking pancreatic CCK-A receptor gene expression. J Gastroenterol 38: 672–680, 2003 [DOI] [PubMed] [Google Scholar]
- 33.Schick J, Verspohl R, Kern H, Scheele GA. Two distinct adaptive responses in the synthesis of exocrine pancreatic enzymes to inverse changes in protein and carbohydrate in the diet. Am J Physiol Gastrointest Liver Physiol 247: G611–G616, 1984 [DOI] [PubMed] [Google Scholar]
- 34.Tashiro M, Dabrowski A, Guo LL, Sans MD, Williams JA. Calcineurin-dependent and independent signal transduction pathways activated with pancreatic growth. Pancreas 32: 314–320, 2006 [DOI] [PubMed] [Google Scholar]
- 35.Tashiro M, Samuelson LC, Liddle RA, Williams JA. Calcineurin mediates pancreatic growth in protease inhibitor-treated mice. Am J Physiol Gastrointest Liver Physiol 286: G784–G790, 2004 [DOI] [PubMed] [Google Scholar]
- 36.Thoreen CC, Kang SA, Chang JW, Liu Q, Zhang J, Gao Y, Reichling LJ, Sim T, Sabatini DM, Gray NS. ATP-competitive mammalian target of rapamycin inhibitor reveals rapamycin-resistant functions of mTORC1. J Biol Chem 284: 8023–8032, 2009 [DOI] [PMC free article] [PubMed] [Google Scholar]
- 37.Wang X, Proud CG. Nutrient control of TORC1, a cell-cycle regulator. Trends Cell Biol 19: 260–267, 2009 [DOI] [PubMed] [Google Scholar]


