Abstract
Phosphorylated compounds are ubiquitous in life. Given their central role, many such substrates and analogues have been prepared for subsequent evaluation. Prior to biological experiments, it is typically necessary to determine the concentration of the target molecule in solution. Here we describe a method where concentrations of stock solutions of organic diphosphates and bisphosphonates are quantified using 31P NMR spectroscopy with standard instrumentation using a capillary tube with a secondary standard. The method is specific and is applicable down to a concentration of 200 μM. The capillary tube provides the reference peak for quantification and deuterated solvent for locking.
Keywords: Bisphosphonates, diphosphates, NMR, phosphorous quantification, phosphorous analysis, pyrophosphate
Introduction
Phosphorylated compounds are ubiquitous in life. They serve as important intermediates in primary metabolism and they also function as key precursors in the biosynthesis of complex natural products. Given the central role of organophosphorous compounds, many substrates and analogues have been prepared for subsequent evaluation. Prior to biological experiments, it is typically necessary to determine the concentration of the target molecule in solution. Given that many synthetic probes are isolated in small amounts with residual salts present, gravimetric analysis is usually not the method of choice. Instead, the concentrations of the stock solutions of phosphorus containing compounds are typically measured using colorimetric methodsi,ii,iii. However, these techniques are destructive, require the use of a calibration curve, necessitate sample preparation, and reflect the total phosphorus in the sample, rather than the concentration of the compound of interest. The sample preparation also depends on the type of solvent used to dissolve the analyte.
NMR spectroscopy is a nondestructive method that allows for quantification of analyte concentrationiv,v. Internal5,vi standards are commonly used. Such a method relies on the addition of a known amount of a standard to the sample, thus altering the composition of the solution. Deuterated solvent is added to a sample or the experiment is run without the field lock. The former further alters the sample, while the later results in lower quality NMR spectra. In a related method, a peak from a standard can be added electronicallyvii, however, this requires a special type of probe.
Alternatively, externalviii,ix,x standards can be employed. In this approach a sealed tube containing a standard is added to the analyte and the NMR spectrum is recorded. This approach allows for a fast, nondestructive, accurate measurement of the concentration of the analyte. In 2002, Henderson described a method based on 31P NMR for the purity analysis of phosphorous containing military nerve agents. An important feature of that work was that it employed specialized coaxial insets and unusual TXI or QNP probeheads. Here, we extend that work and report on the use of 31P NMR spectroscopy for quantification of stock solutions of phosphorus containing organic compounds using a common broadband probe and simple capillary tubes containing an internal standard. Two classes of compounds were studied including a diphosphate and a bisphosphonate. In each case, the concentration of a secondary standard (placed within a sealed capillary tube) is first quantified by inserting the capillary into an NMR tube containing a primary standard. Next, the capillary with the secondary standard is added to the NMR tube with the analyte and the concentration of the compound in the sample of interest is quantified based on the peak ratio of the analyte and the secondary standard. The capillary tube with the phosphorus containing compound in deuterated solvent provides a reference peak in the 31P NMR spectrum and deuterium atoms for locking purposes.
Materials and methods
Preparation of the analyte, primary and secondary standards
Aqueous solutions of Na2HPO4, NaH2PO4 and Na2H2P2O7 and were prepared by dissolving the corresponding salt in deionized water and served as the primary standards. Initially, the stock solutions of primary standards (100 mL of 40 mM) were prepared. The stock solutions were diluted with deionized water to the working concentrations. Several concentrations of these standards were used with 1.0 mM, 2.0 mM, and 4.0 mM being the most commonly employed. Melting point capillary tubes (1.5–1.8 mm × 100 mm) were filled with either a 5% or 2.5% (v:v) solution of trimethylphosphate in CDCl3 or a 5% solution of H3PO4 in D2O (v:v). The capillaries were filled to a height 5–6 cm and then sealed. Solid geranyl diphosphate (GPP, 9.0 mg) was dissolved in 10 mL of deionized water. The solution was centrifuged and the supernatant was transferred to a new tube for storage.
NMR data acquisition
NMR spectra were recorded on a Varian Inova-600 instrument with a broadband probe in 8 mm NMR tubes. The capillary with the secondary standard was placed in the 8 mm tube and exactly 1.5 mL of sample was added. The sample was locked and shimmed on CDCl3 or D2O present in the secondary standard. The 90 degree pulse width (pw) of 31P was measured by acquiring an array of pw. The relaxation time was measured using an array of D1 times with an optimal pulse width. Typically 40 repetitions were used.
Data processing
Each spectrum was processed as follows. The FID was Fourier transformed with a weighting function of 1 Hz. The resulting spectrum was phased based on the peak shape. The level and tilt values were adjusted to achieve a flat integration line for the background signal. The peaks were integrated by setting the integration limits. The integration limits were set in the area where the slope of the integration line becomes noticeable.
Calibration of trimethylphosphate capillaries and determination of the concentration of GPP
A capillary with the secondary standard and exactly 1.5 mL of primary standard (NaH2PO4) was placed in an 8 mm NMR tube, locked on CDCl3, spun at 4 rotations per second, and shimmed. The NMR spectra were recorded with the following parameters: Freq = 242.837 MHz; SW=32000 Hz; At=4 s; d1=36 s; spin=4 Hz; pw90=22 us at (Power) Pwr = 54; no decoupling; line broadening (lb = 1Hz). Although 20 scans were sufficient, 40 scans were recorded. NMR: (MeO)3PO, (2.275, m, 8.3 P, J10=10.9 Hz); NaH2PO4, (0.033, s, 4.00 P). The calibration was performed using a range of concentrations of primary standards. In a typical experiment, the concentration of the GPP solution was measured by inserting the capillary with the calibrated secondary standard described above. NMR: (MeO)3PO, (2.160, m, 8.3 P, J10=10.9 Hz); GPP, (−6.965, d, 2.60 P, J2=22.6), and (−10.651, d, 2.56 P, J2=22.6) indicating a concentration of 2.6 mM. Note that spin multiplicity designated as m is 10, however, only eight peaks are usually observed, while the remaining two are not visible due to background noise
Measurement of the concentration of bisphosphonate using 31P NMR and absorbance measurement
1-hydroxy-2-(1H-imidazol-1-yl)ethane-1,1-diyldiphosphonic acid was dissolved in ammonium bicarbonate buffer and the concentration was measured using 31P as described above. NMR: (MeO)3PO, (2.160, m, 8.3 P, J10=10.9 Hz); 1-hydroxy-2-(1H-imidazol-1-yl)ethane-1,1-diyldiphosphonic acid (11.18, s, 30 P) indicating a concentration of 15 mM. The concentration of the compound was determined to be 15 mM based on the 31P NMR method. An aliquot (5.0 μL) of solution was diluted 200-fold with ammonium bicarbonate buffer and the absorbance at 210 nm and 220 nm was measured. The molar extinction coefficient of histidine (5700 M−1•cm−1 at 212 nm)xi was used for calculation of the concentration. The concentration of a solution of 1-hydroxy-2-(pyridin-3-yl)ethane-1,1-diyldiphosphonic acid was also measured using 31P NMR using the above method.
Measurement of the apparent concentration of (MeO)3PO in the capillary tube
A solution of (MeO)3PO in CDCl3 (5% v:v) was prepared. One portion of the solution was sealed in a capillary tube and the remainder was diluted 25 fold, a drop of trifluoroacetic acid was added, and 1.5 mL of the resulting solution was placed into an 8 mm NMR tube. The NMR spectrum was recorded and the peak areas were integrated. NMR (MeO)3PO, “in capillary”: (−0.188, m, 1.00 P, J10=10.9 Hz, J2=3.2 Hz); (MeO)3PO “with CF3COOH” (−1.565, broad multiplet, 1.4 P).
Sources of inaccuracies in the method
Several parameters were varied to study the possible inaccuracies of the method. The NMR tube was filled with 1.4 mL, 1.5 mL, or 1.6 mL of the primary standard (NaH2PO4 in water) and the apparent concentrations of the secondary standard (a sealed capillary with a solution of (MeO)3PO in CDCl3)were measured. The 0.20, 0.50, 0.75, 1.0, 1.5, 2.0, and 4.0 mM solutions of primary standard were used to calibrate the secondary standard. The peak ratios of the primary and secondary standards were recorded after 5, 10, 15, 20, and 40 scans. To test the influence of manual shimming and phasing, the parameters were changed until the distortions of the peak shapes were noticeable and the apparent peak ratios were recorded. The interval of the observed peak area ratios reflects the inaccuracy associated with shimming and phasing.
Results and Discussion
Selection of primary and the secondary standards
The method described here was designed to measure the concentration of organic diphosphate stock solutions in the low millimolar range. Ten to one hundred-fold dilution of such samples is typical for many biochemical applications. Thus, the primary and secondary standards were chosen to have a 31P chemical shift close to those of organic diphosphates. In order for the method to be useful, the relaxation time should be short, and the standards should be stable and easy to prepare. This will decrease the time needed to run the experiment. The two main candidates for the role of the secondary standard were solutions of H3PO4 in D2O and (MeO)3PO in CDCl3. The latter was a preferred choice due to a shorter relaxation time (10.5 s for H3PO4/D2O compared to 5.3 s for (MeO)3PO in CDCl3). Additionally, the lock quality is better in case of (MeO)3PO in CDCl3, than in case of H3PO4/D2O. The relaxation times of a 2.0 mM solution of NaH2PO4 and GPP are 0.9 s and 1.2 s, respectively. It should be noted that in NMR spectroscopy, the integrated peak area corresponds to the total number of nuclei in the vicinity of the detector. Thus, the ratio of the apparent concentration of the standard in the capillary tube to the actual concentration approximately equals the ratio of the volumes of the samples in the capillary and in the tube, respectively. However, very importantly, the exact dimensions of capillary tubes vary, some amount of secondary standard evaporates during the capillary tube sealing, and capillary tube is not positioned precisely in the center of the NMR tube unless an expensive and specialized tube is employed. As a result, the calculated apparent concentration of the secondary standard differs significantly from the measured concentration (up to 40%, see Figure 1). This is the main reason why the method described here uses two steps. In the first step, the primary standard in the bulk tube is used to calibrate the secondary standard in the capillary; the resulting secondary standard is then used to determine the concentration of the analyte solution.
Fig. 1.
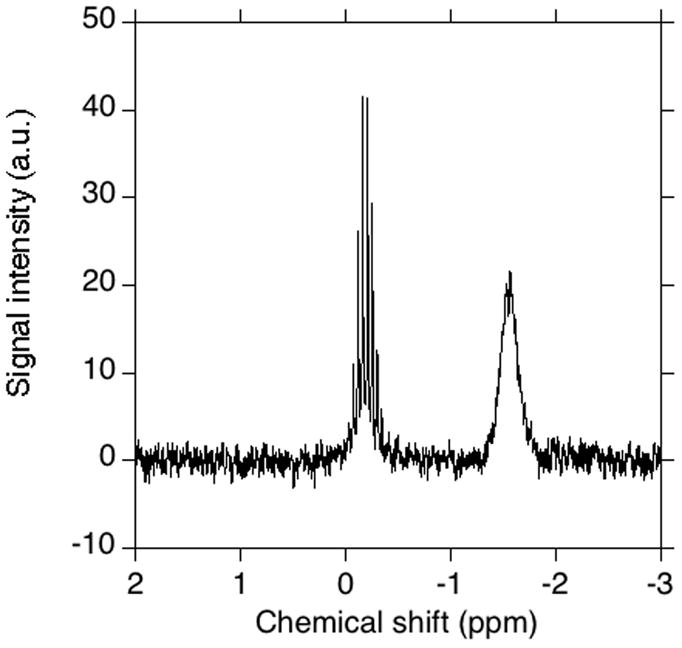
NMR analysis of a (MeO)3PO sample calculated to have equal numbers of nuclei in the bulk tube and the capillary. The sample contained a solution of (MeO)3PO and CDCl3 (1:20 v:v) in the capillary (left peak) and a solution of (MeO)3PO and CDCl3 (1:500 v:v) supplemented with 0.1% TFA in a 8 mm NMR tube.
Choice of the NMR parameters
The total relaxation time (at + d1) was set to be at least 7 times greater than the slowest relaxing nucleus, thus, at=4 s and d1=36 s were used with (MeO)3PO in CDCl3. Doubling the d1 time did not change the apparent concentration of the secondary standard. The peak ratio changes as the number of scans increases, however in 1.0 mM solutions of phosphate, the change is negligible after 20 scans. Lower concentrations of phosphate require more scans, down to the quantification limit of 200 μM. At concentrations lower than 100 μM, the required number of repetitions becomes prohibitively high. Quantification can be done in 5 mm tubes using a 5 mm broadband probe, however, this leads to a three-fold lower sensitivity.
Compounds tested using this method
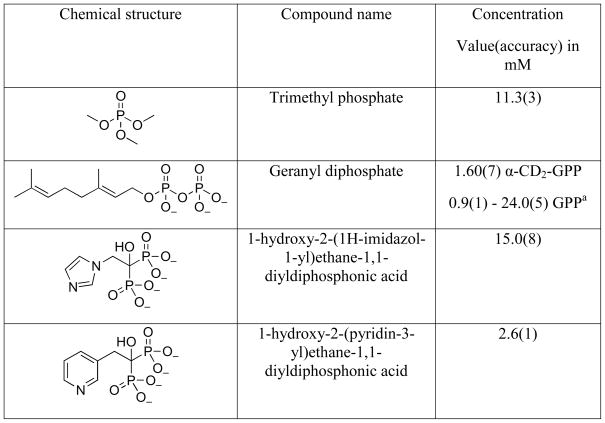
The concentrations of the solutions of four organic and three inorganic compounds were measured using this method. Inorganic compounds include Na2H2P2O7, Na2HPO4, and KH2PO4, each used as a primary standard to test if the apparent concentration of the secondary standard is independent from the type of primary standard used for calibration. The method was used to measure the concentrations of the organic compounds listed in Figure 2.
Fig. 2.
The list of organic compounds quantified using 31P NMR. aFor GPP, a number of samples were analyzed ranging in concentration from 0.9 mM to 24 mM.
Comparison with a spectroscopic method
Since 2-(1H-imidazol-1-yl)ethane-1,1-diyldiphosphonic acidxii contains an imidazole chromophore, we decided to measure the concentration using 31P NMR and absorbance and compare the results. The 31P NMR based concentration determined here was 1.5-fold higher than the absorbance based concentration. This is probably due to a difference in the molar extinction coefficients of histidine and the bisphosphonate of interest. Whereas absorbance based quantification of the compound is only possible if the compound absorbs light and the molar extinction coefficient of the compound is known. NMR based quantification does not have these limitations.
Sources of inaccuracies
The largest inaccuracy in this method is related to phasing. The phasing quality is typically judged by the peak shape, but the peak areas are more sensitive to the change in the phases, than the peak shape. Additionally, the peak shape quality is a subjective parameter. To illustrate the effect of phasing on the peak area ratios, the left and right phases were varied, and the peak area ratio was studied as a function of the phases. The results are shown in the Figure 3. The change of left and right phase by five units leads to 1.7% and 3.4% change in the peak area ratio, correspondingly. This also leads to a slight distortion of the peak shape and a moderate distortion of the integration baseline shape. Figure 4 shows the effect of phasing on peak shape in NMR spectra. The values at top show the change in left and right phases. (0;0) represents the optimal phasing.
Fig. 3.
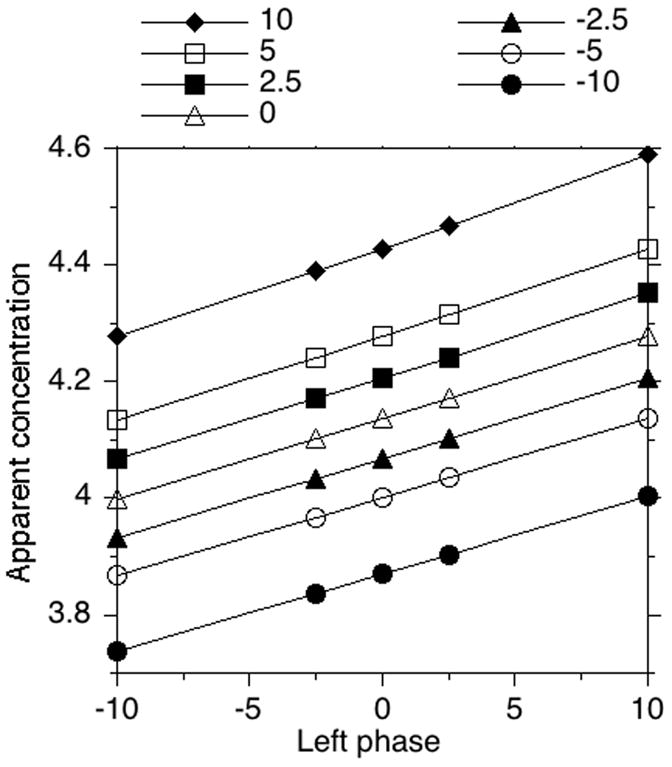
Apparent concentration of secondary standard as a function of left and right phases. Left phase change is plotted on the x axis with each line corresponding to a specific right phase value. The NMR was obtained from (MeO)3PO (4.15 mM, secondary standard in capillary) and NaH2PO4 (2.0 mM, primary standard in bulk).
Fig. 4.
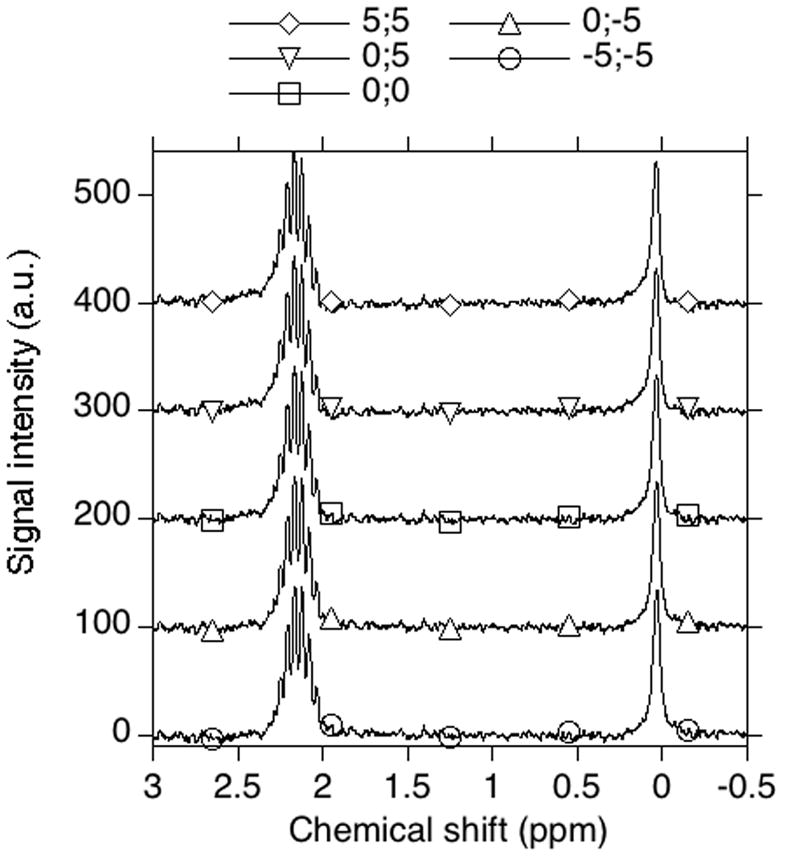
The effect of phasing on the peak shape in NMR spectra of tubes containing primary and secondary standards. The NMR spectrum of (MeO)3PO (4.15 mM, secondary standard in capillary) and NaH2PO4 (2.0 mM, primary standard in bulk) was recorded. The spectrum was processed several times with various phase settings. The values of right and left phases relative to optimal phasing are indicated by pairs of numbers separated by a semicolon (x;y). The optimal phasing is judged by the peak shape.
From these experiments, it can be seen that the ratio of peak areas varies by 5% due to phasing in reasonably phased NMR spectra. This can be reduced to 3% by careful phasing. Also, the choice of the beginning and the end of the peak affects the apparent peak ratio by 1–2%. This variation is mostly due to the background signal. Increasing the number of scans decreases the contribution of the background signal and improves the precision of the measurement. The peak area also depends on the level and tilt settings during the integration. However, even a 0.1 unit change in these variables leads to a noticeable change in the slope of a baseline that can easily be corrected. Thus, the inaccuracies associated with these variables are small. Line broadening only slightly affects the apparent concentrations. The effects of level, tilt, and line broadening are summarized in Figure 5.
Fig. 5.
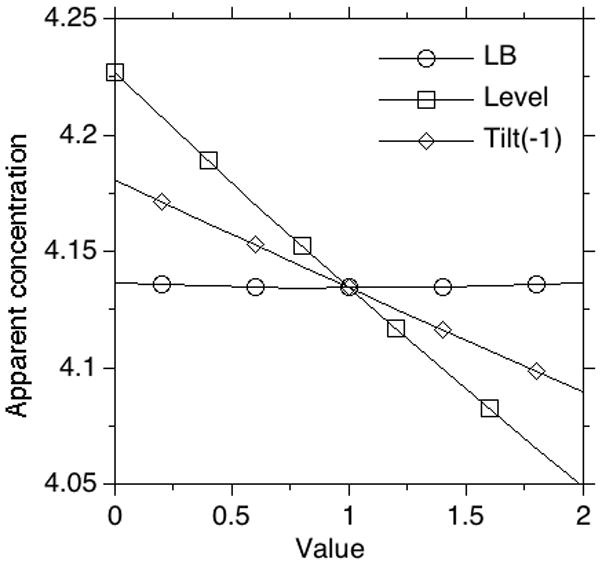
The effects of level, tilt, and line broadening (LB) on the apparent concentration. Whereas the effect of line broadening function on measured concentration is essentially nonexistant, the choice of level and tilt affect the integration but only to a very small extent. Note for line broadening, a value of 1 unit corresponds to 10 Hz.
The peak ratio (analyte to secondary standard) depends on the volume of the analyte in a nearly linear manner. This was shown by filling the NMR tube with 1.4, 1.5, and 1.6 mL of primary standard and recording NMR. Thus, pipettes were used to accurately deliver a constant sample volume (1.5 mL) and the NMR tube was gently centrifuged prior to NMR analysis to bring the sample to the bottom of the tube (especially the droplets on the walls of the NMR tube). Another form of inaccuracy originates from the heterogeneity of the sample (since the internal standard is not distributed throughout the sample) and the difference in the position of a capillary. While spinning the sample helps to decrease the impact of these problems, it does not eliminate it. This is one of the reasons why a two-step procedure was employed here. Calibrating the secondary internal standard in the capillary using a primary standard located in the NMR tube allows the problem of positioning to be eliminated.
Sample preparation time
Once the capillaries with the secondary standard are prepared, the method allows for a fast and accurate quantification of 31P in the sample. A rough estimate of the concentration with a 20% inaccuracy can be obtained at a rate 10 samples an hour if no shimming is used, the spectra are automatically phased, and the number of scans is kept low. A precise measurement requires shimming prior to each run, a larger number of scans, and accurate phasing. Typically, it takes 20 to 30 minutes to measure the concentration of a sample with 3–5% inaccuracy. This is probably at least comparable to other methods based on colorimetric reactions but it has the key advantage that it gives the concentration of the specific phosphorous-containing analyte of interest instead of only the total phosphorous present in the sample.
Relationship to earlier work and summary
As noted above, the experiment design reported here is similar to that of Henderson. However, several key changes were made that make the method more practical and easier to implement. First, the addition of deuterated solvent to the capillary tube allows for locking and shimming without altering the sample. Second, the quantification was performed using a broadband probe rather than a TXI probe head. The former is much more common then the latter in instrumentation facilities geared toward organic synthesis. Finally, we note that phasing was observed to be the major source of inaccuracy. In summary, a new fast, precise, nondestructive method of 31P concentration measurement was developed. The method allows for quantification of the 31P concentration using a sealed capillary with a secondary standard. The method is applicable for samples with a concentration of 31P down to 200 μM.
Acknowledgments
This research was supported by the National Institutes of Health Grant GM58442 (M.D.D.)
Footnotes
Publisher's Disclaimer: This is a PDF file of an unedited manuscript that has been accepted for publication. As a service to our customers we are providing this early version of the manuscript. The manuscript will undergo copyediting, typesetting, and review of the resulting proof before it is published in its final citable form. Please note that during the production process errors may be discovered which could affect the content, and all legal disclaimers that apply to the journal pertain.
References
- i.Taussky HH, Schorr E. A microcolorimetric method for the determination of inorganic phosphorus. J Biol Chem. 1953;202:675–685. [PubMed] [Google Scholar]
- ii.Baginski ES, Foa PP, Zak B. Determination of phosphate: Study of labile organic phosphate interference. Clin Chim Acta. 1967;15:155–158. [Google Scholar]
- iii.DeGroot H, DeGroot H, Noll T. Enzymic determination of inorganic phosphates, organic phosphates and phosphate-liberating enzymes by use of nucleoside phosphorylase-xanthine oxidase (dehydrogenase)-coupled reactions. Biochem J. 1985;229:255–260. doi: 10.1042/bj2300255. [DOI] [PMC free article] [PubMed] [Google Scholar]
- iv.Hatada K, Terawaki Y, Okuda H. Quantitative analysis by nuclear magnetic resonance using precision coaxial tubing. Org Magn Reson. 1977;9:518–522. [Google Scholar]
- v.Evilia RF. Quantitative NMR spectroscopy. Anal Lett. 2001;34:2227–2236. [Google Scholar]
- vi.Peterson JJ. 1H NMR analysis of mixtures using internal standards: A quantitative experiment for the instrumental analysis laboratory. J Chem Educ. 1992;69:843–845. [Google Scholar]
- vii.Akoka S, Barantin L, Trierweiler M. Concentration Measurement by Proton NMR Using the ERETIC Method. Anal Chem. 1999;71:2554–2557. doi: 10.1021/ac981422i. [DOI] [PubMed] [Google Scholar]
- viii.Fulton DB, Sayer BG, Bain AD, Malle HV. Detection and determination of dilute, low molecular weight organic compounds in water by 500 MHz proton nuclear magnetic resonance spectroscopy. Anal Chem. 1992;64:349–353. [Google Scholar]
- ix.Falk M, Seto PF, Walter JA. Solubility of domoic acid in water and in non-aqueous solvents. Can J Chem. 1991;169:1740–1744. [Google Scholar]
- x.Henderson TJ. Quantitative NMR Spectroscopy Using Coaxial Inserts Containing a Reference Standard: Purity Determinations for Military Nerve Agents. Anal Chem. 2002;74:191–198. doi: 10.1021/ac010809+. [DOI] [PubMed] [Google Scholar]
- xi.Saidel LJ. The absorption spectra of amino acids in the region two hundred to two hundred and thirty millimicrons. J Biol Chem. 1952;197:285–291. [PubMed] [Google Scholar]
- xii.Leon A, Liu L, Yang Y, Hudock MP, Hall P, Yin F, Studer D, Puan KJ, Morita CT, Oldfield E. Isoprenoid Biosynthesis as a Drug Target: Bisphosphonate Inhibition of Escherichia coli K12 Growth and Synergistic Effects of Fosmidomycin. J Med Chem. 2006;49:7331–41. doi: 10.1021/jm060492b. [DOI] [PubMed] [Google Scholar]


