Abstract
Mitochondrial inner membrane potential oscillations in cardiac myocytes synchronize under oxidative or metabolic stress, leading to synchronized whole cell oscillations. Gaining information about the temporal properties of individual mitochondrial oscillators is essential to comprehend the network's intrinsic spatiotemporal organization. We have developed methods to detect individual mitochondrial tetramethylrhodamine ethyl ester fluorescence oscillations and assess their dynamical properties using wavelet analysis. We demonstrate that these advanced signal processing tools can provide quantitative spatiotemporal information about intermitochondrial coupling. We have found that the mean frequency of selected groups of continuously oscillating mitochondria was 16.49 ± 1.04 mHz, whereas the mean frequency in the normalized mean global wavelet spectrum was 22.84 ± 1.80 mHz (n = 9 myocytes). In conclusion, this novel methodology will help shed new light on the dynamical properties of the mitochondrial network on the verge of synchronization.
Keywords: mitochondrial cluster, frequency, amplitude, mitochondrial oscillator
mitochondrial oxidative phosphorylation depends on the vectorial arrangement of ion transporters, pumps, and channels in a selectively permeable inner membrane that enables highly regulated adjustments of mitochondrial volume, inner mitochondrial membrane potential (ΔΨm), and redox potential (6) to fine tune the balance of energy supply and demand. These cyclical changes in energy state are tightly coupled to the activation and deactivation of ATP-sensitive potassium currents to alter the electrophysiology and Ca2+-handling properties of the myocyte (17).
Such complex biological systems are often characterized by heterogeneous regulatory mechanisms and nonlinear behavior; therefore, to obtain spatial and temporal organization, living systems use biochemical rhythms to achieve internal coordination (3, 9, 16, 26). For instance, mitochondria in the cardiac myocyte under the influence of substrate deprivation or oxidative stress may undergo a transition into a pathophysiological state where their inner membrane potential ΔΨm depolarizes and oscillates (2, 5, 6). Synchronization of these weakly coupled mitochondrial oscillators leads to cell-wide synchronized oscillations (17).
Contemporary methods to examine these networks of oscillators have focused on power spectral analysis and relative dispersional analysis (2, 5–7) of mesh components of lattice-like grids, with mesh sizes of mitochondrial magnitude that have been superimposed on the cardiac myocyte.
In this article, we present a novel method for detecting and characterizing single ΔΨm oscillations and we demonstrate that oscillating mitochondria exhibit dynamically changing frequencies.
METHODS
This study was conducted following approval from the Johns Hopkins University Animal Care and Use Committee and in accordance with guidelines established in the Guide for the Care and Use of Laboratory Animals, published by the National Institutes of Health (NIH Publication No. 85-23, Revised 1996).
Experiments were carried out on freshly isolated adult guinea pig ventricular myocytes at 37°C, using protocols that were previously described (17). ΔΨm was monitored with the cationic potentiometric fluorescent dye tetramethylrhodamine ethyl ester (TMRE) (4). Images were recorded using a two-photon laser-scanning microscope (MRC-1024MP, Bio-Rad) with excitation at 740 nm (Tsunami Ti:Sa laser, Spectra-Physics).
Individual Mitochondria TMRE Signals
Formulation and application of mitochondrial grid.
Qualitatively, for each myocyte, in a stack of TMRE fluorescent images recorded at a rate of dt, the onset of overall TMRE oscillations was identified as the first image with a 10% TMRE intensity loss relative to the mean TMRE intensity averaged over all previous images. Subsequent images were then divided into equally sized intervals consisting of n images with n taken such that n·dt was smaller or equal to the smallest period of all TMRE oscillations.
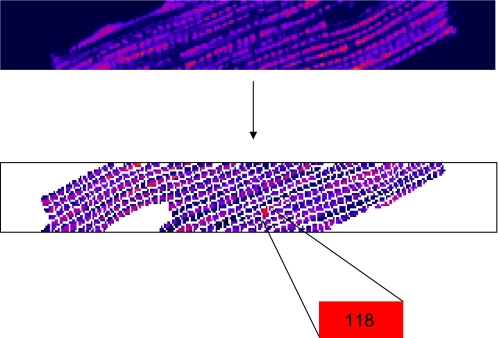
Thereafter, an average image from each sequence of n images was formed and all such averaged images were uploaded into Adobe Photoshop v. 7.0. The average image with the highest TMRE fluorescence intensity was used to manually constructed a grid on a pixel-by-pixel basis, serving henceforth as a template grid. To eliminate the effects of nontranslational movement, 1) myocytes with considerable nontranslational movement were identified and not included in the analysis; 2) mitochondria consisted of 34.38 ± 15.04 pixels (N = 9 myocytes), and the translational movement we encountered never exceeded two pixels at a time; and 3) signals of mitochondria with a very small number of pixels usually were both rare and noisy and hence could not be treated as oscillating mitochondria. Furthermore, numerical identifiers for each element of the mesh, i.e., for single mitochondria within the myocyte, were selected (Fig. 1).
Fig. 1.
Identification of single mitochondria in cardiac myocytes. Single mitochondria of a myocyte are identified and labeled within a hand-drawn grid of an averaged stack of images in time.
Individual mitochondrial membrane potentials.
The overall shift of the myocyte in x- and y-direction of each averaged image was marked in ImageJ (v. 1.40g), and the template grid as a whole was shifted accordingly, thus providing an interval-independent mesh for each mitochondrion. To finally obtain TMRE intensities of single meshes, the TMRE intensity in each mesh was averaged over all pixels therein.
Frequencies of Oscillating Mitochondria
Wavelet analysis.
Biological systems are usually nonstationary in time, demonstrating irregular complex and dynamic behavior (18, 19). Nevertheless, the application of standard methods of statistical analysis on such nonstationary systems works if the nonstationarity is associated only with the low-frequency portion of the power spectrum relative to the frequencies of interest.
With no a priori knowledge of whether mitochondrial oscillations are stationary, the wavelet transform (11, 12) has been used to determine the oscillation frequencies of individual mitochondria. Wavelets have already been extensively applied in nonstationary biological signals (18, 24). As a form of time-frequency representation, the wavelet transform expands signals in terms of wavelets by breaking the signal down into different scale components. Starting from an analyzing wavelet function (“mother wavelet”), all wavelets are constructed from the analyzing wavelet via translations and dilations (“daughter wavelets”).
In this study, the wavelet transform was applied in each mitochondrion TMRE signal using the Morlet wavelet in MATLAB v. 7.1.0.246 (R14) (Fig. 2). The Morlet wavelet was preferred to other wavelet forms (e.g., Mexican hat and Paul wavelet) for its higher frequency resolution. Fixed parameters were chosen to avoid time-consuming calculations: 1) the spacing between scales was set to dj = 0.1, 2) the smallest possible period for the detection of one oscillation (4dt, dt being the sampling period) being the smallest scale of wavelets s0, and 3) the overall number of scales was j1 = log2(N/s0)/dj + 1, where N is the total number of the recorded images. This results in a scale range from s0 to , each scale having dj suboctaves. Cutoff frequencies were chosen according to the mean TMRE intensity plot: the longest period T of a synchronized oscillation of the ith image was used to determine vmini = 1/1.1T as the minimum frequency, and similarly, vmaxi = 1/s0 defines the maximum cutoff frequency.
Fig. 2.
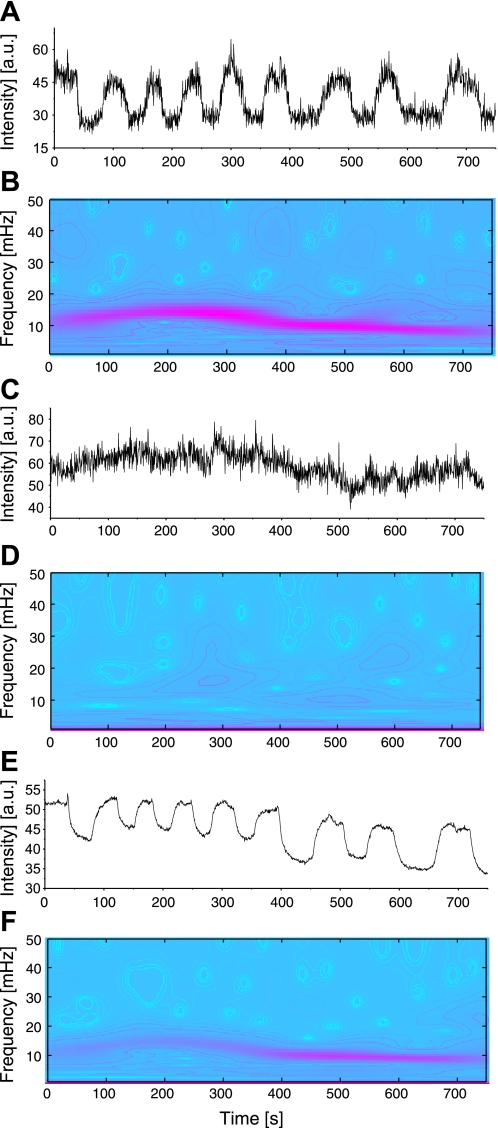
Wavelet analyses of mitochondrial signals. A, C, and E: tetramethylrhodamine ethyl ester (TMRE) signals for one single oscillating mitochondrion, one single nonoscillating mitochondrion, and the mean TMRE signal for the whole myocyte, respectively. B, D, and F: the corresponding absolute squared wavelet transform over frequency and time marks the changes in frequency over time of the oscillating mitochondrion and of the myocyte's TMRE oscillations. AU, arbitrary units.
The mitochondrial fluorescence signals were then normalized by their respective standard deviations. The numbers of time series images for each mitochondrial signal were further padded with zeros to the next power of two, therefore preventing a wraparound from the end of the time series to the beginning. This also accelerates the fast Fourier transform that is used in the wavelet transform. With the use of segments of 0.1 mHz, power line plots between vmini and vmaxi were interpolated for every wavelet scale and for each image and mitochondrion, respectively. The frequency at maximum power of the interpolated line plot was determined, and thus a plot of maximal scale frequencies over time was generated for each mitochondrion.
Statistics
The wavelet analysis and fitting routines were obtained using MATLAB v. 7.1.0.246 (R14). Further statistics were performed using OriginPro 8 SR0 v. 8.0724 (B724).
RESULTS
Single mitochondria of a cardiac myocyte were identified and labeled within a hand-drawn grid of a stack of images averaged over time (Fig. 1). Wavelet analysis clearly shows the difference in frequency content of the respective TMRE signal of an oscillating and a nonoscillating mitochondrion (Fig. 2, A–D). The relation between the mean TMRE signal of the whole myocyte and oscillating mitochondria is also visible (Fig. 2, E and F).
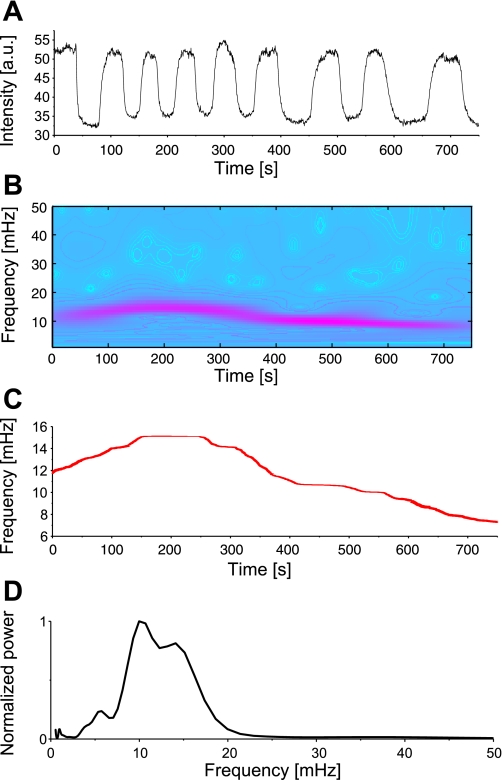
Thus wavelet analysis can be used to distinguish between oscillating and nonoscillating mitochondria. In fact, for a given interval of images, mitochondrial TMRE time plots were scanned to determine whether they exhibited features of an onset of depolarization (marked by an overall drop of 10% or more of the TMRE intensity), no depolarization, or oscillations right from the beginning. Only TMRE plots with continued depolarizations, i.e., with repeating depolarizations and repolarizations, were taken into account in Fig. 3, A and B. The same above-mentioned criteria were used to determine a baseline from images before the first depolarization onset. Accordingly, continuously oscillating mitochondria were selected and grouped, and the wavelet analysis was applied (Fig. 3, A and B) on their mean TMRE signal (N = 79 mitochondria).
Fig. 3.
Frequency analysis of oscillating mitochondria. A and B: mean TMRE signal and corresponding wavelet analysis of a selected group of oscillating mitochondria (N = 79). C: average maximum frequency over time. D: global wavelet spectrum of the same group normalized to its maximum value. In this example, the mean maximal mitochondrial frequency fluctuates between 7 and 15 mHz over time. Peaks in the global wavelet spectrum indicate preferred mitochondrial oscillation frequencies.
In addition, for each such oscillating mitochondrion, the graphs yielding maximal scale frequencies over time were averaged over the whole group of oscillating mitochondria (Fig. 3C, exemplary for one cell), and thus their time-changing frequency content could be compared with that of the normalized global wavelet spectrum [the average wavelet spectra over all times (21)]. In Fig. 3D, the mean frequency of the oscillating group of mitochondria over the considered time interval was 11.68 ± 2.5 mHz, whereas the mean frequency of the global wavelet spectrum was 10.80 ± 1.8 mHz.
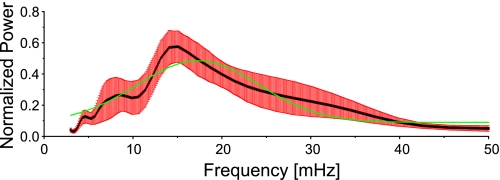
Similarly, all continuously oscillating mitochondria of N = 9 cardiac myocytes and their respective maximal scale frequencies over time were determined, and the global wavelet spectra between 3 and 50 mHz, normalized to their respective maximum values, were determined (Fig. 4). Overall, the mean frequency of the oscillating group of mitochondria was 16.49 ± 1.04 mHz, whereas the mean frequency of the global wavelet spectrum was 22.84 ± 1.80 mHz. However, the Gaussian fit of the global wavelet spectrum peaks at 17.24 ± 4.2 mHz, demonstrating that both approaches provide similar values of the average mitochondrial oscillation frequency.
Fig. 4.
Mean global wavelet spectrum for selected groups of continuously oscillating mitochondria (N = 9 myocytes): mean in black and SE error bars in red. The mean frequency is 23 mHz, and the Gaussian fit (in green) peaks at about 17 mHz.
DISCUSSION
Under oxidative stress, the imbalance between reactive oxygen species (ROS) generation and ROS scavenging of individual cardiac mitochondria results in a destabilization of ΔΨm for a significant portion of the mitochondrial network (∼60%) (7), which forces the network to oscillate synchronously. The proposition of the presence of individual mitochondrial oscillators considers that these oscillators are weakly coupled in the physiological state, when ROS levels are low, and are strongly coupled in the pathophysiological state, when ROS levels are high. The proposed coupling mechanism that involves ROS-induced ROS release (4) and is mediated by ROS diffusion has recently received further experimental and theoretical support (27).
We have found that the global wavelet spectrum of oscillating mitochondria exhibits preferred frequencies (Fig. 3D): frequencies with maximum power indicate either small subpopulations of mitochondria oscillating at different frequencies or a large population of mitochondria that changes its oscillation frequency in time. Technically, both assumptions can be true at the same time, considering that in many disparate examples of physical and chemical coupled oscillators, synchronization of the system generally arises from an initial nucleus of (spontaneously) synchronized oscillators that integrate neighboring oscillators, therefore increasing the size and signal amplitude of the initial oscillatory nucleus (13, 22, 23, 25) within the myocyte. Neighboring this nucleus, subpopulations of mitochondria that oscillate at different frequencies will hence be integrated and synchronized with the mitochondria of the initial nucleus and therefore change the overall TMRE fluorescence frequency behavior of the cardiac myocyte.
The change of the oscillations frequency exhibited by individual mitochondria depends on the balance between superoxide efflux through the inner mitochondrial membrane anion channels and the intracellular ROS scavenging capacity. Both play a key role in the oscillatory mechanism: in the oscillatory regime, mitochondria behave as relaxation oscillators, composed of both slow (the ROS buildup in the mitochondrial matrix) and fast (the inner mitochondrial membrane anion channel opening and rapid ROS release) processes (10). The balance of ROS determines not only whether or not a mitochondrion oscillates but also the frequency and amplitude of the mitochondrial oscillator (5).
If we consider that the selected mitochondria (which oscillate throughout the recording) show a change in the mean maximal mitochondrial oscillation frequency over time, the preceding considerations indicate that intermitochondrial coordination processes influence the dynamic mitochondrial frequency behavior. It has been shown (5) that the process of spontaneous synchronization of the whole mitochondrial network resembles a global phase transition at its percolation threshold; when the amount of mitochondria in a cluster of synchronously oscillating mitochondria surpasses a critical threshold, spontaneous synchronization of the whole network sets in. This synchronization corresponds to the transition of the weakly coupled mitochondrial network in the physiological state to the strongly coupled network in the pathophysiological state, with significant effects on myocyte excitability (17) and cardiac function (1). Such network behavior obeys, under normal conditions, fractal, self-similar dynamics (4, 9, 13) where different frequencies occur over multiple time scales.
Presumably, the oscillating mitochondria in Fig. 3C represent the already synchronized initial nucleus of excited mitochondria since the standard error of maximal frequency change (red error bars in Fig. 3C) is very small. Recruiting more and more mitochondria into this initial cluster of oscillating mitochondria, i.e., late onset of mitochondrial depolarizations, would therefore lead not only to changes in spatial organization of the excited mitochondria but also to changes in their temporal organization, i.e., a change in frequency of individual mitochondrial oscillations and, consequently, a change in frequency of the network itself.
Static and dynamic heterogeneity of cardiac myocyte mitochondria are due to morphological and functional differences of mitochondria (14, 15). Especially the latter becomes important under metabolic (20) and oxidative stress since network instabilities may scale up to whole myocyte and even whole organ function, possibly contributing to the generation of fatal ventricular arrhythmias (1, 7, 8).
In summary, in this article we present a wavelet-based method to characterize the temporal organization of individual mitochondrial oscillations of a heterogeneous mitochondrial network in the pathophysiological regime. This novel approach of identifying individual mitochondria and assigning to their respective fluorescence intensity a time-dependent frequency is an essential tool in examining the spatiotemporal characteristics of a network of coupled mitochondrial oscillators, such as coupling, coherence, and synchronization properties. It provides the possibility to quantitatively study an intracellular network with methods of network and synchronization analysis and may contribute to the development of new computational models of mitochondrial network behavior.
GRANTS
The work was supported by an American Heart Association Scientist Development Grant 0635127N; by National Institutes of Health Grants R37-HL-54598, 1R21-AG-035128, and 1RO1-HL-103961; by the Cardiovascular Research Society; and by a fellowship from the Boehringer Ingelheim Fonds.
DISCLOSURES
No conflicts of interest, financial or otherwise, are declared by the author(s).
REFERENCES
- 1.Akar FG, Aon MA, Tomaselli GF, O'Rourke B. The mitochondrial origin of postischemic arrhythmias. J Clin Invest 115: 3527–3535, 2005 [DOI] [PMC free article] [PubMed] [Google Scholar]
- 2.Aon MA, Cortassa S, Akar FG, O'Rourke B. Mitochondrial criticality: a new concept at the turning point of life or death. Biochim Biophys Acta 1762: 232–240, 2006 [DOI] [PMC free article] [PubMed] [Google Scholar]
- 3.Aon MA, Cortassa S, Lloyd D. Chaotic dynamics and fractal space in biochemistry: simplicity underlies complexity. Cell Biol Int 24: 581–587, 2000 [DOI] [PubMed] [Google Scholar]
- 4.Aon MA, Cortassa S, Marban E, O'Rourke B. Synchronized whole cell oscillations in mitochondrial metabolism triggered by a local release of reactive oxygen species in cardiac myocytes. J Biol Chem 278: 44735–44744, 2003 [DOI] [PubMed] [Google Scholar]
- 5.Aon MA, Cortassa S, O'Rourke B. The fundamental organization of cardiac mitochondria as a network of coupled oscillators. Biophys J 91: 4317–4327, 2006 [DOI] [PMC free article] [PubMed] [Google Scholar]
- 6.Aon MA, Cortassa S, O'Rourke B. Mitochondrial oscillations in physiology and pathophysiology. Adv Exp Med Biol 641: 98–117, 2008 [DOI] [PMC free article] [PubMed] [Google Scholar]
- 7.Aon MA, Cortassa S, O'Rourke B. Percolation and criticality in a mitochondrial network. Proc Natl Acad Sci USA 101: 4447–4452, 2004 [DOI] [PMC free article] [PubMed] [Google Scholar]
- 8.Aon MA, O'Rourke B, Cortassa S. The fractal architecture of cytoplasmic organization: scaling, kinetics and emergence in metabolic networks. Mol Cell Biochem 256–257: 169–184, 2004 [DOI] [PubMed] [Google Scholar]
- 9.Aon MA, Roussel MR, Cortassa S, O'Rourke B, Murray DB, Beckmann M, Lloyd D. The scale-free dynamics of eukaryotic cells. PLoS One 3: e3624, 2008 [DOI] [PMC free article] [PubMed] [Google Scholar]
- 10.Cortassa S, Aon MA, Winslow RL, O'Rourke B. A mitochondrial oscillator dependent on reactive oxygen species. Biophys J 87: 2060–2073, 2004 [DOI] [PMC free article] [PubMed] [Google Scholar]
- 11.Grossmann A, Morlet J. Decomposition of hardy functions into square integrable wavelets of constant shape. SIAM J Math Anal 15: 723–736, 1984 [Google Scholar]
- 12.Grossmann A, Morlet J, Paul T. Transforms associated to square integrable group representations. I. General results. J Math Phys 26: 2473–2479, 1985 [Google Scholar]
- 13.Kuramoto Y. Chemical Oscillations, Waves, and Turbulence. Berlin: Springer-Verlag, 1984 [Google Scholar]
- 14.Kuznetsov AV, Mayboroda O, Kunz D, Winkler K, Schubert W, Kunz WS. Functional imaging of mitochondria in saponin-permeabilized mice muscle fibers. J Cell Biol 140: 1091–1099, 1998 [DOI] [PMC free article] [PubMed] [Google Scholar]
- 15.Kuznetsov AV, Usson Y, Leverve X, Margreiter R. Subcellular heterogeneity of mitochondrial function and dysfunction: evidence obtained by confocal imaging. Mol Cell Biochem 256–257: 359–365, 2004 [DOI] [PubMed] [Google Scholar]
- 16.Mazloom A. Modeling a complex biological network with temporal heterogeneity: cardiac myocyte plasticity as a case study. Complex 1: 467–486, 2009 [Google Scholar]
- 17.O'Rourke B, Ramza BM, Marban E. Oscillations of membrane current and excitability driven by metabolic oscillations in heart cells. Science 265: 962–966, 1994 [DOI] [PubMed] [Google Scholar]
- 18.Pavlov AN, Makarov VA, Mosekilde E, Sosnovtseva OV. Application of wavelet-based tools to study the dynamics of biological processes. Brief Bioinform 7: 375–389, 2006 [DOI] [PubMed] [Google Scholar]
- 19.Refinetti R. Non-stationary time series and the robustness of circadian rhythms. J Theor Biol 227: 571–581, 2004 [DOI] [PubMed] [Google Scholar]
- 20.Romashko DN, Marban E, O'Rourke B. Subcellular metabolic transients and mitochondrial redox waves in heart cells. Proc Natl Acad Sci USA 95: 1618–1623, 1998 [DOI] [PMC free article] [PubMed] [Google Scholar]
- 21.Si BC, Farrell RE. Scale-dependent relationship between wheat yield and topographic indices—a wavelet approach. Soil Sci Soc Am J 68: 577–587, 2004. [Google Scholar]
- 22.Strogatz S. The Emerging Science of Spontaneous Order. New York: Hyperion, 2003 [Google Scholar]
- 23.Strogatz S. From Kuramoto to Crawford: exploring the onset of synchronization in population of coupled oscillators. Physica D 143: 1–20, 2000 [Google Scholar]
- 24.Walnut DF. An Introduction to Wavelet Analysis. Boston: Birkhäuser Boston, 2001, p. 472 [Google Scholar]
- 25.Winfree A. Biological rhythms and the behavior of populations of coupled oscillators. J Theor Biol 16: 15–42, 1967 [DOI] [PubMed] [Google Scholar]
- 26.Yates FE. Self-Organizing Systems. Oxford: Oxford University Press, 1993, p. 189–218 [Google Scholar]
- 27.Zhou L, Aon MA, Almas T, Cortassa S, Winslow RL, O'Rourke B. A reaction-diffusion model of ROS-induced ROS release in a mitochondrial network. PLoS Comput Biol 6: e1000657, 2010 [DOI] [PMC free article] [PubMed] [Google Scholar]


