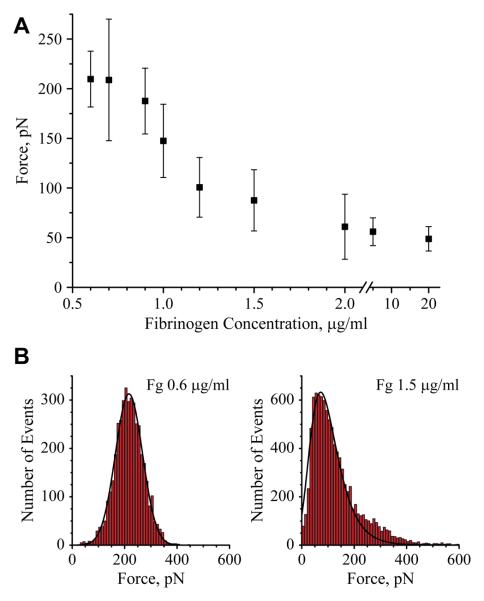
Figure 3.
Force spectroscopy analyses of fibrinogen substrates. (A) The most probable adhesion forces between an unmodified AFM tip and fibrinogen plotted as a function of the fibrinogen coating concentration adsorbed on mica. (B) Histograms with Gaussian fits of adhesion forces for selected (0.6 and 1.5 μg/ml) concentrations of fibrinogen deposited on mica. The data shown are means and standard deviation from 3-5 experiments with 20000-60000 force-distance curves collected from the force maps generated for each concentration of fibrinogen. The data for the substrate prepared by adsorption of 20 μg/ml fibrinogen were collected from 2 experiments in which 8000 force-distance curves were analyzed.

