

Abstract
Aim
To determine whether depression and family history of alcoholism are associated with heightened sweet preferences in children, before they have experienced alcohol or tobacco and at a time during the life-span when sweets are particularly salient.
Design
Between- and within-subject experimental study.
Participants
Children, 5–12 years old (n = 300), formed four groups based on family history of alcohol dependence up to second-degree relatives [positive (FHP) versus negative (FHN)] and depressive symptoms as determined by the Pictorial Depression Scale [depressed (PDEP) versus non-depressed (NDEP)].
Measurements
Children were tested individually to measure sucrose preferences, sweet food liking and, for a subset of the children, the analgesic properties of sucrose versus water during the cold pressor test.
Findings
The co-occurrence of having a family history of alcoholism and self-reports of depressive symptomatology was associated significantly with a preference for a more concentrated sucrose solution, while depressive symptomatology alone was associated with greater liking for sweet-tasting foods and candies and increased pain sensitivity. Depression antagonized the analgesic properties of sucrose.
Conclusions
While children as a group innately like sweets and feel better after eating them, the present study reveals significant contributions of family history of alcoholism and depression to this effect. Whether the heightened sweet preference and the use of sweets to alleviate depression are markers for developing alcohol-related problems or responses that are protective are important areas for future research.
Keywords: Analgesia, children, depression, family history of alcoholism, sweet liking, sweet preferences, sweet taste
Introduction
For children, the general rule seems to be the sweeter the better, a preference that evolved to attract children to sources of nutrition during periods of maximal growth [1,2]; but sweet taste is much more than a signal for calories [3]. When placed in the mouth, sweet taste can blunt expressions of pain, presumably via the endogenous opioid system [4,5], highlighting its potent rewarding properties.
At some time during adolescence, the intensity of sweetness most preferred declines to levels preferred by adults [6]. Of course, these age-related changes refer to adolescents as a group, and some teenagers and adults retain the preferences for high-intensity sweetness, which is characteristic of children [6]. Interestingly, such developmentally related declines in preferred sweetness may represent behavioral correlates of developmentally related changes in dopamine brain pathways [7].
Whether a food tastes sweet and the emotions experienced upon ingestion are complex processes mediated by taste receptors in the periphery and by multiple brain substrates, which are remarkably well conserved phylogenetically [8,9]. Emerging evidence suggests that the brain circuitry involved in the hedonic impact of sweet taste relates to circuitry involved in addictions. For example, like tasting something sweet, drinking alcohol activates pleasure-generating loci in the brain associated with reward (see [10]). Thus, alcohol may be co-opting neural pathways designed originally for seeking sweet tastes [11], our oldest natural reward [12]. Further, the sweet appetite appears to be related to alcohol appetite. Not only is more pleasure derived from eating sweets, which are craved more during early stages of abstinence [13–15], but consumption of candy and refined sugar is related inversely to alcohol intake [16–18], a finding reminiscent of the food trends that occurred during Prohibition when consumption of foods containing refined sugar soared [19].
Animal and human research has focused upon sweet preference as a potential phenotypic marker for genetic vulnerability for alcoholism. While animal models show that greater ethanol intake among some rodent strains and within their segregating crosses depends in part upon the hedonic attractiveness of sweet taste [20–22], data from humans conflict. Some [23,24], but not all [25,26], human studies have found that non-alcohol-dependent men and women with a family history of alcoholism preferred a more concentrated sucrose solution than did those without such history. The intensity of sweetness preferred was characteristic of levels preferred typically by children [6,12].
The discrepancies among research studies on adults could be due to several factors, including not controlling for potentially confounding factors such as prior drinking history or comorbid conditions that are more prevalent in adults with a family history of alcoholism [27]. For example, both tobacco usage and affective illnesses, such as depression, exhibit similar inverse relationships with sweet food liking [28,29], leading some to speculate that nicotine-addicted and depressed individuals seek out sweets to alleviate feelings of withdrawal and dysphoria, respectively. Also, the wide age range of subjects in some of the studies is problematic because sweet preference decreases with age [6,30,31].
In the present study we tested young children before they experienced alcohol or tobacco, which alleviates many methodological issues and addresses important questions related to individual differences in sweet preferences and the analgesic effects of sugars at an age when sweets are particularly salient.
Methods
Subjects
Mothers with children aged between 5 and 12 years were recruited for a research study on taste preferences from flyers and advertisements in local newspapers and parent magazines in Philadelphia, PA. During the telephone interview, mothers were given detailed descriptions of the study procedures but were not told the goals of the study and hypotheses being tested; nor were they recruited based on the incidence of family history of alcohol abuse. The study population consisted of 300 healthy, non-diabetic children (175 girls, 125 boys), 8.2 ± 0.1 years of age, and their mothers. Their race/ethnicity, based on maternal reports of the racial background of both parents (49.7% black, 32.3% white, 0.7% Hispanic, 0.7% Asian, 16.3% mixed race/ethnicity and 0.3% unknown), family yearly income level (26% < $20 000, 37% $20 000–50 000, 30% $50 000–100 000, 3% > $100 000, 4% unknown) and highest level of education for the mother (39% high school or technical school, 35% some college, 17% college graduates, 9% graduate/advanced degree), reflected the racial and socio-economic diversity of the Philadelphia area. Mothers were paid for their participation.
Family history of alcoholism and child depressive symptoms
The children were grouped according to their family history of alcoholism (FH) and depressive symptoms (DEP). Mothers completed the Michigan Alcohol Screening Test to screen for life-time alcohol-related problems and alcoholism [32] and the family history assessment module of the Structured Assessment of the Genetics of Alcohol for every biological member up to second-degree relatives for both maternal and paternal sides of the child's family [33,34]. Because categorizing FH based on only first-degree relatives is too narrow a criterion [35,36], we grouped children who had a first- or second-degree relative with a life-time diagnosis of DSM-III alcohol dependence as having a positive FH (FHP), and those who did not have any relatives in the two generations with current or previous alcohol dependence as having a negative FH (FHN).
Children were administered the 23-item Pictorial Depression Scale (PDS), a forced-choice, self-rating scale [37,38], to assess presence or absence of depressive symptoms (e.g. feelings of loneliness, lack of enjoyment of games, problems with sleeping or attention). The PDS was adapted from the Children's Depression Inventory developed by Kovacs [39] and has been validated for use with children as young as 4 years of age. It consists of pictures of two side-by-side, identical children corresponding to the sex and race of the child, with neutral facial expressions. Pairs of statements, one of which reflects depressive symptomatology, are recited to the child; for example: ‘This child feels sad’ and ‘This child does not feel sad’. The child is then asked to point to the figure that is most like him/her. The order of presentation of negative versus positive statements is counterbalanced to eliminate response bias. Using a cut-off of >10, the PDS distinguished between depression and non-depression in a sample of child in-patients [38]. We grouped children with a PDS score ≥10 as exhibiting positive DEP (PDEP) and <10 as non-depressed (NDEP) [37]. To corroborate children's self-reports of depression, each mother completed a 25-item scale that measured child temperament [40].
Sixty-one additional children were excluded because they or one of their parents was adopted (n = 9), there was insufficient information on some family members to determine FH (n = 46) or the child did not complete or understand the tasks (n = 6). All testing procedures were approved by the Office of Regulatory Affairs at the University of Pennsylvania. Informed consent was obtained from each mother, and assent was obtained from each child who was 7 or more years of age.
Phenotyping for sucrose preferences, sweet food liking and sucrose analgesia
Children were tested individually following a 1-hour fast in a closed room designed specifically for sensory testing. Using methods embedded in the context of games and developed to meet the communicative, cognitive and behavioral capacities of pediatric populations, we phenotyped children in three ways. First, we determined the level (intensity) of sweetness preferred by using a forced-choice tracking technique [41,42], which has been shown to be related to the intensity of sweetness children prefer in cereals and beverages in the real world [31]. In brief, subjects were presented with pairs of solutions that differed in sucrose concentration (3%, 6%, 12%, 24%, 36% wt/vol). Subjects tasted, without swallowing, each solution and then pointed to which of the pair they liked better. The procedure continued until the subject either chose a given concentration of sucrose when it was paired with both a higher and a lower concentration or chose the solution with the highest or lowest concentration two consecutive times. We then repeated the entire task and used the geometric mean of the two chosen sucrose concentrations as the intensity of sucrose most preferred (‘sucrose preference’).
Secondly, we determined children's liking for sweet foods in daily life. Because children often answer in the affirmative, we developed a forced-choice procedure to query children directly about their food likes/choices (see [5]). In brief, children were presented with pictures of two side-by-side, identical figures with neutral facial expressions and were told that the children in the picture look the same but like different things. Five pairs of food items were then recited, and the child was told that one of the figures liked one of the pair, whereas the other figure liked the other. The child was then asked to point to the figure in the picture that was most like her/him. The pairs, recited in counterbalanced order, included different food items, with one item considered to have a sweet taste and the other a salty/savory taste (ice cream versus potato chips, cookies versus pretzels, pancakes versus bacon, candy versus Doritos, dessert versus salty snack). Children were also asked whether they liked to add sugar to their cereal. From these data, a sweet food liking score was calculated (range: 0–6; higher numbers reflect greater sweet food liking). Children also named their favorite candy.
Thirdly, the analgesic properties of intra-oral sucrose were assessed with a cold pressor test for a subset of children (n = 250) (see [5] for more details). The concentration of sucrose used (24% wt/vol) has been shown to be an effective analgesic for newborn infants [43] and children [4,5]. In brief, children were told that they were going to play a game in which they would put their hand in a cold-water bath. The following two directives were given: (1) when your hand starts to hurt or feel uncomfortable, raise your other hand to let me know; (2) keep your hand in the water for as long as you can; if you can't take it any more, take your hand out of the water. The non-dominant hand was placed in a room temperature (37°C) water bath for 2 minutes to standardize skin temperature. At 1.5 minutes subjects placed in their mouths, without swallowing, 15–20 ml of either a sucrose solution or water, in randomized order. Thirty seconds later, they transferred their hand to the cold-water bath (10.00 ± 0.01°C), continuing to bathe the taste receptors on the tongue with the solution. At fixed intervals (every 10 seconds) throughout the testing, subjects were encouraged and asked to keep their hand in the water bath as long as they possibly could. Each trial lasted a maximum of 4 minutes or until the subject withdrew the hand from the cold-water bath, whichever came first.
Pain threshold (time elapsed when the subject indicated discomfort by raising the non-immersed hand) and pain tolerance (time the hand was kept in the cold water) were recorded. Pain tolerance data were not available for some children because they tolerated the cold water for the entire 4 minutes for both trials (n = 21), did not complete the task (n = 40) or did not understand the task (n = 2). Of the 187 children whose pain tolerance data were included in the analyses, pain threshold data were not available for 56 because they did not raise their hand to indicate when they first felt pain.
Anthropometry and maternal characteristics
Children were weighed and measured for height, and then their body mass index (BMI; kg/m2) was classified into one of four categories (underweight, healthy weight, overweight or obese) using the Centers for Disease Control (CDC) pediatric growth charts [44]. Because recent research revealed that both BMI and depression in women were associated positively with sweet foods consumption [45], and that obese women liked the taste of sweets (and fats) more than the non-obese women [46], we wanted to explore whether there were associations among children's sweet preferences, maternal obesity and mood states and familial history of alcoholism. Mothers were weighed and measured and standard BMI categories were assigned [47]: normal weight (18.5–24.9 kg/m2), overweight (25.0–29.9 kg/m2) and obese (≥30.0 kg/m2). They also completed the Profile of Mood States Questionnaire [48].
Data analyses
Primary dependent variables were children's sucrose preference, sweet food liking score, pain tolerance and pain threshold. Sucrose preference and sweet food liking score were analyzed by separate 2 × 2 analyses of variance (ANOVAs), with FH (FHP, FHN) and depression category (PDEP, NDEP) as the between-subjects variables. Logarithmic transformation was performed on the pain tolerance and threshold data to approximate a normal distribution as these data were skewed positively [5]. The transformed data were then analyzed by separate two-way mixed ANOVAs with condition (sucrose, water) as the within-subjects factor and child's depression category (PDEP, NDEP) and FH (FHP, FHN) as the between-subjects factors. Additional Pearson's χ2 tests or one-way ANOVAs were conducted to determine whether the four groups differed on a variety of measures, including demographics and maternal characteristics. When significant, post-hoc tests [Fisher's least squares difference (LSD) tests for ANOVAs and partition squares for χ2 tests] were conducted.
Results
Subject characteristics
The four groups did not differ significantly in children's sex ratio (χ2(3) = 4.05, P = 0.26), race/ethnicity (χ2(12) = 13.05, P = 0.37), BMI categories (χ2(9) = 11.61, P = 0.24) (Table 1), family income levels (χ2(9) = 13.36; P = 0.15) or mothers' education (χ2(9) = 13.19; P = 0.15). Nearly half (49.0%; n = 147) of the children were classified as FHP (first-degree relative only, n = 40; second-degree relative only, n = 74; both generations, n = 33). Approximately one in four children (24%) had a parent who had a history of alcohol dependence (15% of the children had a mother with a history of alcohol dependence), consistent with estimates of familial incidence of alcoholism in the United States [49].
Table 1.
Selected characteristics (mean ± standard error of mean or percentage) of child–mother dyads. Dyads were grouped according to depressive symptomatology (non-depressed: NDEP; positive depressive symptomatology: PDEP) and family history of alcoholism up to the child's second-degree relatives for both maternal and paternal sides (family history negative: FHN; family history positive: FHP).
| Family history of alcoholism of child: depressive symptomatology of child: | FHN | FHP | ||
|---|---|---|---|---|
| NDEP | PDEP | NDEP | PDEP | |
| Children's characteristics: | ||||
| Age (years)* | 8.3 ± 0.2 | 7.7 ± 0.2 | 8.5 ± 0.2 | 7.7 ± 0.3 |
| Sex (% female) | 56.0 | 47.7 | 64.5 | 59.5 |
| BMI category (%) | ||||
| Underweight | 0.0 | 4.6 | 5.4 | 8.1 |
| Healthy weight | 70.7 | 72.1 | 61.8 | 59.5 |
| Overweight | 11.9 | 16.3 | 16.4 | 13.5 |
| Obese | 17.4 | 7.0 | 16.4 | 18.9 |
| Ethnicity (%) | ||||
| African American | 45.0 | 59.1 | 46.4 | 62.2 |
| Caucasian | 33.0 | 25.0 | 38.2 | 21.6 |
| Other | 22.0 | 15.9 | 15.4 | 16.2 |
| Temperament | ||||
| Shy | 2.3 ± 0.1 | 2.3 ± 0.1 | 2.3 ± 0.1 | 2.4 ± 0.1 |
| Emotional† | 2.6 ± 0.1 | 2.8 ± 0.1 | 2.9 ± 0.1 | 3.1 ± 0.2 |
| Sociable | 3.6 ± 0.1 | 3.6 ± 0.1 | 3.7 ± 0.1 | 3.6 ± 0.1 |
| Negative reaction to foods† | 2.9 ± 0.1 | 3.1 ± 0.1 | 3.2 ± 0.1 | 3.3 ± 0.1 |
| Active | 3.8 ± 0.1 | 4.1 ± 0.1 | 3.7 ± 0.1 | 3.8 ± 0.1 |
| Food neophobia† | 2.9 ± 0.1 | 2.8 ± 0.1 | 3.0 ± 0.1 | 3.3 ± 0.1 |
| Family history of alcoholism (%) | ||||
| FHP generation 1 only | – | – | 28.2 | 24.3 |
| FHP generation 2 only | – | – | 49.1 | 54.1 |
| FHP generation 1 and 2 | – | – | 22.7 | 21.6 |
| FHP generation 1 and/or 2 | – | – | 100 | 100 |
| Mothers' characteristics: | ||||
| Age (years) | 36.1 ± 0.6 | 34.8 ± 1.0 | 35.7 ± 0.6 | 34.9 ± 1.0 |
| Profile of mood states (POMS) | ||||
| Total mood disturbance score* | 13.5 ± 3.0 | 18.7 ± 4.8 | 15.2 ± 3.0 | 26.7 ± 5.1 |
| POMS subscales: | ||||
| Tension | 7.7 ± 0.6 | 8.2 ± 1.0 | 7.9 ± 0.6 | 9.2 ± 1.0 |
| Depression | 5.9 ± 0.9 | 6.3 ± 1.4 | 6.2 ± 0.9 | 9.8 ± 1.5 |
| Anger | 5.6 ± 0.6 | 6.2 ± 1.0 | 5.8 ± 0.6 | 8.2 ± 1.1 |
| Vigor* | 17.8 ± 0.6 | 15.3 ± 1.0 | 17.5 ± 0.6 | 16.2 ± 1.0 |
| Fatigue* | 6.4 ± 0.6 | 7.5 ± 0.9 | 7.0 ± 0.6 | 8.9 ± 0.9 |
| Confusion | 5.7 ± 0.4 | 5.8 ± 0.7 | 5.9 ± 0.4 | 6.7 ± 0.8 |
| Obese (%)‡ | 31.4a | 31.6a | 38.8a | 60.6b |
| Number of mother–child dyads | 109 | 44 | 110 | 37 |
Significant main effect of depression: PDEP different from NDEP.
Significant main effect of family history of alcoholism: FHP different from FHN.
Significant interaction of family history and depressive symptomatology;
significantly different than b.
Approximately one-quarter of the children (27%; n = 81) were classified as PDEP. FHP children were as likely to be PDEP (25%) as were FHN children (29%; χ2(1) = 0.49, P = 0.48). PDEP children were as likely as NDEP children to have an alcohol-dependent mother (χ2(1) = 1.74, P = 0.19). The PDS data revealed some striking differences between groups. Although similar in reports of enjoying playing games and being with their family, PDEP children were more likely than NDEP children to report problems with sleeping, loneliness, attention and feeding. For example, 72% of PDEP children versus 29% of NDEP children reported that they awoke often at night. Further, 46% of PDEP children versus 13% of NDEP children reported that they had a difficult time paying attention. Because PDEP children were younger than NDEP children (F1,296 = 11.45, P = 0.001; see Table 1), age was used as a covariate in all analyses.
There were significant main effects of DEP and FH on maternal perceptions of child temperament (Table 1). PDEP or FHP children were perceived by their mothers as being more emotional (PDEP: F1,293 = 3.63, P = 0.06; FHP: F1,293 = 5.75; P = 0.02), and FHP children were perceived as being more food neophobic (F1,293 = 9.43, P = 0.002) and more frequently having a negative reaction to food (F1,293 = 4.68, P = 0.03). Mothers of PDEP children were more mood disturbed (F1,293 = 4.16, P = 0.04) and felt more tired (F1,293 = 3.92, P = 0.05) and less vigorous (F1,293 = 5.48, P = 0.02) than did mothers of NDEP children. Mothers of FHP/PDEP children were more likely to be obese than the other three groups of women (χ2(3) = 9.44, P = 0.02).
Sucrose preferences and sweet food liking
There was a significant interaction between FH and DEP (F1,295 = 7.68, P = 0.006) and significant main effects of FH (F1,295 = 4.03, P = 0.05) and DEP (F1,295 = 3.82, P = 0.05) on sucrose preferences. Although FHP children preferred significantly higher sucrose concentrations than did FHN children, this heightened sucrose preference was driven by FHP/PDEP children (see Fig. 1). FHP/PDEP children preferred a 24% wt/vol (∼0.70 M) sucrose solution most, which was 33% more concentrated than that preferred by the other children (18% w/vol; ∼0.53 M). This finding remained significant even after excluding those children who had an alcohol-dependent mother (F1,248 = 4.53; P = 0.03).
Figure 1.
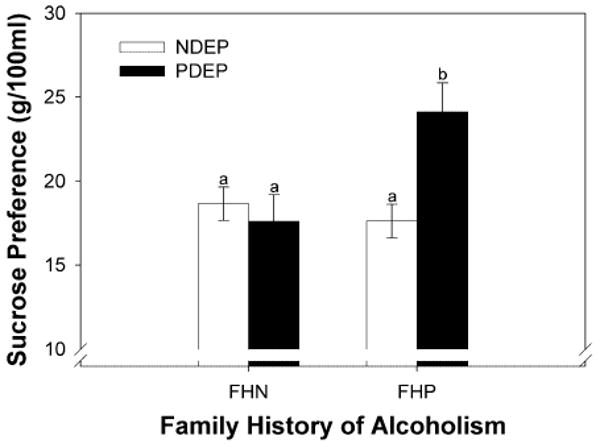
Sucrose preferences (geometric mean ± geometric standard errors) of children participants. Children were grouped according to their family history of alcoholism (family history negative: FHN; family history positive: FHP) and self-reported depressive symptomatology (non-depressed: NDEP; positive depressive symptomatology: PDEP). Different letters are statistically different from each other
There was a significant main effect of DEP on sweet food liking scores (F1,293 = 3.93, P = 0.05); however, this became a trend when age was covaried (F1,292 = 3.53, P = 0.06). When given the choice, PDEP children preferred sweet-tasting foods over salty/savory foods more often (4.1 ± 0.1) than did NDEP children (3.9 ± 0.1). PDEP children were also more likely to report that their favorite candy was a non-chocolate confection with sweetness as its primary taste quality (e.g. bubblegum, lollipop) than were NDEP children (80% versus 62%; P = 0.03).
Sucrose-induced analgesia
There were no significant main effects of FH (F1,126 = 0.0004, P = 0.98), DEP (F1,126 = 0.14, P = 0.71), condition (sucrose, water; F1,126 = 0.05; P = 0.82) or interaction effects between FH and DEP (F1,126 = 0.10, P = 0.75) on pain thresholds. However, there was a significant interaction between condition and DEP on pain tolerance (F1,182 = 3.85, P = 0.05). NDEP children kept their hand in the cold-water bath longer when sucrose, compared with water, was in the mouth (Table 2, Fig. 2). On average, sweet taste was associated with a 36% increase in pain tolerance in NDEP children. Furthermore, the efficacy of sucrose as an analgesic was related to the level of sweetness most preferred: the higher the concentration of sucrose preferred by NDEP children, the longer they kept their hand in the cold-water bath when sucrose, compared with water, was in the mouth (= 0.21; P = 0.013). This is in marked contrast to PDEP children (see Fig. 2): not only was sucrose an ineffective analgesic, but they were less tolerant of the cold water than were NDEP children, regardless of which solution was in the mouth (F1,182 = 7.94, P = 0.005). To explore further whether differences in analgesia were due to problems with attention, we factored in the children's responses to the PDS question regarding having ‘a hard time paying attention’. The findings remained unchanged.
Table 2.
Pain thresholds and pain tolerance in seconds when children held 24% wt/vol sucrose and water in the mouth during the cold pressor test. Children were grouped according to depressive symptomatology (non-depressed: NDEP; positive depressive symptomatology: PDEP) and family history of alcoholism use within two generations (family history negative: FHN; family history positive: FHP).*
| Family history of alcoholism: depressive symptomatology: | NDEP | PDEP | ||||
|---|---|---|---|---|---|---|
| FHN | FHP | FHN and FHP Combined | FHN | FHP | FHN and FHP Combined | |
| Pain threshold (seconds) | ||||||
| Sucrose condition | 13.7 (12.1–15.3) | 17.0 (14.9–19.3) | 15.3 (14.2–16.6) | 13.6 (11.4–16.3) | 15.4 (10.3–22.9) | 14.3 (11.8–17.3) |
| Water condition | 12.8 (11.5–14.3) | 15.2 (13.6–17.0) | 14.0 (12.9–15.2) | 12.9 (11.4–14.4) | 15.1 (11.6–19.9) | 13.7 (12.2–15.5) |
| Both conditions | 13.7 (11.8–14.7) | 16.9 (14.4–18.0) | 15.3 (13.5–15.8) | 13.5 (11.5–15.2) | 15.8 (10.9–21.1) | 14.4 (12.1–16.3) |
| Pain tolerance (seconds) | ||||||
| Sucrose condition† | 34.1 (30.9–37.7)a,e | 30.7 (28.2–33.8) | 32.4 (30.3–34.8)c | 17.2 (14.9–20.1)f | 21.7 (18.4–25.8) | 19.0 (17.1–21.3) |
| Water condition† | 28.4 (28.8–34.5)b,g | 28.2 (26.3–30.3) | 28.3 (26.6–30.0)d | 18.3 (15.6–21.5)h | 24.0 (19.7–29.4) | 20.6 (18.0–23.3) |
| Both conditions† | 32.6 (28.5–34.1)i | 30.5 (27.1–31.8) | 31.6 (28.5–32.1) | 18.5 (15.5–20.5)j | 23.8 (19.3–27.1) | 20.6 (17.6–22.0) |
Data are presented as geometric means. Values in parentheses are the geometric mean – GeoSE followed by the geometric mean + GeoSE.
Significant main effect of depression: PDEP different from NDEP.
Significantly different from
significantly different from
Significantly different from
Significantly different from
Significantly different from.
Figure 2.
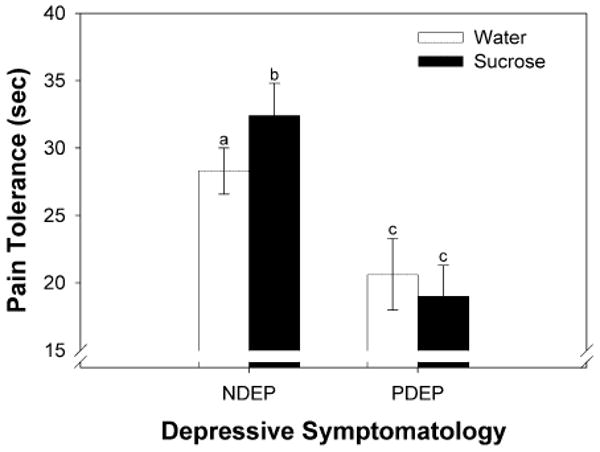
Pain tolerance (geometric means ± geometric standard errors) when water (white bars) or sucrose (black bars) was held in the mouth during the cold pressor test. Children were grouped according to their self-reported depressive symptomatology (non-depressed: NDEP; positive depressive symptomatology: PDEP). Different letters are statistically different from each other
Discussion
The liking for sweet tastes is a hallmark of development evident among children around the world [42]. Although research has demonstrated repeatedly that children prefer higher levels of sweet tastes than do adults, individuals differ in their preferred intensity of sweetness and how sweets make them feel [5]. The present study reveals for the first time that in pediatric populations the co-occurrence of having a family history of alcoholism and self-reports of depressive symptomatology is associated significantly with preference for stronger sweet solutions, while depressive symptomatology alone is associated with greater liking for sweet-tasting foods and candies. On average, FHP/PDEP children preferred 0.70 M sucrose, equivalent to ∼57 g sugar in 230 ml water; a typical cola has a 0.34 M sugar concentration.
Three hypotheses, not mutually exclusive, may explain the preference for more concentrated sucrose solutions among FHP/PDEP children. First, they may be exposed to more sweets from an early age and learn from their families the cultural meaning and appropriateness of sweet-tasting foods [50]. Whether their mothers, who were more likely to be obese and mood disturbed, transmitted this information through example or by proffering such foods [51] is unknown. To this end, research has revealed that both BMI and mood disturbances in women are associated positively with sweet food consumption [45] and that obese adults like the taste of sweets (and fats) more than do non-obese adults [46]. Through familiarization, children develop a sense of what should, or should not, taste sweet [52,53].
Secondly, FHP/PDEP children may be less sensitive to sweet tastes and thus require higher concentrations of sucrose than do other children to achieve the same level of perceived sweetness. Although the present study did not measure sucrose sensitivity, studies on adults reveal that depressed individuals have higher detection thresholds for sucrose [54] and rate varying sucrose concentrations as less intense but more pleasant [55] compared with non-depressed adults. Human taste thresholds for sucrose (and for quinine, a bitter taste) can be lowered by enhancing systemic levels of serotonin and noradrenaline [56]. Although controversial, impaired serotonin functioning may play a causal role in the pathophysiology of depression (see [57] for review) and is evident in FHP adults [58].
Thirdly, preference for more intense sweetness among FHP/PDEP children may reflect an altered brain reward system that needs a more intense sensation of sweetness to release dopamine to levels high enough to compensate for the anhedonia and reduced sensitivity to reward associated with depression and FHP [59,60]. In adults, eating a favorite meal elevates striatal dopamine levels in a dose-dependent manner: the higher the pleasure elicited by the taste of the food, the more dopamine is released [61]. Although it is not yet known whether FHP/PDEP children use sweets to self-medicate or change affect, adults who most prefer high levels of sucrose are more sensitive to the mood-altering effects of sweets and report more impaired control over eating sweets compared with other adults [62,63].
We found no effect of FH, but a significant effect of depression, on the ability of sweets to reduce pain in children. Consistent with previous findings [5], NDEP children sustained the pain of cold water for longer when they had sucrose in the mouth. The more intense the concentration of sucrose the child preferred, the better it worked as an analgesic. This is in marked contrast to that observed in PDEP children: not only was sucrose an ineffective analgesic, they also had a lower tolerance for pain in general. Such findings are consistent with a recent study on pre-adolescent girls indicating that the number of depressive symptoms was related inversely to pain tolerance during the cold pressor test [64].
Several explanations, not mutually exclusive, may explain the altered pain sensitivity and ineffectiveness of sucrose as an analgesic among PDEP children. First, the lower pain tolerance may be due to difficulties in attending to the task. This seems unlikely, because PDEP children did not have difficulty in performing other study-related tasks, and those who reported having attention problems had pain thresholds and tolerance similar to those of the other children. Secondly, PDEP children may experience more emotional stress and increased affective processing both before and during experience with painful stimuli [65,66]. Perhaps the initial emotional hyperreactivity impaired their ability to modulate the pain experienced when their hand was submersed in the cold water [65]. Although we do not have measures of how often the children in the present study experienced pain, there are reports that depressed children complain about abdominal pain [67] and headaches [68] more often than do other children. The co-occurrence of depression and chronic pain in adults has been associated with greater pain-evoked neuronal activation in brain regions associated with affective pain processing [69], which may in turn alter pain tolerance. Thirdly, PDEP children may be insensitive to the analgesic properties of sucrose because the opioid-mediated analgesia [70] relies on a functional serotonergic system [71,72], which might be altered in depressed individuals [57]. Finally, the greater sweet food liking by depressed children may lead to more frequent indulgences in sweets [73]. Animal model studies have shown that excessive sugar intake alters the efficacy of sucrose as an analgesic [70]. Whether the rewarding properties of fats are also altered in these children is an important area for future research (see [74]).
In the present study, depressive symptomatology was based on children's self-report ratings using the PDS. PDEP children were more likely to report problems with sleeping, loneliness, attention and feeding and were perceived by their mothers as being more emotional, lending further support that there were differences between the groups. Whether these PDEP children are more likely to become depressed adolescents is not known. Because the rates of clinical depression increase dramatically during mid- to late adolescence [75], the comorbidity between FH and depression may become more evident during this developmental time-period. We caution that the PDS does not diagnose depression, and that the symptomatic profiles of depressive disorders lack homogeneity in children (e.g. some undereat whereas others overeat) [76]. Whether specific profiles are more associated with heightened sucrose preferences and the use of sweets as analgesics is an important area for future research.
In 2007, the US Surgeon General called for a systematic approach that addresses alcohol problems within a developmental perspective [77]. During childhood, children undergo a considerable amount of change and ultimately achieve some stability in adapting to their environment, including the means by which they learn and solve problems, communicate, regulate emotions, respond to stress and relate to others. The finding that PDEP children were more likely to report sleep problems, which has been shown in a recent prospective study to predict the onset of alcohol, cigarette and marijuana use among adolescents [78], calls for longitudinal and experimental research to determine whether the heightened sweet preference and the use of sweet foods to alleviate depression are markers for developing alcohol-related problems or responses that are protective (see also [79]).
Acknowledgments
This work was supported by NIH Grants R01AA09523 and HD37119 and Monell Institutional Funds.
Footnotes
Declarations of interest: None.
References
- 1.Coldwell SE, Oswald TK, Reed DR. A marker of growth differs between adolescents with high vs. low sugar preference. Physiol Behav. 2009;96:574–80. doi: 10.1016/j.physbeh.2008.12.010. [DOI] [PMC free article] [PubMed] [Google Scholar]
- 2.Simmen B, Hladik CM. Sweet and bitter taste discrimination in primates: scaling effects across species. Folia Primatol (Basel) 1998;69:129–38. doi: 10.1159/000021575. [DOI] [PubMed] [Google Scholar]
- 3.Benton D, Brett V, Brain PF. Glucose improves attention and reaction to frustration in children. Biol Psychol. 1987;24:95–100. doi: 10.1016/0301-0511(87)90016-0. [DOI] [PubMed] [Google Scholar]
- 4.Miller A, Barr RG, Young SN. The cold pressor test in children: methodological aspects and the analgesic effect of intraoral sucrose. Pain. 1994;56:175–83. doi: 10.1016/0304-3959(94)90092-2. [DOI] [PubMed] [Google Scholar]
- 5.Pepino MY, Mennella JA. Sucrose-induced analgesia is related to sweet preferences in children but not adults. Pain. 2005;119:210–18. doi: 10.1016/j.pain.2005.09.029. [DOI] [PMC free article] [PubMed] [Google Scholar]
- 6.Desor JA, Beauchamp GK. Longitudinal changes in sweet preferences in humans. Physiol Behav. 1987;39:639–41. doi: 10.1016/0031-9384(87)90166-1. [DOI] [PubMed] [Google Scholar]
- 7.Spear LP. The adolescent brain and age-related behavioral manifestations. Neurosci Biobehav Rev. 2000;24:417–63. doi: 10.1016/s0149-7634(00)00014-2. [DOI] [PubMed] [Google Scholar]
- 8.Berridge KC, Kringelbach ML. Affective neuroscience of pleasure: reward in humans and animals. Psychopharmacology (Berl) 2008;199:457–80. doi: 10.1007/s00213-008-1099-6. [DOI] [PMC free article] [PubMed] [Google Scholar]
- 9.Haase L, Cerf-Ducastel B, Buracas G, Murphy C. On-line psychophysical data acquisition and event-related fMRI protocol optimized for the investigation of brain activation in response to gustatory stimuli. J Neurosci Methods. 2007;159:98–107. doi: 10.1016/j.jneumeth.2006.07.009. [DOI] [PubMed] [Google Scholar]
- 10.Pecina S, Berridge KC. Hedonic hot spot in nucleus accumbens shell: where do mu-opioids cause increased hedonic impact of sweetness? J Neurosci. 2005;25:11777–86. doi: 10.1523/JNEUROSCI.2329-05.2005. [DOI] [PMC free article] [PubMed] [Google Scholar]
- 11.Pecina S, Smith KS, Berridge KC. Hedonic hot spots in the brain. Neuroscientist. 2006;12:500–11. doi: 10.1177/1073858406293154. [DOI] [PubMed] [Google Scholar]
- 12.Mennella JA. The sweet taste of childhood. In: Basbaum AI, Kaneko A, Shephers CM, Westheimer G, editors. The Senses: a Comprehensive Reference, vol 4 Olfaction and Taste. San Diego, CA: Academic Press; 2007. pp. 183–8. [Google Scholar]
- 13.Krahn D, Grossman J, Henk H, Mussey M, Crosby R, Gosnell B. Sweet intake, sweet-liking, urges to eat, and weight change: relationship to alcohol dependence and abstinence. Addict Behav. 2006;31:622–31. doi: 10.1016/j.addbeh.2005.05.056. [DOI] [PubMed] [Google Scholar]
- 14.Junghanns K, Veltrup C, Wetterling T. Craving shift in chronic alcoholics. Eur Addict Res. 2000;6:64–70. doi: 10.1159/000019012. [DOI] [PubMed] [Google Scholar]
- 15.Junghanns K, Backhaus J, Tietz U, Lange W, Rink L, Wetterling T, et al. The consumption of cigarettes, coffee and sweets in detoxified alcoholics and its association with relapse and a family history of alcoholism. Eur Psychiatry. 2005;20:451–5. doi: 10.1016/j.eurpsy.2004.09.011. [DOI] [PubMed] [Google Scholar]
- 16.Yung L, Gordis E, Holt J. Dietary choices and likelihood of abstinence among alcoholic patients in an outpatient clinic. Drug Alcohol Depend. 1983;12:355–62. doi: 10.1016/0376-8716(83)90007-8. [DOI] [PubMed] [Google Scholar]
- 17.Amit Z, Weiss S, Smith BR, Markevitch S. The affinity for sweet substances and cigarette smoking in chronic alcoholism. Isr J Psychiatry Relat Sci. 2003;40:96–102. [PubMed] [Google Scholar]
- 18.Colditz GA, Giovannucci E, Rimm EB, Stampfer MJ, Rosner B, Speizer FE, et al. Alcohol intake in relation to diet and obesity in women and men. Am J Clin Nutr. 1991;54:49–55. doi: 10.1093/ajcn/54.1.49. [DOI] [PubMed] [Google Scholar]
- 19.Page L, Friend B. The changing United States diet. Bioscience. 1978;28:192–7. [Google Scholar]
- 20.Bachmanov AA, Reed DR, Tordoff MG, Price RA, Beauchamp GK. Intake of ethanol, sodium chloride, sucrose, citric acid, and quinine hydrochloride solutions by mice: a genetic analysis. Behav Genet. 1996;26:563–73. doi: 10.1007/BF02361229. [DOI] [PMC free article] [PubMed] [Google Scholar]
- 21.Bachmanov AA, Kiefer SW, Molina JC, Tordoff MG, Duffy VB, Bartoshuk LM, et al. Chemosensory factors influencing alcohol perception, preferences, and consumption. Alcohol Clin Exp Res. 2003;27:220–31. doi: 10.1097/01.ALC.0000051021.99641.19. [DOI] [PMC free article] [PubMed] [Google Scholar]
- 22.Blizard DA, McClearn GE. Association between ethanol and sucrose intake in the laboratory mouse: exploration via congenic strains and conditioned taste aversion. Alcohol Clin Exp Res. 2000;24:253–8. [PubMed] [Google Scholar]
- 23.Kampov-Polevoy AB, Garbutt JC, Khalitov E. Family history of alcoholism and response to sweets. Alcohol Clin Exp Res. 2003;27:1743–9. doi: 10.1097/01.ALC.0000093739.05809.DD. [DOI] [PubMed] [Google Scholar]
- 24.Pepino MY, Mennella JA. Effects of cigarette smoking and family history of alcoholism on sweet taste perception and food cravings in women. Alcohol Clin Exp Res. 2007;31:1891–9. doi: 10.1111/j.1530-0277.2007.00519.x. [DOI] [PMC free article] [PubMed] [Google Scholar]
- 25.Kranzler HR, Sandstrom KA, Van Kirk J. Sweet taste preference as a risk factor for alcohol dependence. Am J Psychiatry. 2001;158:813–15. doi: 10.1176/appi.ajp.158.5.813. [DOI] [PubMed] [Google Scholar]
- 26.Scinska A, Bogucka-Bonikowska A, Koros E, Polanowska E, Habrat B, Kukwa A, et al. Taste responses in sons of male alcoholics. Alcohol Alcohol. 2001;36:79–84. doi: 10.1093/alcalc/36.1.79. [DOI] [PubMed] [Google Scholar]
- 27.Nurnberger JI, Jr, Wiegand R, Bucholz K, O'Connor S, Meyer ET, Reich T, et al. A family study of alcohol dependence: coaggregation of multiple disorders in relatives of alcohol-dependent probands. Arch Gen Psychiatry. 2004;61:1246–56. doi: 10.1001/archpsyc.61.12.1246. [DOI] [PubMed] [Google Scholar]
- 28.Grunberg NE, Morse DE. Cigarette smoking and food consumption in the United States. J Appl Soc Psychol. 1984;14:310–17. [Google Scholar]
- 29.Kazes M, Danion JM, Grange D, Pradignac A, Simon C, Burrus-Mehl F, et al. Eating behaviour and depression before and after antidepressant treatment: a prospective, naturalistic study. J Affect Disord. 1994;30:193–207. doi: 10.1016/0165-0327(94)90080-9. [DOI] [PubMed] [Google Scholar]
- 30.Weiffenbach JM, Cowart BJ, Baum BJ. Taste intensity perception in aging. J Gerontol. 1986;41:460–8. doi: 10.1093/geronj/41.4.460. [DOI] [PubMed] [Google Scholar]
- 31.Mennella JA, Pepino MY, Reed DR. Genetic and environmental determinants of bitter perception and sweet preferences. Pediatrics. 2005;115:e216–22. doi: 10.1542/peds.2004-1582. [DOI] [PMC free article] [PubMed] [Google Scholar]
- 32.Selzer ML. The Michigan alcoholism screening test: the quest for a new diagnostic instrument. Am J Psychiatry. 1971;127:1653–8. doi: 10.1176/ajp.127.12.1653. [DOI] [PubMed] [Google Scholar]
- 33.Nurnberger JI, Jr, Blehar MC, Kaufmann CA, York-Cooler C, Simpson SG, Harkavy-Friedman J, et al. Diagnostic interview for genetic studies. Rationale, unique features, and training. NIMH Genetics Initiative. Arch Gen Psychiatry. 1994;51:849–59. doi: 10.1001/archpsyc.1994.03950110009002. discussion 863–4. [DOI] [PubMed] [Google Scholar]
- 34.Bucholz KK, Cadoret R, Cloninger CR, Dinwiddie SH, Hesselbrock VM, Nurnberger JI, Jr, et al. A new, semi-structured psychiatric interview for use in genetic linkage studies: a report on the reliability of the SSAGA. J Stud Alcohol. 1994;55:149–58. doi: 10.15288/jsa.1994.55.149. [DOI] [PubMed] [Google Scholar]
- 35.McLeod DR, Foster GV, Hoehn-Saric R, Svikis DS, Hipsley PA. Family history of alcoholism in women with generalized anxiety disorder who have premenstrual syndrome: patient reports of premenstrual alcohol consumption and symptoms of anxiety. Alcohol Clin Exp Res. 1994;18:664–70. doi: 10.1111/j.1530-0277.1994.tb00928.x. [DOI] [PubMed] [Google Scholar]
- 36.Capone C, Wood MD. Density of familial alcoholism and its effects on alcohol use and problems in college students. Alcohol Clin Exp Res. 2008;32:1451–8. doi: 10.1111/j.1530-0277.2008.00716.x. [DOI] [PubMed] [Google Scholar]
- 37.O'Connor MJ, Kasari C. Prenatal alcohol exposure and depressive features in children. Alcohol Clin Exp Res. 2000;24:1084–92. [PubMed] [Google Scholar]
- 38.O'Connor MJ, Paley B. The relationship of prenatal alcohol exposure and the postnatal environment to child depressive symptoms. J Pediatr Psychol. 2006;31:50–64. doi: 10.1093/jpepsy/jsj021. [DOI] [PubMed] [Google Scholar]
- 39.Kovacs M. The Childhood Depression Inventory. New York: Multi-Health Services, Inc.; 1992. [Google Scholar]
- 40.Pliner P, Loewen ER. Temperament and food neophobia in children and their mothers. Appetite. 1997;28:239–54. doi: 10.1006/appe.1996.0078. [DOI] [PubMed] [Google Scholar]
- 41.Cowart BJ, Beauchamp GK. Early development of taste perception. In: McBride RL, MacFie HJH, editors. Psychological Basis of Sensory Evaluation. London: Elsevier; 1990. pp. 1–7. [Google Scholar]
- 42.Liem DG, Mennella JA. Sweet and sour preferences during childhood: role of early experiences. Dev Psychobiol. 2002;41:388–95. doi: 10.1002/dev.10067. [DOI] [PMC free article] [PubMed] [Google Scholar]
- 43.Blass EM, Hoffmeyer LB. Sucrose as an analgesic for newborn infants. Pediatrics. 1991;87:215–18. [PubMed] [Google Scholar]
- 44.Kuczmarski RJ, Ogden CL, Guo SS, Grummer-Strawn LM, Flegal KM, Mei Z, et al. CDC Growth Charts for the United States: methods and development. Vital Health Stat. 2002;11:1–190. [PubMed] [Google Scholar]
- 45.Jeffery RW, Linde JA, Simon GE, Ludman EJ, Rohde P, Ichikawa LE, et al. Reported food choices in older women in relation to body mass index and depressive symptoms. Appetite. 2009;52:238–40. doi: 10.1016/j.appet.2008.08.008. [DOI] [PMC free article] [PubMed] [Google Scholar]
- 46.Bartoshuk LM, Duffy VB, Hayes JE, Moskowitz HR, Snyder DJ. Psychophysics of sweet and fat perception in obesity: problems, solutions and new perspectives. Phil Trans R Soc Lond B Biol Sci. 2006;361:1137–48. doi: 10.1098/rstb.2006.1853. [DOI] [PMC free article] [PubMed] [Google Scholar]
- 47.National Heart, Lung and Blood Institute. The Evidence Report, Obesity Education Initiative, NIH Publication no 98-4083. Bethesda, MD: National Heart, Lung and Blood Institute, National Institutes of Health; 1998. Clinical guidelines on identification, evaluation, and treatment of overweight and obesity in adults. [Google Scholar]
- 48.McNair DM, Lorr M, Droppleman LF. Revised Manual for the Profile of Mood States. San Diego, CA: Educational and Industrial Testing Services; 1992. [Google Scholar]
- 49.Grant BF. Estimates of US children exposed to alcohol abuse and dependence in the family. Am J Public Health. 2000;90:112–15. doi: 10.2105/ajph.90.1.112. [DOI] [PMC free article] [PubMed] [Google Scholar]
- 50.Pepino MY, Mennella JA. Children's liking of sweet tastes and its biological basis. In: Spillane WJ, editor. Optimising Sweet Taste in Foods. Cambridge: Woodhead Publishing Ltd; 2006. pp. 54–65. [Google Scholar]
- 51.Campbell KJ, Crawford DA, Salmon J, Carver A, Garnett SP, Baur LA. Associations between the home food environment and obesity-promoting eating behaviors in adolescence. Obesity. 2007;15:719–30. doi: 10.1038/oby.2007.553. [DOI] [PubMed] [Google Scholar]
- 52.Beauchamp GK, Cowart BJ. Congenital and experiential factors in the development of human flavor preferences. Appetite. 1985;6:357–72. doi: 10.1016/s0195-6663(85)80004-0. [DOI] [PubMed] [Google Scholar]
- 53.Pepino MY, Mennella JA. Factors contributing to individual differences in sucrose preference. Chem Senses. 2005;30:i319–20. doi: 10.1093/chemse/bjh243. [DOI] [PMC free article] [PubMed] [Google Scholar]
- 54.Steiner JE, Rosenthal-Zifroni A, Edelstein EL. Taste perception in depressive illness. Isr Ann Psychiatr Relat Discip. 1969;7:223–32. [PubMed] [Google Scholar]
- 55.Amsterdam JD, Settle RG, Doty RL, Abelman E, Winokur A. Taste and smell perception in depression. Biol Psychiatry. 1987;22:1481–5. doi: 10.1016/0006-3223(87)90108-9. [DOI] [PubMed] [Google Scholar]
- 56.Heath TP, Melichar JK, Nutt DJ, Donaldson LF. Human taste thresholds are modulated by serotonin and noradrenaline. J Neurosci. 2006;26:12664–71. doi: 10.1523/JNEUROSCI.3459-06.2006. [DOI] [PMC free article] [PubMed] [Google Scholar]
- 57.Cowen PJ. Serotonin and depression: pathophysiological mechanism or marketing myth? Trends Pharmacol Sci. 2008;29:433–6. doi: 10.1016/j.tips.2008.05.004. [DOI] [PubMed] [Google Scholar]
- 58.Underwood MD, Mann JJ, Huang YY, Arango V. Family history of alcoholism is associated with lower 5-HT2A receptor binding in the prefrontal cortex. Alcohol Clin Exp Res. 2008;32:593–9. doi: 10.1111/j.1530-0277.2007.00610.x. [DOI] [PubMed] [Google Scholar]
- 59.Hill SY, Hoffman EK, Zezza N, Thalamuthu A, Weeks DE, Matthews AG, et al. Dopaminergic mutations: within-family association and linkage in multiplex alcohol dependence families. AmJ Med Genet B Neuropsychiatr Genet. 2008;147B:517–26. doi: 10.1002/ajmg.b.30630. [DOI] [PMC free article] [PubMed] [Google Scholar]
- 60.Martin-Soelch C. Is depression associated with dysfunction of the central reward system? Biochem Soc Trans. 2009;37:313–17. doi: 10.1042/BST0370313. [DOI] [PubMed] [Google Scholar]
- 61.Small DM, Jones-Gotman M, Dagher A. Feeding-induced dopamine release in dorsal striatum correlates with meal pleasantness ratings in healthy human volunteers. Neuroimage. 2003;19:1709–15. doi: 10.1016/s1053-8119(03)00253-2. [DOI] [PubMed] [Google Scholar]
- 62.Kampov-Polevoy AB, Alterman A, Khalitov E, Garbutt JC. Sweet preference predicts mood altering effect of and impaired control over eating sweet foods. Eat Behav. 2006;7:181–7. doi: 10.1016/j.eatbeh.2005.09.005. [DOI] [PubMed] [Google Scholar]
- 63.Christensen L. The effect of carbohydrates on affect. Nutrition. 1997;13:503–14. doi: 10.1016/s0899-9007(97)00003-8. [DOI] [PubMed] [Google Scholar]
- 64.Keenan K, Hipwell AE, Hinze AE, Babinski DE. The association of pain and depression in preadolescent girls: moderation by race and pubertal stage. J Pediatr Psychol. 2009;34:727–37. doi: 10.1093/jpepsy/jsn111. [DOI] [PMC free article] [PubMed] [Google Scholar]
- 65.Strigo IA, Simmons AN, Matthews SC, Craig AD, Paulus MP. Association of major depressive disorder with altered functional brain response during anticipation and processing of heat pain. Arch Gen Psychiatry. 2008;65:1275–84. doi: 10.1001/archpsyc.65.11.1275. [DOI] [PMC free article] [PubMed] [Google Scholar]
- 66.Bar KJ, Wagner G, Koschke M, Boettger S, Boettger MK, Schlosser R, et al. Increased prefrontal activation during pain perception in major depression. Biol Psychiatry. 2007;62:1281–7. doi: 10.1016/j.biopsych.2007.02.011. [DOI] [PubMed] [Google Scholar]
- 67.Little CA, Williams SE, Puzanovova M, Rudzinski ER, Walker LS. Multiple somatic symptoms linked to positive screen for depression in pediatric patients with chronic abdominal pain. J Pediatr Gastroenterol Nutr. 2007;44:58–62. doi: 10.1097/01.mpg.0000243423.93968.7c. [DOI] [PMC free article] [PubMed] [Google Scholar]
- 68.Mazzone L, Vitiello B, Incorpora G, Mazzone D. Behavioural and temperamental characteristics of children and adolescents suffering from primary headache. Cephalalgia. 2006;26:194–201. doi: 10.1111/j.1468-2982.2005.01015.x. [DOI] [PubMed] [Google Scholar]
- 69.Giesecke T, Gracely RH, Williams DA, Geisser ME, Petzke FW, Clauw DJ. The relationship between depression, clinical pain, and experimental pain in a chronic pain cohort. Arthritis Rheum. 2005;52:1577–84. doi: 10.1002/art.21008. [DOI] [PubMed] [Google Scholar]
- 70.Segato FN, Castro-Souza C, Segato EN, Morato S, Coimbra NC. Sucrose ingestion causes opioid analgesia. Braz J Med Biol Res. 1997;30:981–4. doi: 10.1590/s0100-879x1997000800011. [DOI] [PubMed] [Google Scholar]
- 71.Zhao ZQ, Gao YJ, Sun YG, Zhao CS, Gereau RW, 4th, Chen ZF. Central serotonergic neurons are differentially required for opioid analgesia but not for morphine tolerance or morphine reward. Proc Natl Acad Sci USA. 2007;104:14519–24. doi: 10.1073/pnas.0705740104. [DOI] [PMC free article] [PubMed] [Google Scholar]
- 72.Abbott FV, Etienne P, Franklin KB, Morgan MJ, Sewitch MJ, Young SN. Acute tryptophan depletion blocks morphine analgesia in the cold-pressor test in humans. Psychopharmacology (Berl) 1992;108:60–6. doi: 10.1007/BF02245286. [DOI] [PubMed] [Google Scholar]
- 73.Drewnowski A, Hann C. Food preferences and reported frequencies of food consumption as predictors of current diet in young women. Am J Clin Nutr. 1999;70:28–36. doi: 10.1093/ajcn/70.1.28. [DOI] [PubMed] [Google Scholar]
- 74.Avena NM, Rada P, Hoebel BG. Sugar and fat bingeing have notable differences in addictive-like behavior. J Nutr. 2009;139:623–8. doi: 10.3945/jn.108.097584. [DOI] [PMC free article] [PubMed] [Google Scholar]
- 75.Hankin BL, Abramson LY, Moffitt TE, Silva PA, McGee R, Angell KE. Development of depression from preadolescence to young adulthood: emerging gender differences in a 10-year longitudinal study. J Abnorm Psychol. 1998;107:128–40. doi: 10.1037//0021-843x.107.1.128. [DOI] [PubMed] [Google Scholar]
- 76.Kovacs M, Akiskal HS, Gatsonis C, Parrone PL. Childhood-onset dysthymic disorder. Clinical features and prospective naturalistic outcome. Arch Gen Psychiatry. 1994;51:365–74. doi: 10.1001/archpsyc.1994.03950050025003. [DOI] [PubMed] [Google Scholar]
- 77.US Department of Health and Human Services. The Surgeon General's Call to Action to Prevent and Reduce Underage Drinking. Rockville, MD: US Department of Health and Human Services, Public Health Service, Office of the Surgeon General; 2007. [4 September 2009]. Available at: http://www.surgeongeneral.gov/topics/underagedrinking/calltoaction.pdf. [PubMed] [Google Scholar]
- 78.Wong MM, Brower KJ, Zucker RA. Childhood sleep problems, early onset of substance use and behavioral problems in adolescence. Sleep Med. 2009;10:787–96. doi: 10.1016/j.sleep.2008.06.015. [DOI] [PMC free article] [PubMed] [Google Scholar]
- 79.Volkow ND, Wang GJ, Begleiter H, Porjesz B, Fowler JS, Telang F, et al. High levels of dopamine D2 receptors in unaffected members of alcoholic families: possible protective factors. Arch Gen Psychiatry. 2006;63:999–1008. doi: 10.1001/archpsyc.63.9.999. [DOI] [PubMed] [Google Scholar]