Abstract
Expanding croplands to meet the needs of a growing population, changing diets, and biofuel production comes at the cost of reduced carbon stocks in natural vegetation and soils. Here, we present a spatially explicit global analysis of tradeoffs between carbon stocks and current crop yields. The difference among regions is striking. For example, for each unit of land cleared, the tropics lose nearly two times as much carbon (∼120 tons·ha−1 vs. ∼63 tons·ha−1) and produce less than one-half the annual crop yield compared with temperate regions (1.71 tons·ha−1·y−1 vs. 3.84 tons·ha−1·y−1). Therefore, newly cleared land in the tropics releases nearly 3 tons of carbon for every 1 ton of annual crop yield compared with a similar area cleared in the temperate zone. By factoring crop yield into the analysis, we specify the tradeoff between carbon stocks and crops for all areas where crops are currently grown and thereby, substantially enhance the spatial resolution relative to previous regional estimates. Particularly in the tropics, emphasis should be placed on increasing yields on existing croplands rather than clearing new lands. Our high-resolution approach can be used to determine the net effect of local land use decisions.
Keywords: cropland expansion, deforestation, greenhouse gases, ecosystem services, land use change
Land used for agricultural production presents a tradeoff to society. On one hand, agricultural lands provide essential food, feed, fiber, and increasingly, biofuels. On the other hand, in their natural state, these lands could provide additional important ecosystem services. Many social, political, and economic factors drive land use decisions and the choice to manage for some services at the expense of others. Understanding the tradeoffs among ecosystem services is critical to manage ecosystems for multiple goals. Some tradeoffs connect local actions with global issues. Agricultural practices affect carbon storage, with consequences for greenhouse gasses and climate change. How do we balance the need to expand agricultural production with the need to maintain or even expand ecosystem carbon stocks?
The tradeoff between food production and carbon stocks is evident in recent opposing trends. Agricultural lands expanded ∼10 million ha·y−1 between 1980 and 2007 (1) to address the needs of a growing population, changing diets, and increased biofuel demand. Thirty to forty percent of the earth's ice-free land is now converted to pastures and croplands (2). Meanwhile, market-based incentives are emerging to mitigate greenhouse gas emission through forest restoration and protection. Proposed revisions to the Kyoto protocol could provide incentives to reduce CO2 emissions from deforestation and degradation. The influence of these strategies will vary geographically, depending on regional differences in carbon storage in natural ecosystems and croplands.
Clearing natural ecosystems for crop production releases CO2 into the atmosphere as stored carbon is released from vegetation biomass and soil. The amount released is primarily determined by the amount stored in slow turnover stocks of woody vegetation and soil organic matter. For example, sparsely vegetated ecosystems like deserts store little carbon, whereas densely vegetated tropical forests store much more. Soil carbon is released when bare soil exposes organic matter to oxidation and erosion. Collectively, the effects of land use change on global greenhouse gas emissions are substantial—deforestation accounts for ∼12–20% of worldwide annual emissions (3, 4).
Previous studies have estimated the national, continental, and zonal impact on carbon stocks when land is cleared for agriculture and other purposes (5–7). We present a global analysis of tradeoffs between carbon stocks and crop yield using recently published high-resolution data for the distribution and yield of major crops (8, 9). We also provide geographically explicit data on terrestrial carbon stocks in natural vegetation and soils. Trade policies may simply shift land uses from one country to another, and therefore, global analysis is required to determine the net effect of local land use decisions and assess implications for greenhouse gas concentrations and climate. To calculate this tradeoff between crop yield and carbon stocks, we present (i) crop distribution and average yields, (ii) the change in carbon stocks resulting from converting natural vegetation to croplands, and (iii) the ratio of change in carbon stocks per unit of crop yield.
Results
What Is the Distribution of Average Crop Yields?
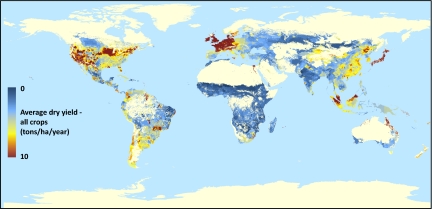
Annual average crop yields vary by an order of magnitude across the globe depending on crop type, soil type, climate, and management. At present, average crop yields in temperate regions are typically double those in the tropics (Table 1). However, yields vary within each climate region (Fig. 1).
Table 1.
Summary of crop yield, carbon stocks, and tradeoffs
| Region | Percentage of region in cropland | Average annual dry yield, all crops (tons crops·ha−1·y−1) | Average change in carbon stock from land conversion (tons C·ha−1) | Average tradeoff index (tons C·ha−1/tons crop yield·ha−1·y−1) |
| Tropics | 10.5 | 1.7 | −120.3 | −76.9 |
| Subtropics | 13.5 | 3.3 | −68.3 | −27.0 |
| Temperate | 20.4 | 3.8 | −62.9 | −26.9 |
| Boreal | 1.4 | 3.7 | −71.5 | −37.0 |
| Polar | <1.0 | 2.2 | −10.5 | −4.7 |
Fig. 1.
Cropland distribution and average annual yield. Croplands cover ∼15 million km2 (8). The weighted average dry crop yields per unit area for 175 herbaceous and woody crop types were calculated from data presented in Monfreda et al. (9). The highest yield regions are in temperate western Europe and North America, but high yields are also present locally within tropical regions.
What Is the Change in Carbon from Converting Natural Ecosystems to Croplands?
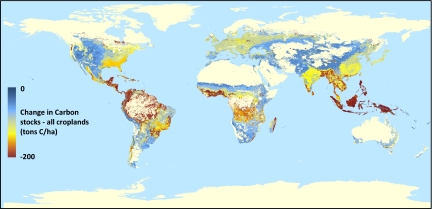
The average carbon loss resulting from converting natural ecosystems to croplands is highest in the tropics, largely because tropical forests store much more biomass carbon than any other biome (10). Our analysis estimates that nearly two times as much carbon is lost for each converted hectare in the tropics than in temperate regions (Table 1 and Fig. 2). Carbon stocks are predicted to increase in a small fraction of the area in our analysis (<0.09%). Areas with increases were most common in sparsely vegetated grasslands and deserts, which may now be irrigated. Variation within each of the climate regions is driven by different distributions of ecosystem types, climate, and soils.
Fig. 2.
Change in carbon stocks from cropland conversion. Carbon stock reduction was calculated as the difference between croplands and natural vegetation in carbon stocks [Δcarbon = carboncrops − carbonpotential natural vegetation − 0.25(carbonsoil)]. Although there is high spatial variability within regions, the average carbon loss from cropland expansion per unit area converted is nearly two times as high in the tropics as in temperate regions. Carbon loss is locally as great as −440 tons C·ha−1 in some tropical areas where rainforest is replaced with sparse croplands.
What Is the Tradeoff Between Carbon Stocks and Crop Yields?
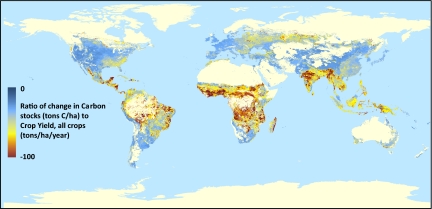
Using the two analyses described above, we quantified and mapped the tradeoff between carbon stocks and crop production by calculating the ratio of carbon loss to crop yield in each ∼10- × 10-km cell. Our results show strong differences in the carbon–crop tradeoff among regions. Nearly three times as much carbon has been lost per ton of crop yield in the tropics compared with temperate regions (Table 1 and Figs. 3 and 4). The high carbon loss per unit crop yield in the tropics results from the combined highest average carbon loss from conversion coupled with the lowest average yield values (Table 1 and Figs. 1 and 2). Although management practices play an important role in crop yield, the spatial variability of the tradeoff is driven more by changes in carbon stocks than by distribution of crop yields.
Fig. 3.
Change in carbon stock per unit annual crop production index. The crop yield and carbon loss data presented in Figs. 1 and 2 were combined to calculate the change in carbon stock for each unit of natural ecosystem cleared for croplands. Carbon loss per ton of annual crop yield for expanding cropland in natural ecosystems is nearly three times as high in the tropics as in the temperate regions.
Fig. 4.
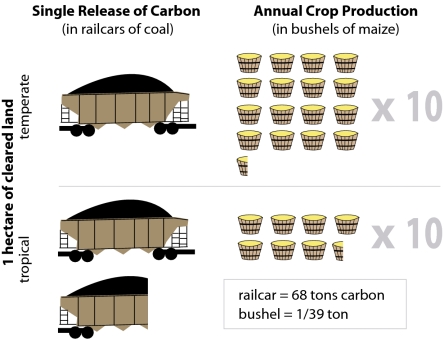
Tradeoffs of carbon and crop production in temperate and tropical regions. Each hectare of land cleared for cropland in the temperate region releases an average of 63 tons of carbon and annually produces an average of 3.8 tons of dry crops. In contrast, a hectare of cleared land in the tropics releases an average of 120 tons of carbon and annually produces 1.7 tons of dry crops. The tradeoff varies depending on type of ecosystem cleared, soil type, crops planted, and crop management practices. We assumed that the coal was 75% carbon, making a standard railcar of coal equivalent to 68 tons of carbon. Dry yields were adjusted to account for the 11% water content in harvested maize grain.
Discussion
Tradeoffs between crop yield and carbon storage have implications for meeting the global demand for food, fiber, and fuel as well as the need to mitigate climate change through carbon storage. Crop production is projected to increase by 50% to meet these needs by 2050, perhaps requiring ∼100–200 million ha of new cropland, depending on genetic innovations, irrigation, fertilization, and tillage practices (11–13). This increase in demand is the result of increased population, a shift to meat-based diets, and biofuel production.
Cropland expansion during the 1980s and 1990s was greatest in the tropics (1). Over 80% of new tropical croplands in the 1990s replaced mature or degraded forests (14). These cleared tropical forests release ∼95–215 more tons of carbon than previously cleared lands that are currently managed as grasslands or pastures (Fig. S1 and Table S1). It can take decades, even centuries, before the carbon lost by clearing new land for biofuel production can be recovered by the greenhouse gas savings from biofuel use (15–18). Tropical vegetation currently stores ∼340 billion tons of carbon (19), which is 40 times more than annual global fossil fuel emissions (20). This vast tropical carbon reservoir is at risk; today, only 10.5% of the tropics is cropland, and future cropland expansion is projected to be greatest there (13, 21–13).
There is growing consensus that economic incentives are needed to maintain and increase forest cover to protect critical carbon reservoirs. In particular, international policies to reduce emissions from deforestation and degradation (REDD) using incentives to maintain forests using the carbon market have gained momentum. These emerging efforts could help balance the tradeoffs between carbon storage and crop production. Our results corroborate recommendations to concentrate reforestation and avoid deforestation in the tropics to have the greatest worldwide impact (24, 25). For example, even if tropical crop yields are doubled to yields comparable with those in temperate regions, clearing lands in the tropics still releases ∼35 tons of carbon per ton of annual crop yield.
Despite the clear benefits of concentrating reforestation and forest conservation efforts in the tropics, several local and regional factors influence implementation. Although local land use change has global consequences for atmospheric greenhouse gas concentrations, choices are made locally and are influenced by local and regional food security, transportation costs, labor, poverty, and technology rather than global atmospheric carbon. Thus, local and global outcomes must be coupled to manage ecosystem services and assess their tradeoffs (26). This mismatch is particularly important in the tropics where agricultural lands are expanding at the highest rate and the carbon loss per hectare is highest. However, production increases will be difficult to achieve by intensification alone, because mechanized farming is not widespread in many of these developing regions. Natural ecosystems are likely to be maintained when crop production needs are met elsewhere and on lands where (i) crop yields are marginal, (ii) the value of carbon outweighs the value of crops, and/or (iii) natural ecosystems provide multiple high-valued services such as water purification, recreation, or biodiversity conservation.
Although the patterns of the tradeoff between carbon stocks and crop yield provide useful insights for policy, the accuracy of the tradeoff ratio is often limited by data availability. Using the Intergovernmental Panel on Climate Change (IPCC) Tier 1 approach (27) to estimate carbon stocks in potential natural vegetation masks the variability caused by natural disturbance, topography, microclimate, and soil type. Therefore, estimates may be too high or too low for some locations (19). A recent study suggests that the default values used in this approach underestimate carbon stocks for ecosystems such as temperate moist forests (28). We also lacked carbon stock data for the majority of woody crops; however, this assumption likely has little effect on the overall analysis, because woody crops occupy only 9% of the total cropland. Although the World Soil Information (ISRIC) soil data represent the best comprehensive datasets of soil carbon estimates, we must note that knowledge of these stocks is somewhat uncertain (7, 29, 30). Furthermore, land management practices are not included in our analysis; thus, it does not account for the greenhouse gases emitted to generate the crop yield, such as the fertilizer production needed to produce the high yields in temperate regions. Other studies that accounted for additional aspects of the life cycle indicate that yield increases through increased fertilization and mechanization emit fewer greenhouse gases than older technology (31) and that the gains in greenhouse gas reduction outweigh the greenhouse gas costs of production (32). Pastures were excluded in this analysis, because we lacked production units equivalent to crop yield.
Tradeoffs of carbon stocks and crop yield provide a starting point for policy discussions and future research. Although our study omits life cycle emissions from crop production, it suggests that increasing yield on existing tropical croplands is preferable to clearing new land. To reduce future carbon emissions and meet crop demands, private and multilateral investments should focus on maintaining or restoring tropical forests and increasing yields through low petroleum inputs on existing cropland.
Land conversion and farming practices affect not only carbon storage but also other ecosystem services (33). Agriculture strongly affects soil and groundwater recharge, runoff, and nutrient regulation as well as ecosystems, species, and genome diversity of landscapes (2, 11, 12, 23, 34–36). Much more work is needed to understand how farming practices and potential technological improvements affect tradeoffs among crop yield, carbon storage, and other ecosystem services such as water availability, pest control, and pollination. Our work is a step to resolving the tradeoffs in the full portfolio of ecosystem services affected by land use and agriculture decisions.
Full accounting for the net effects of agricultural decisions must consider the global implications, such as displacement of land use activities to other regions, and their effects on multiple ecosystem services. Ecosystem services affected by agriculture include provisioning of food, fiber, and freshwater, regulation of climate through carbon storage as well as biophysical influence on regional air temperature and moisture, regulation of soil and groundwater recharge, runoff, and nutrient flows to freshwater, and cultural values of landscapes (2, 11, 23, 34, 36, 37). In addition, agriculture directly affects aspects of natural capital like heterogeneity of landscapes, which includes diversity of ecosystem types and species (12, 22, 23).
Methods
Average crop yield for each ∼10- × 10-km cell was weighted by each crop's harvested area (9). Multicropping systems are accounted for in the harvested area data (9). Carbon stocks in potential natural vegetation were estimated by applying the IPCC Tier 1 methodology (27) to potential vegetation and soil datasets using a committed carbon flux approach (38). We then estimated carbon stocks of herbaceous crops using yield data and methods for calculating net primary productivity (NPP) (9) and assumed that annual NPP was equivalent to the standing carbon stock for most crops. This assumption is conservative, because aboveground biomass is only present for part of the year and then, harvested. Woody crop carbon stocks were estimated using IPCC Tier 1 methodology (27) and the extrapolation approach defined in Gibbs et al. (15). We estimated the change in terrestrial carbon storage from cropland conversion by calculating the difference between carbon stocks in current croplands and potential vegetation. Using these analyses, we quantified and mapped the tradeoff between carbon stocks and crop production by calculating the ratio of carbon loss to crop yield (Fig. 3 and Table 1). Detailed methods for estimating carbon in natural vegetation and croplands are provided in SI Text, Fig. S1, and Table S1.
Supplementary Material
Acknowledgments
Aaron Ruesch helped calculate soil carbon loss estimates. Mary Sternitzky helped create the figures. We thank George Allez for his editing suggestions and Gretchen Daily, Richard Houghton, and two anonymous reviewers for their helpful comments. We appreciate the invitation from Ruth DeFries to be included in this special feature. Funding for this research was provided by a Dr. Laurel Salton Clark Memorial Graduate Fellowship from National Aeronautics and Space Administration (NASA) and the Wisconsin Space Grant Consortium, NASA's Interdisciplinary Science Program, a US Department of Energy Global Change Environmental Program Fellowship, and The Nature Conservancy.
Footnotes
The authors declare no conflict of interest.
This article is a PNAS Direct Submission.
This article contains supporting information online at www.pnas.org/lookup/suppl/doi:10.1073/pnas.1011078107/-/DCSupplemental.
References
- 1.Food and Agricultural Organization of the United Nations FAO statistical database. 2009. Available at http://faostat.fao.org/. Accessed July 30, 2009.
- 2.Foley JA, et al. Global consequences of land use. Science. 2005;309:570–574. doi: 10.1126/science.1111772. [DOI] [PubMed] [Google Scholar]
- 3.Intergovernmental Panel on Climate Change Working Group I . Climate Change 2007. The Physical Science Basis: Summary for Policymakers. New York: Cambridge University Press; 2007. [Google Scholar]
- 4.van der Werf GR, et al. CO2 emissions from forest loss. Nat Geosci. 2009;2:737–738. [Google Scholar]
- 5.Houghton RA, Goodale CL. In: Ecosystems and Land Use Change. DeFries RS, Asner GP, Houghton RA, editors. Washington, DC: American Geophysical Union; 2004. pp. 85–98. [Google Scholar]
- 6.Houghton RA, Hackler JL. Emissions of carbon from land use change in sub-Saharan Africa. J Geophys Res. 2006;111:G02003. [Google Scholar]
- 7.Ramankutty N, et al. Challenges to estimating carbon emissions from tropical deforestation. Glob Change Biol. 2007;13:51–66. [Google Scholar]
- 8.Ramankutty N, Evan AT, Monfreda C, Foley JA. Farming the planet: 1. Geographic distribution of global agricultural lands in the year 2000. Global Biogeochem Cycles. 2008;22:GB1003. [Google Scholar]
- 9.Monfreda C, Ramankutty N, Foley JA. Farming the planet: 2. Geographic distribution of crop areas, yields, physiological types, and net primary production in the year 2000. Global Biogeochem Cycles. 2008;22:GB1022. [Google Scholar]
- 10.Ruesch AS, Gibbs HK. New IPCC Tier-1 Global Biomass Carbon Map For the Year 2000. Carbon Dioxide Information Analysis Center. Oak Ridge, TN: Oak Ridge National Laboratory; 2008. Available at http://cdiac.ornl.gov. [Google Scholar]
- 11.Tilman D, et al. Forecasting agriculturally driven global environmental change. Science. 2001;292:281–284. doi: 10.1126/science.1057544. [DOI] [PubMed] [Google Scholar]
- 12.Balmford A, Green RE, Scharlemann JPW. Sparing land for nature: Exploring the potential impact of changes in agricultural yield on the area needed for crop production. Glob Change Biol. 2005;11:1594–1605. [Google Scholar]
- 13.Alexandratos N. World food and agriculture: Outlook for the medium and longer term. Proc Natl Acad Sci USA. 1999;96:5908–5914. doi: 10.1073/pnas.96.11.5908. [DOI] [PMC free article] [PubMed] [Google Scholar]
- 14.Gibbs HK, et al. Pathways of agricultural expansion across the tropics: Implications for forest resources. Proc Natl Acad Sci USA. 2010;107:16732–16737. doi: 10.1073/pnas.0910275107. [DOI] [PMC free article] [PubMed] [Google Scholar]
- 15.Gibbs HK, et al. Carbon payback times for crop-based biofuel expansion in the tropics: The effects of changing yield and technology. Environ Res Lett. 2008;3:034001. [Google Scholar]
- 16.Fargione J, Hill J, Tilman D, Polasky S, Hawthorne P. Land clearing and the biofuel carbon debt. Science. 2008;319:1235–1238. doi: 10.1126/science.1152747. [DOI] [PubMed] [Google Scholar]
- 17.Danielsen F, et al. Biofuel plantations on forested lands: Double jeopardy for biodiversity and climate. Conserv Biol. 2009;23:348–358. doi: 10.1111/j.1523-1739.2008.01096.x. [DOI] [PubMed] [Google Scholar]
- 18.Piñeiro G, Jobbágy EG, Baker J, Murray BC, Jackson RB. Set-asides can be better climate investment than corn ethanol. Ecol Appl. 2009;19:277–282. doi: 10.1890/08-0645.1. [DOI] [PubMed] [Google Scholar]
- 19.Gibbs HK, Brown S, Niles JO, Foley JA. Monitoring and estimating tropical forest carbon stocks: Making REDD a reality. Environ Res Lett. 2007;2:045023. [Google Scholar]
- 20.Canadell JG, et al. Contributions to accelerating atmospheric CO2 growth from economic activity, carbon intensity, and efficiency of natural sinks. Proc Natl Acad Sci USA. 2007;104:18866–18870. doi: 10.1073/pnas.0702737104. [DOI] [PMC free article] [PubMed] [Google Scholar]
- 21.Ramankutty N, Foley JA, Norman J, McSweeney K. The global distribution of cultivable lands: Current patterns and sensitivity to possible climate change. Glob Ecol Biogeogr. 2002;11:377–392. [Google Scholar]
- 22.Green RE, Cornell SJ, Scharlemann JPW, Balmford A. Farming and the fate of wild nature. Science. 2005;307:550–555. doi: 10.1126/science.1106049. [DOI] [PubMed] [Google Scholar]
- 23.Millennium Ecosystem Assessment . Millennium Ecosystem Assessment: Ecosystems and Human Well-Being. Washington, DC: Island Press; 2005. [Google Scholar]
- 24.Chapin FS, Randerson JT, McGuire AD, Foley JA, Field CB. Changing feedbacks in the climate–biosphere system. Front Ecol Environ. 2008;6:313–320. [Google Scholar]
- 25.Jackson RB, et al. Protecting climate with forests. Environ Res Lett. 2008;3:044006. [Google Scholar]
- 26.Carpenter SR, et al. Science for managing ecosystem services: Beyond the Millennium Ecosystem Assessment. Proc Natl Acad Sci USA. 2009;106:1305–1312. doi: 10.1073/pnas.0808772106. [DOI] [PMC free article] [PubMed] [Google Scholar]
- 27.Eggleston S, Buendia L, Miwa K, Ngara T, Tanabe K. Intergovernmental Panel on Climate Change Guidelines for National Greenhouse Gas Inventories, Intergovernmental Panel on Climate Change. Paris: IPCC Secretariat; 2006. [Google Scholar]
- 28.Keith H, Mackey BG, Lindenmayer DB. Re-evaluation of forest biomass carbon stocks and lessons from the world's most carbon-dense forests. Proc Natl Acad Sci USA. 2009;106:11635–11640. doi: 10.1073/pnas.0901970106. [DOI] [PMC free article] [PubMed] [Google Scholar]
- 29.Guo LB, Gifford RM. Soil carbon stocks and land use change: A meta analysis. Glob Change Biol. 2002;8:345–360. [Google Scholar]
- 30.Murty D, Kirschbaum MUF, Mcmurtrie RE, Mcgilvray H. Does conversion of forest to agricultural land change soil carbon and nitrogen? A review of the literature. Glob Change Biol. 2002;8:105–123. [Google Scholar]
- 31.Burney JA, Davis SJ, Lobell DB. Greenhouse gas mitigation by agricultural intensification. Proc Natl Acad Sci USA. 2010;107:12052–12057. doi: 10.1073/pnas.0914216107. [DOI] [PMC free article] [PubMed] [Google Scholar]
- 32.Hill J, Nelson E, Tilman D, Polasky S, Tiffany D. Environmental, economic, and energetic costs and benefits of biodiesel and ethanol biofuels. Proc Natl Acad Sci USA. 2006;103:11206–11210. doi: 10.1073/pnas.0604600103. [DOI] [PMC free article] [PubMed] [Google Scholar]
- 33.Bennett EM, Peterson GD, Gordon LJ. Understanding relationships among multiple ecosystem services. Ecol Lett. 2009;12:1394–1404. doi: 10.1111/j.1461-0248.2009.01387.x. [DOI] [PubMed] [Google Scholar]
- 34.Matson PA, Parton WJ, Power AG, Swift MJ. Agricultural intensification and ecosystem properties. Science. 1997;277:504–509. doi: 10.1126/science.277.5325.504. [DOI] [PubMed] [Google Scholar]
- 35.Rosegrant MW, Cai X, Cline SA. Global Water Outlook to 2025: Averting an Impending Crisis. Washington, DC: International Food Policy Research Institute; 2002. [Google Scholar]
- 36.Gleick PH. Water use. Annu Rev Environ Resour. 2003;28:275–314. [Google Scholar]
- 37.West PC, Narisma GT, Barford CC, Kucharik CJ, Foley JA. An alternative approach for quantifying climate regulation by ecosystems. Front Ecol Environ. 2010 10.1890/090015. [Google Scholar]
- 38.Fearnside PM. Greenhouse gases from deforestation in Brazilian Amazonia: Net committed emissions. Clim Change. 1997;35:321–360. [Google Scholar]
Associated Data
This section collects any data citations, data availability statements, or supplementary materials included in this article.


