Abstract
This study presents a finite element based computational model to simulate the three-dimensional deformation of the breast and the fibroglandular tissues under compression. The simulation was based on 3D MR images of the breast, and the craniocaudal and mediolateral oblique compression as used in mammography was applied. The geometry of whole breast and the segmented fibroglandular tissues within the breast were reconstructed using triangular meshes by using the Avizo® 6.0 software package. Due to the large deformation in breast compression, a finite element model was used to simulate the non-linear elastic tissue deformation under compression, using the MSC.Marc® software package. The model was tested in 4 cases. The results showed a higher displacement along the compression direction compared to the other two directions. The compressed breast thickness in these 4 cases at 60% compression ratio was in the range of 5-7 cm, which is the typical range of thickness in mammography. The projection of the fibroglandular tissue mesh at 60% compression ratio was compared to the corresponding mammograms of two women, and they demonstrated spatially matched distributions. However, since the compression was based on MRI, which has much coarser spatial resolution than the in-plane resolution of mammography, this method is unlikely to generate a synthetic mammogram close to the clinical quality. Whether this model may be used to understand the technical factors that may impact the variations in breast density measurements needs further investigation. Since this method can be applied to simulate compression of the breast at different views and different compression levels, another possible application is to provide a tool for comparing breast images acquired using different imaging modalities – such as MRI, mammography, whole breast ultrasound, and molecular imaging – that are performed using different body positions and different compression conditions.
Keywords: breast compression, derived mammogram, magnetic resonance images, breast density, volume mesh generation, nonlinear deformation
1. INTRODUCTION
Mammographic density is a quantitative estimate of the proportion of fibroglandular tissue to the total breast area analyzed on mammograms. The fat and fibroglandular tissues are two major components of the breast. The fibroglandular tissue is denser than the fatty tissue, and therefore shows brighter intensity on mammograms. As such, the percentage of the dense tissues in the breast area can be measured based on the contrast shown in the mammogram, which is termed “mammographic density”. There is well-established evidence that a higher mammographic density is associated with an increased risk of breast cancer (Kopans 2008, Boyd et al 2007, Martin et al, 2008, Byrne 2008), suggesting that breast density may play an important role in the evaluation of cancer risk. Women with mammographic density greater than 50% have 3- to 5-fold higher breast cancer risk than those with less than 25% density (Byrne 2008, Wolfe et al 1987, Byrne et al 1995, Boyd et al 1998, Boyd et al 2002).
Despite the established role of breast density as one of the strongest predictors of breast cancer risk, the progress to build the density into the risk assessment model has been relatively slow, which may be in part due to the lack of reliable measurement methods (Boyd et al 2007, Tice et al 2008, Kerlikowske et al 2007, Vachon et al 2008a). Visual estimation was still commonly used in recent publications (Vachon et al 2008a, Vachon et al 2008b, Johansson et al 2008, Stone et al 2006, Heine et al 2008). Quantitative measurements by planimetry, computer-assisted thresholding, and clustering segmentation methods (Glide-Hurst et al 2007) have been reported.
Even if a reliable method can be developed, another fundamental problem is the nature of projection images in mammography. The measured density may depend upon the projection angle, compression level, patient position, and x-ray intensity. Kopans (2008) indicated that the use of two-dimensional (2D) mammograms alone to assess the ratio of dense to fatty tissue in the breast is inaccurate for determining the volume ratios of the soft tissues, and suggested that an accurate breast density should be obtained from the three-dimensional (3D) data based on volumetric measurements. However, some researchers would argue that 2-dimensional measurement still provides very useful information (Hall 2008).
A simple thresholding method uses a computer-assisted technique to outline the dense regions and calculate the percent density by normalizing to the total breast area. The stepwise rise in breast cancer risk associated with higher density was established by using this thresholding method (Byng et al 1994a, Byng et al 1994b, McCormack et al 2007). Recently, there are some efforts to estimate the volumetric density on mammograms considering the overlapping tissue along the projection direction. For example, Ding et al (2008) developed “standard mammogram form (SMF)” to estimate the density volumetrically, but it was found that SMF did not better predict cancer risk when compared to the thresholding method.
Therefore, the variations in the measured density by mammography warrant more research. To investigate this variation, the mammograms taken from the same woman using different positions, compression angles, and compression levels should be compared; however, since radiation is given to the woman, it is not ethical to perform such a study due to the concern of excessive radiation exposure. In this study we explored a new approach to generate synthetic mammograms based on 3D MRI, aiming to demonstrate the feasibility of using this simulation model as a reasonable method for understanding the technical factors that may impact on the variations in breast density measurements. The first step for such a simulation model would be to account for the effects of breast compression. A nonlinear deformation model was applied to estimate the displacement of tissues based on different elastic properties of fibroglandular and fatty tissues from the external force exerted by compression paddles to simulate craniocaudal (CC) and mediolateral (MLO) view compressions. After simulated compression, a synthetic projection image of the dense tissue was formed and compared to the clinical mammogram of the same woman. The extent of deformation at different compression views (CC and MLO) and different levels (20%, 40%, and 60%) were compared. The purpose of this work is to demonstrate the feasibility of this finite element based nonlinear deformation model for simulating breast compression. This initial experience would provide a foundation for further refinement of this model and for evaluation of its potential clinical applications in the future.
2. METHOD
2.1. Breast segmentation
The MRI study was performed on a 1.5 T Eclipse scanner (Philips, Cleveland, OH) using a dedicated four-channel breast coil. For case #1 and case #2, the pre-contrast T1-weighted images without fat saturation were obtained using a 3D SPGR (RF-FAST) pulse sequence, with TR=1.8 ms, TE=4.0 ms, slice thickness=4.0 mm, flip angle=20, matrix size=256×256, FOV=380 mm. A total of thirty-two axial slices were used to cover the entire breast. The corresponding voxel size was 1.48 × 1.48 × 4 mm3. Case #3 and #4 were acquired using different parameters, with 27 slices and the corresponding voxel size of 0.64 × 0.64 × 5 mm3. The mammograms of these two women taken within 6 months of their MRI were available for comparison.
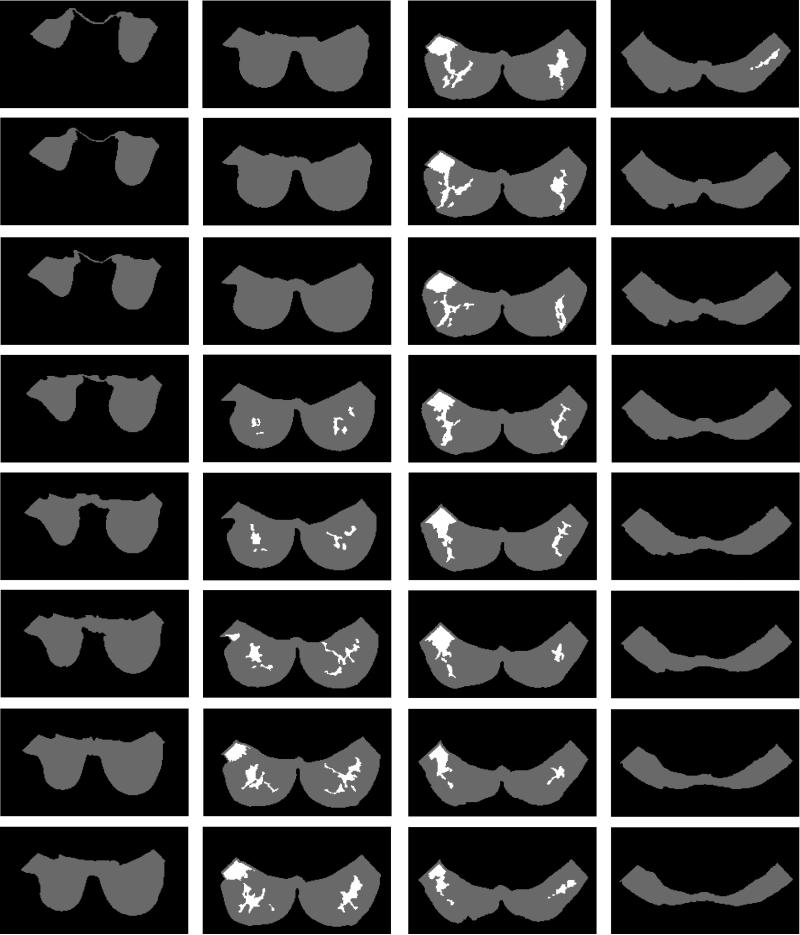
A computer-assisted algorithm was employed to segment the fatty and the fibroglandular tissues from MR images, based on the method reported in Nie et al (2008). The breast was segmented from the body using the following procedures: (a) perform an initial V-shape cutting using three body landmarks to determine the posterior cutoff points of breast in the lateral boundary; (b) apply a fuzzy C-means (FCM) based segmentation algorithm with the B-spline curve fitting to obtain the boundary of the chest wall muscle. The curve is computed by fitting to a set of data points by basis function of a fixed order and knots (Park and Lee 2007, Wang et al 2006). Dynamic searching is used to exclude skin. After the breast region is obtained, the fuzzy C-means clustering algorithm is applied for homogeneity correction and segmentation between the fibroglandular and fatty tissues. Fuzzy C-means algorithm uses a fuzzy pixel classification to segment images (Bezdek 1981, Kulkarni 2001, Chen and Giger 2004). The number of classes in the dataset has to be determined by the operator (Dunn 1973, Ahmed et al 2002, Bezdek 1980). The segmentation results of case #1 are shown in figure 1. On MRI, breast tumors and the fibroglandular tissues showed similar signal intensities, which would result in the tumor being erroneously classified as fibroglandular tissue. Therefore, for each of the 4 cases, only the normal breast without known tumors was analyzed in this study.
Fig. 1.
The segmented fatty tissue (gray areas) and the fibroglandular tissue (white areas) of case #1 by using the MRI-based segmentation method (Nie et al., 2008).
2.2. 3D breast surface generation
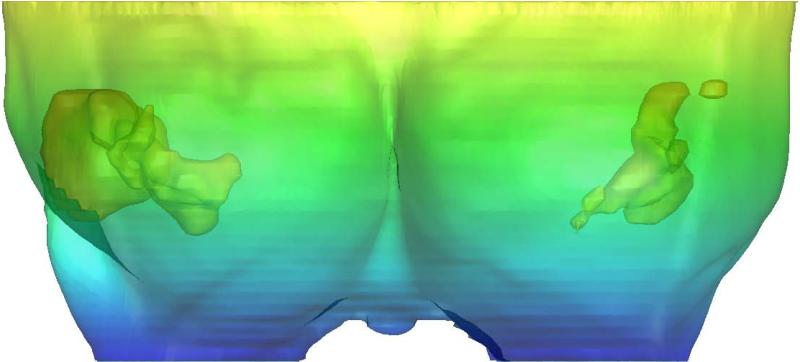
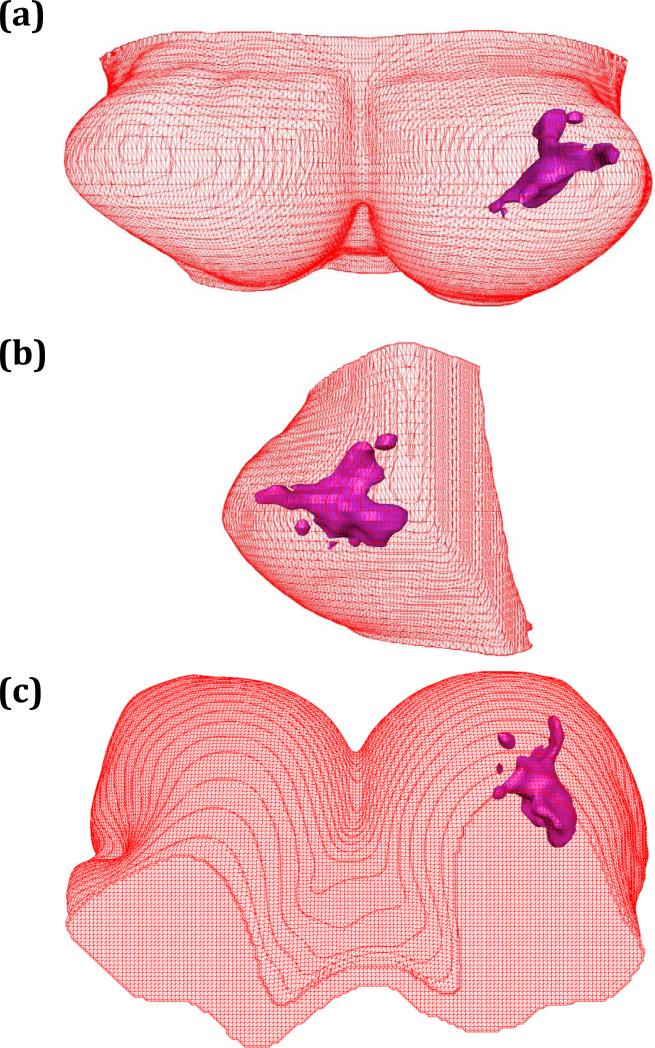
In order to generate the volume mesh of the breast, the outside surface of the whole breast first needed to be determined. Currently available medical imaging software for 3D reconstruction treats objects as surface components. The surface triangulation uses a set of triangular facets of different sizes to cover the surface (Kluess et al 2009, Cuillière 1998, Shi et al 2006, Shewchuk 2002, Rypl and Bittnar 2004, Boissonnat et al 2005). This process was done using the Avizo® 6.0 software package (Visage Imaging Inc., Carlsbad, California, USA). The Delaunay triangulation was employed to build topological structures from the MR images. The outside surface of the whole breast contained 56,098 points and 109,248 faces (i.e., triangular elements). The 3D surface of case #1 is shown in figure 2. The 3D surface geometry of the fibroglandular tissue within the breast was also generated, as demonstrated in figure 3. The following step was to generate the volume mesh.
Fig. 2.
The 3D surface of the whole breast and the fibroglandular tissues generated by using Avizo® 6.0 software package based on the segmentation results shown in Fig.1.
Fig. 3.
The 3D surface generation of breast and fibroglandular tissues of case #1 reconstructed by Avizo® 6.0 software to show the coronal view (a, the front view from anterior to posterior), sagittal view (b, the side view from lateral to medial), and axial view (c, from superior to inferior).
2.3. Volume mesh generation
The finite element software package MSC.Marc® (MSC Software Corporation, Santa Ana, California, USA) was used to generate the volume mesh from the 3D surface geometry of the breast and the fibroglandular tissues, shown in figure 4. Due to the limited computing capacity of the PC (Intel core 2 CPU, T7400@2.16GHz, 2 GB RAM), in order for the MSC.Marc software to work well, the number of triangular elements used to cover the breast surface had to be reduced from 109,248 to 10,000. The tetrahedral volume mesh with 4 nodes was defined as one element. The breast was meshed into 23,777 elements, 21,417 for the fatty tissue and 2,360 for the fibroglandular tissue. After creating the volume meshes, different elastic properties were assigned to the fatty tissue and fibroglandular tissue, respectively.
Fig. 4.
The volume mesh of the left breast and the fibroglandular tissues of case #1 generated by using the finite element software package MSC.Marc®. The mesh lines indicate the finite elements used.
2.4. Breast compression modeling
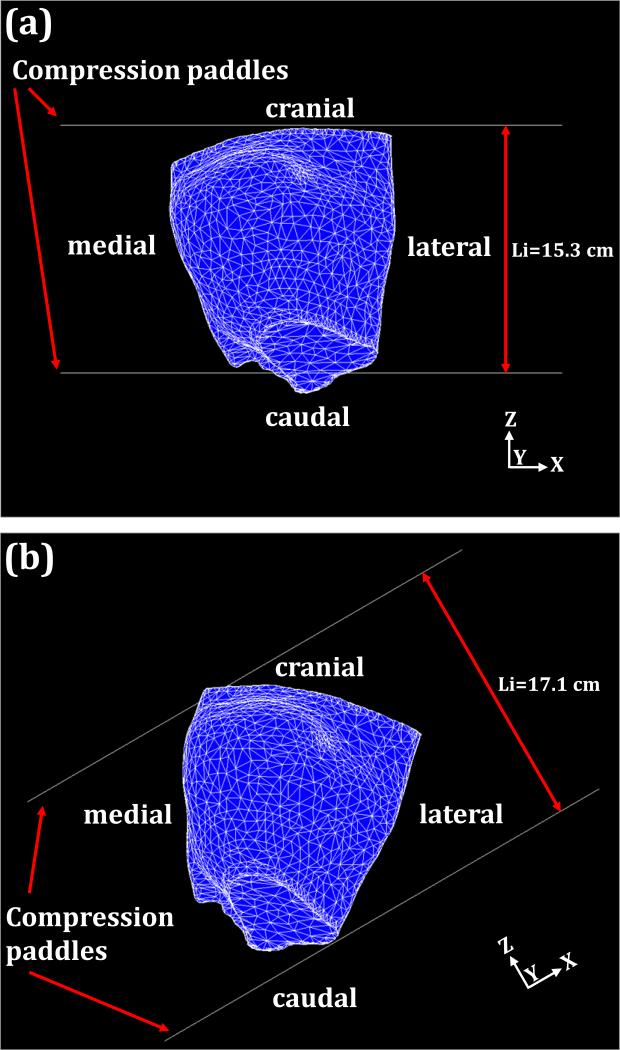
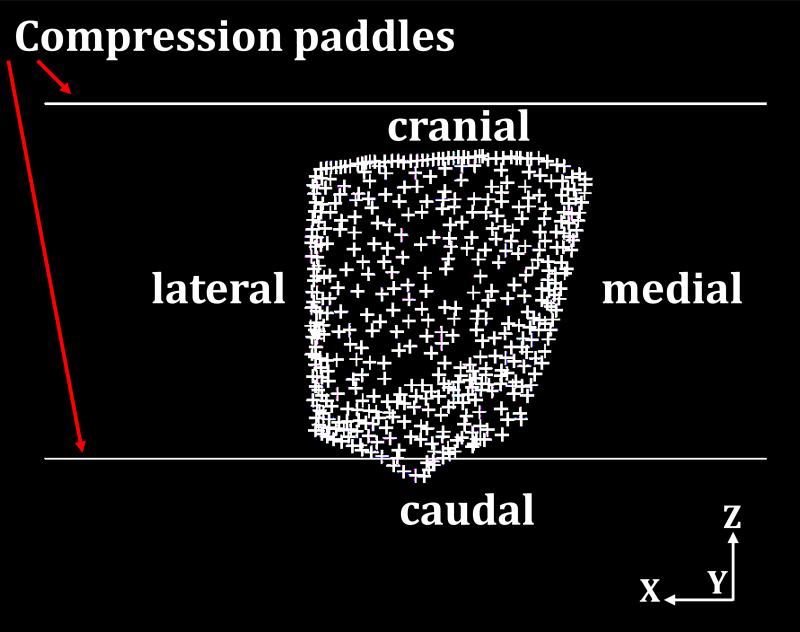
The compression force was applied to simulate the deformation of breast under craniocaudal (CC) and mediolateral oblique (MLO) compression, depicted in figures 5(a) and 5(b), respectively. The compression direction was defined as the z-axis. The MSC.Marc® software package was used to simulate the nonlinear breast compression under mechanical loading exerted by the compression paddles. The coefficient of friction between the breast surface and the compression paddles was set to 0.2 (taken from Yin et al. 2004). As shown in figure 5, the upper paddle and the lower paddle moved along the opposite z-axis direction. The compression ratio was defined as 1-(Lf/Li), where Lf is the thickness of the breast after compression and Li is the thickness of the breast in the compressed direction before the external force is applied. The two compression paddles on the breast surface were treated as a rigid body with a moving contact boundary during the compression process. For CC compression, the direction perpendicular to the chest wall was defined as the y-axis. The node on the posterior surface (i.e. sitting on the ribcage), shown in figure 6, should have zero displacement along the y-direction, and was used as the boundary condition. There are a total of 454 nodes on this surface, and they can only slide within the x-z plane parallel to chest wall during the deformation under compression.
Fig. 5.
The breast compression using two planar paddles for CC view compression (a) and MLO view compression (b) for case # 1. Each paddle size is 24 × 30 cm2. The arrows indicate the moving direction of the compression paddle. The compression paddles move toward each other. The initial distances between compression paddles are 15.3 cm for CC compressions and 17.1 cm for MLO compressions.
Fig. 6.
The fixed y-direction displacement on the posterior breast surface during compression as the boundary condition. The crosses indicate the posterior nodes with fixed displacement along the y-axis direction.
2.5. Nonlinear breast compression
For most medical applications with a small tissue deformation of less than 5% strain, the linear elasticity model is commonly used. Since the deformation of breast under mammography compression is much larger (i.e. over 5%), the hyperelastic model is required to describe the nonlinear strain-stress behavior (Rivlin 1948, Holzapfel 2001, Azar et al 2002, Samani and Plewes 2004, Yin et al 2004,Tanner et al 2006, Bechir et al 2006, Sokhanvar et al 2008, Horgan and Murphy 2009). A strain energy density function for quasi-incompressible hyperelastic materials in terms of the strain invariants is defined in the following references (Rivlin 1948, Holzapfel 2001, Bechir et al 2006, Sokhanvar et al 2008, Horgan and Murphy 2009). The strain of the hyperelastic materials is recoverable after the applied force is lifted.
For the Moony-Rivlin materials, the strain-energy density function can be described as the simplest rational polynomial representation (Holzapfel 2001, Bechir et al 2006, Horgan and Murphy 2009). Based on the polynomial model, the measured strain energy coefficients of fatty and fibroglandular tissues were reported by Tanner et al (2006) and Samani and Plewes (2004), and they were used in our simulation model: (C01 =1,333 Pa and C10 = 2,000 Pa) for fatty tissue, and (C01 =2,333.3 Pa and C10 =3,500 Pa) for fibroglandular tissue (Krouskop et al 1998).
Finally, the finite element software package MSC.Marc® was used to simulate breast compression at various compression ratios from 0 to 60%. The moving velocity of the two paddles toward each other was set at 0.02 cm s-1, and the time step for each iteration was 0.5 sec. When the time reached 133 sec, each compression paddle moved 2.66 cm. The thickness of the breast before compression was 13.3 cm, hence the compression ratio was approximately 40% at this time point (2.66×2/13.3=0.4). Different compression ratios can be achieved by adjusting the compression time.
3. RESULTS
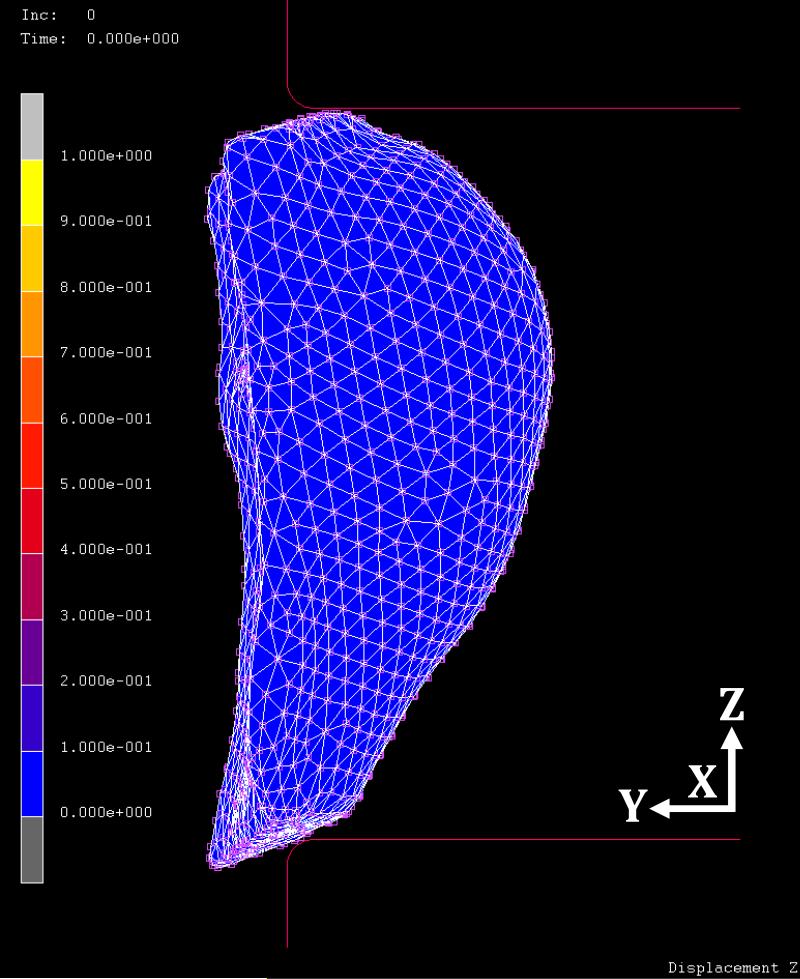
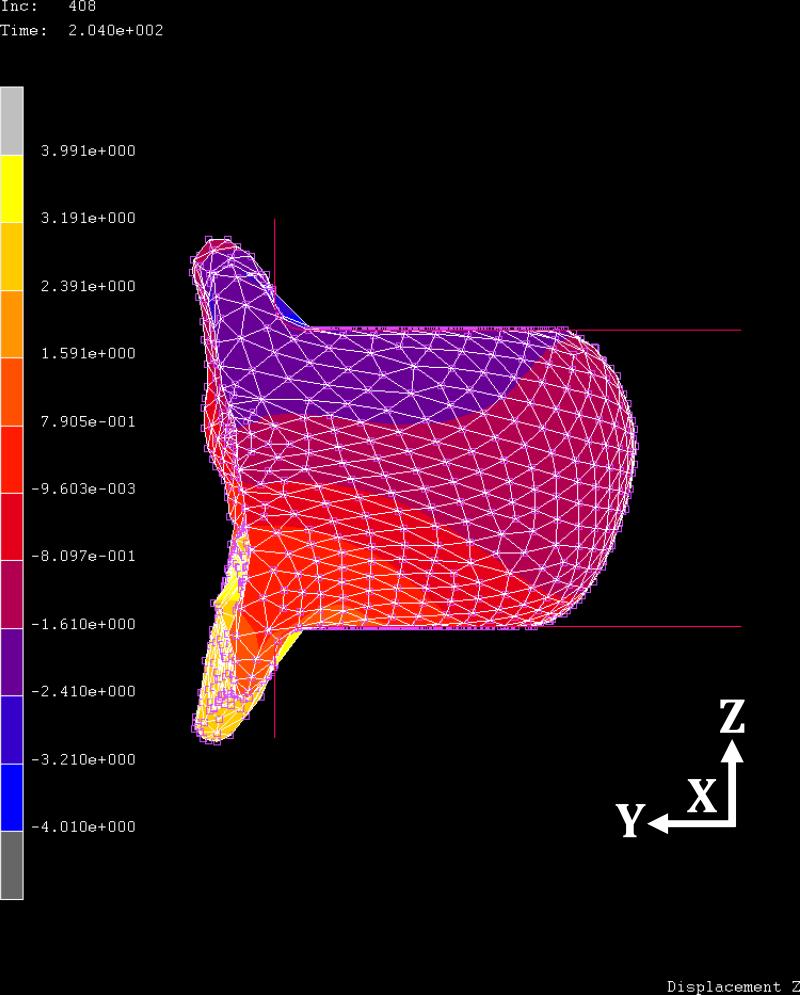
Figure 7 shows the initial uncompressed breast in the z-axis direction before applying the CC view compression for case #2. Figure 8 shows the compressed breast at 60% ratio. The regional displacements are indicated by colors defined in the colorbar. The maximum displacement in the z-axis is -4.01 cm in negative z direction, and 3.99 cm in the positive z direction. At this compression ratio, the ranges of displacements are from -1.8 to 2.7 cm in the x-axis, and from -1.7 to 0.7 cm in the y-axis, respectively. The displacement in the z-direction (the compression direction between the two paddles) is greater compared to x- and y- displacements. While the compression paddles were moving along the z-axis direction, the posterior breast (i.e., the chest wall on ribcage) was fixed as the boundary condition; thus, the breast tissue was pushed away from the chest wall, as shown in figure 8.
Fig. 7.
The side view of the initial uncompressed breast before applying the CC view compression for case #2.
Fig. 8.
The side view of the breast deformation at 60% compression ratio in CC view compression for case #2. The relative displacement in the z-axis direction is indicated by colors on the sagittal view image. The range between the minimum and maximum displacement values are equally divided into 10 levels, shown by different colors. The blue and yellow color bars indicate the minimum and maximum values of displacements, in which the range of displacement in the z-axis direction is -4.01 to 3.99 cm.
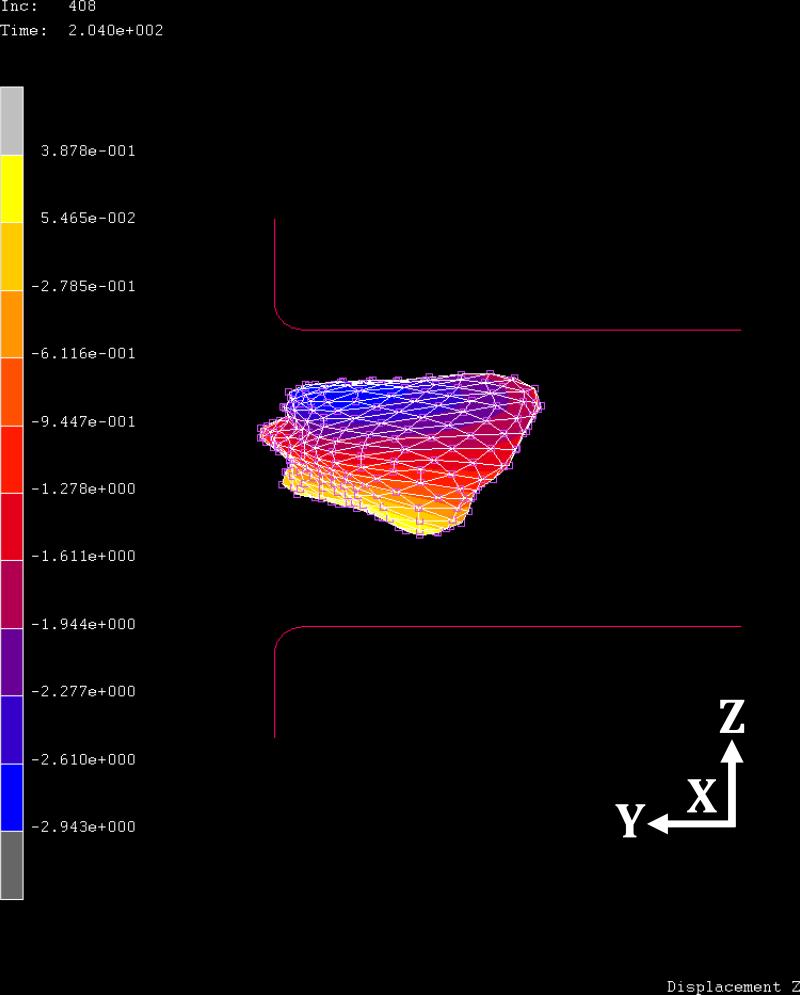
Figure 9 shows the corresponding z-axis deformation of the fibroglandular tissues within the breast at 60% compression ratio. The ranges of displacement are -2.94 to 0.38 cm in the z-axis direction, -0.03 to 2.3 cm in the x-axis, and -1.6 to -0.2 cm in the y-axis, respectively. The fibroglandular tissue has a higher stiffness than the fatty tissue, and is expected to show a smaller deformation.
Fig. 9.
The corresponding side view of the deformation of fibroglandular tissue of Fig. 7 for case #2 with CC view compression at 60% compression ratio. The blue and yellow color bars indicate the minimum and maximum values of displacements, in which the range of displacement in the z-axis direction is -2.94 to 0.38 cm.
A similar procedure can be used to simulate MLO compression by changing the location and the angle of the compression plate (as shown in figure 5b). The displacement along the compression direction (z-axis) was larger than along the other two directions. In order to compare the relative displacements at different compression ratios (20%, 40%, 60%) and along the three directions (x, y, z), the maximum total displacement is calculated from the range and listed in Table 1. For example, at 60% compression ratio, the range along z-axis is -4.01 to 3.99 cm, so the maximum total displacement is 8.0 cm. Similarly, for x-axis the range is -1.8 to 2.7 cm, so the maximum total displacement is 4.5 cm; and for y-axis the range is -1.7 to 0.7 cm, so the maximum total displacement is 2.4 cm. In Table 1, it can be seen that in all 4 cases either under CC or MLO compression, the displacement is always greater along the z-axis compared to x- and y-axis; also, the displacement is greater at higher compression ratios.
TABLE 1.
The maximum total displacement (in cm) along x-, y-, and z-axis directions
| Compression ratio (%) | 20 | 40 | 60 | |||||||
|---|---|---|---|---|---|---|---|---|---|---|
| Direction | x | y | z | x | y | z | x | y | z | |
| Case # 1 | CC* | 0.9 | 0.6 | 2.8 | 2.7 | 2.0 | 5.9 | 6.2 | 3.8 | 8.9 |
| MLO** | 1.3 | 0.6 | 3.3 | 2.5 | 1.2 | 6.7 | 5.3 | 2.7 | 10.2 | |
| Case # 2 | CC | 0.9 | 0.4 | 2.6 | 2.3 | 1.2 | 5.4 | 4.5 | 2.4 | 8.0 |
| MLO | 0.4 | 1.3 | 2.8 | 0.9 | 2.3 | 5.5 | 2.0 | 3.6 | 8.3 | |
| Case # 3 | CC | 0.8 | 0.5 | 2.4 | 2.0 | 1.4 | 5.0 | 3.6 | 2.2 | 7.7 |
| MLO | 0.2 | 0.2 | 2.1 | 1.4 | 0.4 | 3.3 | 2.2 | 1.0 | 6.2 | |
| Case # 4 | CC | 0.8 | 0.5 | 2.8 | 2.2 | 1.4 | 5.8 | 4.1 | 2.5 | 8.8 |
| MLO | 1.3 | 0.2 | 2.2 | 2.9 | 1.2 | 5.1 | 3.6 | 2.3 | 8.1 | |
Craniocaudal (CC) view compression
Mediolateral oblique(MLO) view compression
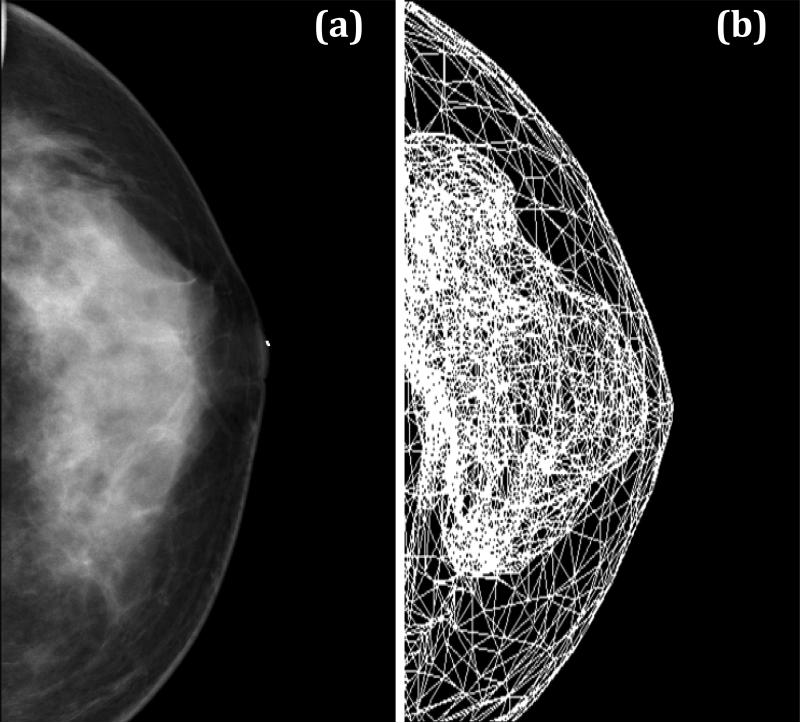
Although the model yields reasonable results, it is very difficult to design validation experiments to verify the deformation, even with simple phantoms. Since one goal of the simulation model is to generate synthetic mammograms, the projection images of case #3 and #4 were generated for comparison with their corresponding mammograms taken within 6 months of MRI. The simulation model was applied to compress the breast to 60% ratio under CC compression, and then a projection image of the finite element mesh was obtained. Figure 10 shows the patient's mammogram and the simulated projection images after CC compression for case #3, and figure 11 shows the results for case #4. In general, the shape of the projected fibroglandular tissue after CC compression resembles the distribution of dense tissue on the patient's mammogram.
Fig. 10.
Comparison of the CC view mammogram for case #3 (a) and the projection image obtained using our simulation model at 60% compression ratio (b). The distribution of the fibroglandular tissues on the simulated projection image resembles the distribution of dense tissues on the patient mammogram.
Fig. 11.
Comparison of the CC view mammogram for case #4 (a) and the projection image obtained using our simulation model at 60% compression ratio (b). The distribution of the fibroglandular tissues on the simulated projection image resembles the distribution of dense tissues on the patient mammogram.
4. DISCUSSION
In this study we presented a nonlinear deformation model to estimate the displacement of tissues based on different elastic properties of fibroglandular and fatty tissues under CC and MLO compression. The motivation came from the difficulty in the analysis of the dependence of mammographic density measurements on various technical factors, such as compression level, compression angle (relatively with the position of the woman), and x-ray intensity used in human studies. If a reliable simulation model can be developed, it may be further developed to investigate these different technical factors by simulating different conditions. The model starts with a 3D distribution of the fatty and fibroglandular tissues analyzed from MRI. The segmentation method used in this work was published (Nie et al, 2008). Several other groups have also reported their own methods for segmentation of breast and fibroglandular tissues on MRI (Wei et al 2004, Klifa et al 2004, Khazen et al 2008, Ursin and Qureshi 2009). Basically all segmentation methods are based on the different signal intensities of fatty and fibroglandular tissues, and any method that can achieve a reasonable segmentation result can be used for the simulation using our model presented here.
The surface of the breast was smooth yet large, and the surface of the fibroglandular tissues was quite complex; nevertheless this 3D irregular surface could be successfully reconstructed by using the Avizo® 6.0 software package as shown in figure 3 using 109,248 elements. However, the surface was used in the next step to generate the volume mesh for deformation analysis, and due to the limitations in computing power, we had to reduce the number of surface elements from 109,248 to 10,000. This led to a compromise in the spatial resolution that can be achieved in the present simulation. The finite element software package MSC.Marc® provided a great tool for simulating the compression, and also it allowed analysis of displacement at each node. These two software packages can be used together to generate 3D images of the compressed breast.
Other commonly used software packages include Amira® software for generating 3D breast surfaces and ANSYS® software for generating breast volume meshes (Hipwell et al 2007). The simulation of soft tissue deformation using the finite element method can be performed using ABAQUS® and ANSYS® (Tanner et al 2006, Hipwell et al 2007, del Palomar et al 2008, Misra et al 2009). Because most finite element analysis programs use linear elastic models, they can only simulate small deformations that do not exceed the linear elastic range of the materials. The MSC.Marc® has no such limitations, and also it can be easily applied to model the contact relationship between the breast surface and compression paddles.
In the 4 cases that were analyzed here, the compressed breast thickness at 60% compression ratio was in the range of 5-7 cm, which was close to the clinical mammography compression range. Therefore in our simulations we analyzed the compression up to this level. For verification of our results, we generated the projection image based on 60% compression ratio from 2 women who had corresponding mammograms taken within 6 months of MRI for comparison. The distribution of the fibroglandular tissue inside the breast on the projection image was similar to that on patient's mammogram (figures 10 and 11). These initial results were encouraging.
However, in this work we have yet to realistically simulate the mammogram. Mammogram has the highest in-plane spatial resolution (approximately 0.1 to 0.2 mm) among all medical imaging modalities, but it acquires projection image, thus no depth resolution. The MRI images used in this study had the voxel resolution of 1.48 × 1.48 × 4 mm3 or 0.64 × 0.64 × 5 mm3, and even with the most advanced imaging protocol that had voxel size of 0.4 × 0.4 × 1-1.5 mm, still it would not be possible to generate a synthetic mammogram that had 0.1-0.2 mm resolution to see the fine details of density. Nevertheless, the high resolution for mammogram was needed only for visualization of micro-calcifications, not for measurement of density. From this point of view, if the computation power can be enhanced to allow a higher number of elements, the spatial resolution of the generated synthetic mammograms may be improved.
In this work we have not attempted to generate a mammogram yet. In order to achieve this, one needs to simulate the attenuation of x-ray penetrating through the breast tissue, and then produce the mammogram based on either film properties for film-based mammography, or detector properties for digital mammography. When these obstacles are resolved, a comprehensive simulation program can be developed to assist in the investigation of the dependence of breast density measurements on various technical factors, such as compression level, compression angle, and x-ray sources and detectors.
Another potential application of this compression simulation model is to allow registration of breast images acquired using different imaging modalities. Currently, mammograms are taken when the patient is at a standing position, ultrasound is taken at a supine position, MRI is taken at a prone position, and nuclear medicine imaging (including positron emission mammography and breast specific scintigraphic imaging) is done at a sitting position. The deformation of the breast between these different positions with different level of compressions may be simulated using the model presented here, by considering both the gravity force and the force exerted by the compression plates. This would allow registration of images taken using different modalities to improve the diagnosis of breast lesions, based on the collective information that is known to be taken from the same lesion.
5. CONCLUSIONS
We presented a finite element method for simulating the large deformation of breast tissues under CC and MLO compressions at different compression levels. The simulation starts with modeling the breast surface shown on uncompressed 3D MRI and the segmented fibroglandular tissues within the breast. Different elastic properties were assigned to the fatty and fibroglandular tissues to simulate deformation in different conditions. This model provides a basis for adding more sophisticated functions in the future for addressing clinical research problems, e.g. to generate synthetic mammograms to aid in investigation of breast density measurements on technical factors, or to allow co-registration of breast images taken by different imaging modalities for a better diagnosis of breast lesions.
ACKNOWLEDGMENTS
This study was supported in part by the National Science Council of the Republic of China under Grant No. NSC-98-2221-E-039-009, partially by the China Medical University projects under No. CMU98-S-49 and the Distinguished Professor Research Project under No. CMU97-161, NIH R03 CA136071 and CBCRP 14GB-0148.
REFERENCES
- Ahmed MN, Yamany SM, Mohamed N, Farag AA, Moriarty T. A modified fuzzy c-means algorithm for bias field estimation and segmentation of MRI data. IEEE Trans. Med. Imaging. 2002;21:193–199. doi: 10.1109/42.996338. [DOI] [PubMed] [Google Scholar]
- Azar FS, Metaxas DN, Schnall MD. Methods for modeling and predicting mechanical deformations of the breast under external perturbations. Med. Imag. Anal. 2002;6:1–27. doi: 10.1016/s1361-8415(01)00053-6. [DOI] [PubMed] [Google Scholar]
- Bechir H, Chevalier L, Chaouche M, Boufala K. Hyperelastic constitutive model for rubber-like materials based on the first Seth strain measures invariant. European J. Mechanics A/Solid. 2006;25:110–124. [Google Scholar]
- Bezdek JC. A convergence theorem for the fuzzy ISODATA clustering algorithms. IEEE Pattern Analysis Machine Intelligence. 1980;PAMI-2:1–8. doi: 10.1109/tpami.1980.4766964. [DOI] [PubMed] [Google Scholar]
- Bezdek JC. Pattern Recognition with Fuzzy Objective Function Algorithms. Plenum; New York: 1981. [Google Scholar]
- Boissonnat JD, Chaine R, Frey P, Malandain G, Salmon S, Saltel E, Thiriet M. From arteriographies to computational flow in secular aneurisms: the INRIA experience. Med. Imag. Anal. 2005;9:133–143. doi: 10.1016/j.media.2004.11.004. [DOI] [PubMed] [Google Scholar]
- Boyd NF, Lockwood GA, Byng JW, Tritchler DL, Yaffe MJ. Mammographic densities and breast cancer risk. Cancer Epidemiol. Biomarkers Prev. 1998;7:1133–1144. [PubMed] [Google Scholar]
- Boyd NF, Dite GS, Stone J, Gunasekara A, English DR, McCredie MRE, Giles GG, Tritchler D, Chiarelli A, Yaffe MJ, Hopper JL. Heritability of mammographic density, a risk factor for breast cancer. N. Engl. J. Med. 2002;347:886–894. doi: 10.1056/NEJMoa013390. [DOI] [PubMed] [Google Scholar]
- Boyd NF, Guo H, Martin LJ, Sun L, Stone J, Fishell E, Jong RA, Hislop G, Chiarelli A, Minkin S, Yaffe MJ. Mammographic density and the risk and detection of breast cancer. N. Engl. J. Med. 2007;356:227–236. doi: 10.1056/NEJMoa062790. [DOI] [PubMed] [Google Scholar]
- Byng JW, Boyd NF, Fishell E, Jong RA, Yaffe MJ. The quantitative analysis of mammographic densities. Phys. Med. Biol. 1994;39:1629–1638. doi: 10.1088/0031-9155/39/10/008. [DOI] [PubMed] [Google Scholar]
- Byng JW, Yaffe MJ, Jong RA, Sbumak RS, Lockwood GA, Tritchler DL, Boyd NF. Analysis of mammographic density and breast cancer risk from digitized mammograms. Radiographics. 1998;18:1587–1598. doi: 10.1148/radiographics.18.6.9821201. [DOI] [PubMed] [Google Scholar]
- Byrne C, Schairer C, Wolfe J, Parekh N, Salane M, Brinton LA, Hoover R, Haile R. Mammographic features and breast cancer risk: effects with time, age, and menopause status. J. Natl. Cancer Inst. 1995;87:1622–1629. doi: 10.1093/jnci/87.21.1622. [DOI] [PubMed] [Google Scholar]
- Byrne C. Invited commentary: assessing breast density change-lessons for future studies. Am. J. Epidemiol. 2008;167:1037–1040. doi: 10.1093/aje/kwn062. [DOI] [PubMed] [Google Scholar]
- Chen W, Giger ML. A fuzzy c-means (FCM) based algorithm for intensity inhomogeneity correction and segmentation of MR images. IEEE International Symposium on Biomedical Imaging (ISBI): From Nano to Macro.2004. pp. 1307–1310. [Google Scholar]
- Cuillière JC. An adaptive method for the automatic triangulation of 3D parametric surfaces. Computer-Aided Design. 1998;30:139–149. [Google Scholar]
- del Palomar AP, Calvo B, Herrero J, López J, Doblaré M. A finite element model to accurately predict real deformations of the breast. Med. Eng. Phys. 2008;30:1089–1097. doi: 10.1016/j.medengphy.2008.01.005. [DOI] [PubMed] [Google Scholar]
- Ding JR, Warren, Warsi I, Day N, Thompson D, Brady M, Tromans C, Highnam R, Easton D. Evaluating the effectiveness of using standard mammogram form to predict breast cancer risk: case-control study. Cancer Epidemiol, Biomarkers Prev. 2008;17:1074–1081. doi: 10.1158/1055-9965.EPI-07-2634. [DOI] [PubMed] [Google Scholar]
- Dunn JC. A fuzzy relative of the ISODATA process and its use in detecting compact well-separated clusters. Cybernetics and Systems. 1973;3:32–57. [Google Scholar]
- Glide-Hurst CK, Duric N, Littrup P. A new method for quantitative analysis of mammographic density. Med. Phys. 2007;34:4491–4498. doi: 10.1118/1.2789407. [DOI] [PubMed] [Google Scholar]
- Hall FM. Letters to the editor-Mammographically determined breast density and cancer risk. Radiology. 2008;248:1083. doi: 10.1148/radiol.2483080512. [DOI] [PubMed] [Google Scholar]
- Heine JJ, Carston MJ, Scott CG, Brandt KR, Wu F, Pankratz VS, Sellers TA, Vachon CM. An automated approach for estimation of breast density. Cancer Epidemiol, Biomarkers Prev. 2008;17:3090–3097. doi: 10.1158/1055-9965.EPI-08-0170. [DOI] [PMC free article] [PubMed] [Google Scholar]
- Hipwell JH, Tanner C, Crum WR, Schnabel JA, Hawkes DJ. A new validation method for X-ray mammogram registration algorithms using a projection model of breast X-ray compression. IEEE Trans. Med. Imaging. 2007;26:1190–1200. doi: 10.1109/TMI.2007.903569. [DOI] [PubMed] [Google Scholar]
- Holzapfel GA. Nonlinear Solid Mechanics: A Continuum Approach for Engineering Science. 2 ed. Chichester, Wiley; New York: 2001. [Google Scholar]
- Horgan CO, Murphy JG. Compression tests and constitutive models for the slight compressibility of elastic rubber-like materials. Int. J. Eng. Sci. 2009;47:1232–1239. [Google Scholar]
- Johansson H, Gandini S, Bonanni B, Mariette F, Gueerrieri-Gonzaga A, Serrano D, Cassano E, Ramazzotto F, Baglietto L, Sandri MT, Decensi A. Relationships between circulating hormone levels, mammographic percent density and breast cancer risk factors in postmenopausal. Breast Cancer Res. Treat. 2008;108:57–67. doi: 10.1007/s10549-007-9577-9. [DOI] [PubMed] [Google Scholar]
- Kerlikowske K, Ichikawa L, Miglioretti DL, Buist DSM, Vacek PM, Smith-Bindman R, Yankaskas B, Carney PA, Ballard-Barbash R. Longitudinal measurement of clinical mammographic breast density to improve estimation of breast cancer risk. J. Natl. Cancer Inst. 2007;99:386–395. doi: 10.1093/jnci/djk066. [DOI] [PubMed] [Google Scholar]
- Klifa C, Carballido-Gamio J, Wilmes L, Laprie A, Lobo C, DeMicco E, Watkins M, Shepherd J, Gibbs J, Hylton N. Quantification of breast index from MR data using fuzzy clustering. Conf. Proc. IEEE Eng. Med. Biol. Soc. 2004;3:1667–1670. doi: 10.1109/IEMBS.2004.1403503. [DOI] [PubMed] [Google Scholar]
- Kluess D, Souffrant R, Mittelmeier W, Wree A, Schmitz K, Bader R. A convenient approach for finite-element-analyses of orthopaedic implants in bone contact: Modeling and experimental validation. Computer Methods and Programs in Biomedicine. 2009;95:23–30. doi: 10.1016/j.cmpb.2009.01.004. [DOI] [PubMed] [Google Scholar]
- Khazen M, Warren RML, Boggis CRM, Bryant EC, Reed S, Warsi I, Pointon LJ, Kwan-Lim GE, Thompson D, Eeles R, Easton D, Evans DG, Leach MO. A pilot study of compositional analysis of the breast and estimation of breast mammographic density using three-dimensional T1-weighted magnetic resonance imaging. Cancer Epidemiol. Biomarkers Pre. 2008;17:2268–2274. doi: 10.1158/1055-9965.EPI-07-2547. [DOI] [PMC free article] [PubMed] [Google Scholar]
- Kopans DB. Basic physics and doubts about relationship between mammographyically determined tissue and breast cancer risk. Radiology. 2008;246:348–353. doi: 10.1148/radiol.2461070309. [DOI] [PubMed] [Google Scholar]
- Krouskop TA, Wheeler TM, Garra S, Hall T. Elastic moduli of breast and prostate tissues under compression. Ultrason. Imaging. 1998;20:260–274. doi: 10.1177/016173469802000403. [DOI] [PubMed] [Google Scholar]
- Kulkarni AD. Fuzzy Logic Fundamentals in Computer Vision and Fuzzy-Neural Systems. Prentice-Hall; Englewood Cliffs, NJ: 2001. pp. 61–101. [Google Scholar]
- Martin LJ, Boyd NF. Potential mechanisms of breast cancer risk associated with mammographic density: hypotheses based on epidemiological evidence. Breast Cancer Res. 2008;10:1–14. doi: 10.1186/bcr1831. [DOI] [PMC free article] [PubMed] [Google Scholar]
- Misra S, Macura KJ, Ramesh KT, Okamura AM. The importance of organ geometry and boundary constraints for planning of medical interventions. Med. Eng. Phy. 2009;31:195–206. doi: 10.1016/j.medengphy.2008.08.002. [DOI] [PMC free article] [PubMed] [Google Scholar]
- McCormack VA, Highnam R, Perry N, dos Santos Silva I. Comparison of a new and existing method of mammographic density measurement: intramethod reliability and associations with known risk factors. Cancer Epidemiol. Biomarkers Prev. 2007;16:1148–1154. doi: 10.1158/1055-9965.EPI-07-0085. [DOI] [PMC free article] [PubMed] [Google Scholar]
- Nie K, Chen JH, Chan S, Chau MKI, Yu HJ, Bahri S, Tzeng T, Nalcioglu O, Su MY. Development of a quantitative method for analysis of breast density based on three-dimensional breast. MRI Med. Phys. 2008;35:5253–5262. doi: 10.1118/1.3002306. [DOI] [PMC free article] [PubMed] [Google Scholar]
- Park H, Lee J. B-spline curve fitting based on adaptive curve refinement using dominant point. Computer-Aided Design. 2007;39:439–451. [Google Scholar]
- Rivlin RS. Large elastic deformations of isotropic materials .I. fundamental concepts. Phil. Trans. R. Soc. Lond. A. 1948;240:459–490. [Google Scholar]
- Rypl D, Bittnar Z. Triangulation of 3D surfaces reconstructed by interpolating subdivision. Computers and Structures. 2004;82:2093–2103. [Google Scholar]
- Samani A, Plewes D. A method to measure the hyperelastic parameters of ex vivo breast tissue samples. Phys. Med. Biol. 2004;49:4395–4405. doi: 10.1088/0031-9155/49/18/014. [DOI] [PubMed] [Google Scholar]
- Shi M, Zhang YF, Loh HT, Bradley C, Wong YS. Triangular mesh generation employing a boundary expansion technique. Int. J. Adv. Manuf. Technol. 2006;30:54–60. [Google Scholar]
- Shewchuk JR. Delaunay refinement algorithms for triangular mesh generation. Computational Geometry. 2002;22:21–74. [Google Scholar]
- Sokhanvar S, Dargahi J, Packirisamy M. Hyperelastic modelling and parametric study of soft tissue embedded lump for MIS applications. Int. J. Med. Robotics Computer Assisted Surgery. 2008;4:232–241. doi: 10.1002/rcs.202. [DOI] [PubMed] [Google Scholar]
- Stone J, Dite GS, Gunasekara A, English DR, McCredie MRE, Giles GG, Cawson JN, Hegele RA, Chiarelli AM, Yaffe MJ, Boyd NF, Hopper JL. The heritability of mammographically dense and nondense breast tissue Cancer. Epidemiol. Biomarkers Pre. 2006;15:612–617. doi: 10.1158/1055-9965.EPI-05-0127. [DOI] [PubMed] [Google Scholar]
- Tanner C, Schnabel JA, Hill DLG, Hawkes DJ, Leach MO, Hose DR. Factors influencing the accuracy of biomechanical breast models. Med. Phys. 2006;33:1758–1769. doi: 10.1118/1.2198315. [DOI] [PubMed] [Google Scholar]
- Tice JA, Cummings SR, Smith-Bindman R, Ichikawa L, Barlow WE, Kerlikowske K. Using clinical factors and mammographic breast density to estimate breast cancer risk: development and validation of a new predictive model. Ann. Intern. Med. 2008;148:337–347. doi: 10.7326/0003-4819-148-5-200803040-00004. [DOI] [PMC free article] [PubMed] [Google Scholar]
- Ursin G, Qureshi SA. Mammographic density-a useful biomarker for breast cancer in epidemiologic studies. Norsk. Epidemiologi. 2009;19:59–68. [Google Scholar]
- Vachon CM, van Gils CH, Sellers TA, Ghosh K, Pruthi S, Brandt KR, Pankratz VS. Mammographic density, breast cancer risk and risk prediction. Breast Cancer Res. 2008a;9:217–225. doi: 10.1186/bcr1829. [DOI] [PMC free article] [PubMed] [Google Scholar]
- Vachon CM, Pankratz VS, Scott CG, Maloney SD, Ghosh K, Brandt KR, Milanese T, Carston MJ, Sellers TA. Longitudinal trends in mammographic percent density and breast cancer risk. Cancer Epidemiol. Biomarkers Pre. 2008b;16:921–928. doi: 10.1158/1055-9965.EPI-06-1047. [DOI] [PubMed] [Google Scholar]
- Wang W, Pottmann H, Liu Y. Fitting B-spline curves to point clouds by curvature-based squared distance minimization. ACM Transactions Graphics. 2006;25:214–238. [Google Scholar]
- Wei J, Chan H, Helvie MA, Roubidoux MA, Sahiner B, Hadjiiski LM, Zhou C, Paquerault S, Chenevert T, Goodsitt MM. Correlation between mammographic density and volumetric fibroglandular tissue estimated on breast MR images. Med. Phys. 2004;31:933–942. doi: 10.1118/1.1668512. [DOI] [PubMed] [Google Scholar]
- Wolfe JN, Saftlas AF, Salane M. Mammographic parenchymal patterns and quantitative evaluation of mammographic densities: a case-control study. Am. J. Roentgenol. 1987;148:1087–1092. doi: 10.2214/ajr.148.6.1087. [DOI] [PubMed] [Google Scholar]
- Yin HM, Sun LZ, Wang G, Yamada T, Wang J, Vannier MW. ImageParser: a tool for finite element generation from three-dimensional medical images. BioMedical Eng. OnLine. 2004;3:1–9. doi: 10.1186/1475-925X-3-31. [DOI] [PMC free article] [PubMed] [Google Scholar]


