Abstract
Selenium, a trace element that is fundamental to human health, is incorporated into some proteins as selenocysteine (Sec), generating a family of selenoproteins. Sec incorporation is mediated by a multiprotein complex that includes Sec insertion sequence–binding protein 2 (SECISBP2; also known as SBP2). Here, we describe subjects with compound heterozygous defects in the SECISBP2 gene. These individuals have reduced synthesis of most of the 25 known human selenoproteins, resulting in a complex phenotype. Azoospermia, with failure of the latter stages of spermatogenesis, was associated with a lack of testis-enriched selenoproteins. An axial muscular dystrophy was also present, with features similar to myopathies caused by mutations in selenoprotein N (SEPN1). Cutaneous deficiencies of antioxidant selenoenzymes, increased cellular ROS, and susceptibility to ultraviolet radiation–induced oxidative damage may mediate the observed photosensitivity. Reduced levels of selenoproteins in peripheral blood cells were associated with impaired T lymphocyte proliferation, abnormal mononuclear cell cytokine secretion, and telomere shortening. Paradoxically, raised ROS in affected subjects was associated with enhanced systemic and cellular insulin sensitivity, similar to findings in mice lacking the antioxidant selenoenzyme glutathione peroxidase 1 (GPx1). Thus, mutation of SECISBP2 is associated with a multisystem disorder with defective biosynthesis of many selenoproteins, highlighting their role in diverse biological processes.
Introduction
Selenium is an essential trace element that is fundamental to human health. Its biological role is mediated principally by cotranslational incorporation of selenocysteine (Sec; the 21st amino acid) into selenium-containing proteins. Sec-containing proteins represent a diverse group, their functions ranging from metabolism of thyroid hormones (deiodinases), to removal of cellular ROS (glutathione peroxidase [GPx] types 1, 2, 3, 4, and 6 and thioredoxin reductase [TrxR] types 1, 2, and 3; ref. 1), to reduction of oxidized methionines in proteins (selenoprotein X; also referred to as MSRB1), to thioredoxin-dependent ribonucleotide reductase activity for DNA synthesis (2), to transport and delivery of selenium to peripheral tissues (selenoprotein P [SEPP]), to protein folding and ER stress (Sep-15, SELM, and SELS). Moreover, the precise function of some Sec-containing proteins remains unknown (SELO, SELV, SEPW, SELK, SELH, SELI, and SELT; refs. 3–5).
A molecular mechanism that is highly conserved from Archaebacteria to higher eukaryotes mediates the translational incorporation of Sec during selenoprotein synthesis. Interaction of a stem-loop RNA structure (Sec insertion sequence [SECIS] element), usually located in the 3′–untranslated region of selenoprotein mRNAs (6), with a multiprotein complex, which includes SECIS-binding protein 2 (SECISBP2; referred to herein as SBP2; ref. 7), leads to Sec incorporation mediated by a specific selenocysteyl-transfer RNA (tRNA[Ser]Sec) at UGA codons (4, 8). Failure of this mechanism can result in miscoding of the UGA as a stop codon and, depending on its location in the mRNA, the transcript may undergo nonsense-mediated decay (NMD). Variable affinity of SBP2 interaction with SECIS elements in different genes likely contributes to a hierarchy of differentially diminished selenoprotein synthesis when SBP2 levels are reduced (9). The architecture of SECISBP2 is highly complex, with alternative splicing of the gene to generate multiple transcripts with internal methionine residues capable of directing synthesis of shorter protein isoforms (10).
Here, we describe affected individuals from 2 families, identified on the basis of elevated circulating thyroxine (T4) levels, but low levels of selenium and selenoproteins (SEPP and GPx3). Their biochemical profile, suggestive of a broader deficiency of deiodinase enzymes as well as other selenoproteins, was analogous to the phenotype of childhood cases with defects in SECISBP2, reported previously (11, 12). Consistent with this, the probands were compound heterozygous for mutations in the SECISBP2 coding region together with missplicing of transcripts derived from the other allele. In our affected subjects, we observed clinical (azoospermia, axial muscular dystrophy, skin photosensitivity, abnormal immune cell function, and marked insulin sensitivity) and cellular (increased ROS production, membrane lipid peroxidation and oxidative DNA damage, and accelerated telomere shortening) features that could be directly attributed to loss of selenoprotein function. We have also documented cellular deficiencies of additional members of the selenoproteome (e.g., SELH, SELT, SELW, and SELI) whose function is unknown. Our observations define a multisystem disorder involving the defective biosynthesis of many selenoproteins.
Results
Case histories.
Proband 1 (P1), a male adult, presented at age 35 years with symptoms including fatigue, muscle weakness, and severe Raynaud disease (digital vasospasm). Investigations including thyroid function tests showed elevated free T4 (FT4, 41 pmol/l; normal range [NR], 9–20 pmol/l) levels, but normal levels of free triiodothyronine (FT3, 3.8 pmol/l; NR, 3–7.5 pmol/l) and thyroid-stimulating hormone (TSH, 0.49 mU/l; NR, 0.4–4 mU/l). In childhood, both motor and speech developmental milestones were delayed, requiring speech therapy. Despite treatment (myringotomies) for secretory otitis media at 6 years of age, hearing problems persisted. Walking and running remained problematic in adolescence, with genu valgus and external rotation of the hip requiring orthotic footwear. At the age of 13 years, symptoms of marked sun photosensitivity were noted with abnormal UV responses on phototesting, although no cause was established. Pubertal development was normal, but at the age of 15 years, he developed unilateral testicular torsion requiring orchidectomy and fixation of the remaining testis. His final stature (1.66 m) was close to the mean value (1.69 m) expected from parental heights (father, 1.77 m; mother, 1.61 m), but on the ninth centile. Ongoing problems in adulthood included primary infertility, skin photosensitivity, muscle weakness, impaired hearing, and rotatory vertigo.
Proband 2 (P2), a male child, presented at age 2 years with progressive failure to thrive in infancy, which led to a diagnosis of eosinophilic colitis for which he has since been treated with azathioprine and sodium cromoglycate. When fasting (e.g., overnight), he would develop nonketotic hypoglycemia with low insulin levels and required supplemental enteral nutrition to prevent this. At age 3.6 years, mild, global developmental delay and short stature prompted investigation that showed elevated FT4 (44 pmol/l; NR, 12–22 pmol/l), low FT3 (1.9 pmol/l; NR, 5.2–10.2 pmol/l), and normal TSH (2.9 mU/l; NR, <6 mU/l) levels. Additional features in this index case included muscle weakness and mild bilateral high-frequency hearing loss. Normalization of FT3 levels following commencement of liothyronine treatment has been associated with improvement in linear growth, speech, and neurodevelopment.
Compound heterozygous SECISBP2 defects.
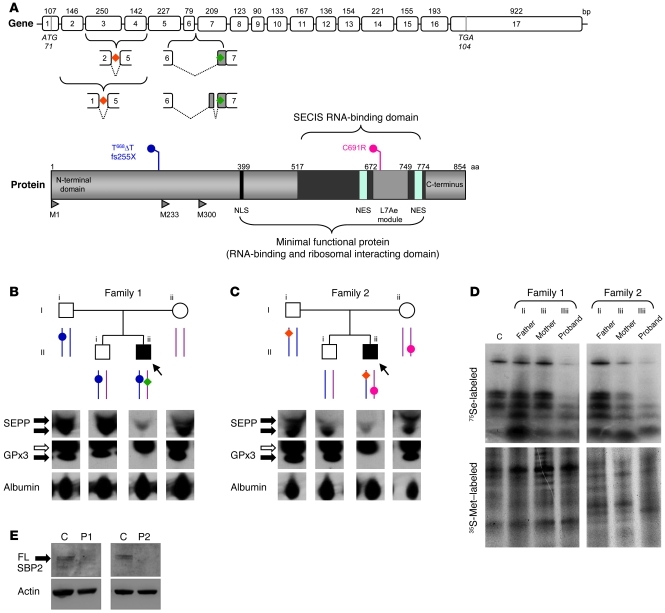
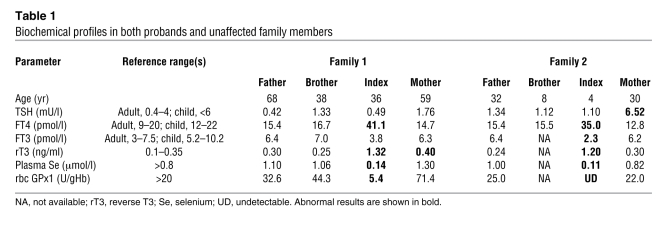
We identified 2 subjects harboring SECISBP2 mutations (Figure 1, A–C), with case histories and biochemical features similar to 3 previously described cases (11, 12). Both P1 and P2 showed markedly raised T4 with normal or reduced T3 levels, signifying impaired conversion of T4 to T3 mediated by Sec-containing deiodinase enzymes (Table 1). Circulating selenium levels were very low, reflecting markedly reduced expression of plasma GPx3 and SEPP (Figure 1, B and C), the major circulating proteins contributing to levels of this element. Furthermore, rbc GPx1 levels were also low or undetectable (Table 1). This combination of biochemical abnormalities suggested a global defect in selenoprotein synthesis.
Figure 1. Genotypes and biochemical phenotypes in 2 families with defects in SECISBP2.
(A) Schematic representations of the coding exons of SECISBP2 (top) showing the location of aberrantly spliced variant transcripts (P1, green; P2, orange), and the major domains of SBP2 (bottom) showing the frameshift premature stop (P1, blue, fs255X) and missense (P2, red, C691R) mutations. NLS, nuclear localization signal; NES, nuclear export signal; L7Ae module, domain homolog to RNA-binding domain of L7Ae; M1, M233, M300, position of alternate methionine transcription initiation sites, with M1 yielding full-length wild-type SBP2 protein. (B and C) Pedigrees of families 1 (B) and 2 (C) showing genotypes (as described in A); squares and circles represent male and female family members, respectively, and arrows/filled symbols denote probands. Below, Western blotting for SEPP and GPx3 in plasma of both probands and family members. Black arrows indicate specific bands; white arrows denote nonspecific bands. Albumin was used as a loading control. (D) PBMCs from P1 and P2 demonstrate defective selenoprotein synthesis. Selenoprotein biosynthesis in PBMCs was assessed using 75Se labeling as described in Methods. 35S-Met labeling confirmed comparable protein loading. C, control subject (age- and sex-matched to P1). (E) Fibroblasts from P1 and P2 lack full-length SBP2. Whole cell lysates from primary skin fibroblasts were Western blotted for full-length (FL) SBP2 (arrow) with actin as a loading control. Age- and sex-matched control subjects were used.
Table 1 .
Biochemical profiles in both probands and unaffected family members
We therefore sequenced SECISBP2 at both genomic and cDNA levels, identifying compound heterozygous abnormalities in both probands: P1 was heterozygous for a paternally inherited frameshift/premature stop mutation in exon 5 ([T668ΔT]fs.223[stop255]; referred to herein as fs255X) on 1 allele, together with a splicing defect causing misincorporation of additional intronic sequence between exons 6 and 7 on the other allele (Figure 1, A and B, and Supplemental Figure 1, A and B; supplemental material available online with this article; doi: 10.1172/JCI43653DS1). Such missplicing may be linked to a single nucleotide change at –155 bp in this intron, which occurred de novo in P1 (Supplemental Figure 1B). P2 was heterozygous for the maternally inherited missense mutation C691R, changing a highly conserved cysteine residue in the RNA binding domain of SBP2, together with a paternally derived defect generating aberrantly spliced SBP2 transcripts (lacking either exons 2–4 or exons 3 and 4; referred to herein as Δ2-3-4 and Δ3-4, respectively; Figure 1, A and C, and Supplemental Figure 1, D and E). The aberrantly spliced SBP2 transcripts were not found in RNA derived from 100 normal alleles; likewise, the single nucleotide changes in SECISBP2 were absent in 200 normal alleles sequenced (data not shown). No mutations, but several SNPs in introns between exons 1 and 5 (Supplemental Figure 1E), were identified in P2, but whether the latter account for his SBP2 missplicing is not known. The heterozygous father and brother of P1 and father of P2 lacked a discernible biochemical phenotype, with normal biosynthesis of 75Se-labeled selenoproteins in PBMCs, but the mother of P2 (C691R mutation) did show slightly reduced radiolabeled selenoprotein levels in PBMCs with borderline-low circulating selenium levels (Figure 1D and Table 1).
Each of the SECISBP2 mutations in P1 is predicted to terminate the transcript prematurely (Supplemental Figure 1, A and B). Consistent with this, Western blotting of his fibroblasts showed lack of full-length SBP2 protein expression (Figure 1E). Surprisingly, expression of full-length SBP2 protein in fibroblasts from P2 was also absent. We anticipated that the paternally derived, shorter SBP2 transcripts (Δ2-3-4 and Δ3-4) in P2 would not yield a full-length protein product; unexpectedly, however, we found that the stability of the maternally inherited mutant (C691R) SBP2 protein was reduced as a result of enhanced proteasomal degradation (Supplemental Figure 1F). Modeling of the SBP2 RNA binding region with a similar functional domain from the L7Ae sRNA protein may provide an explanation for this. C691, which is highly conserved in different species, is located within a hydrophobic core, and its replacement with a charged arginine residue is likely to disrupt protein folding and perhaps stability (Supplemental Figure 1G). Thus, this combination of defects in P2 is also likely to preclude significant synthesis of intact SBP2.
Despite their lack of full-length SBP2 protein expression, 75Se labeling studies of PBMCs from both P1 and P2 indicated markedly reduced, but not completely abolished, selenoprotein synthesis (Figure 1D). This suggests that some functional SBP2 is generated in both P1 and P2 in vivo, as has been recently documented in a case with a homozygous null SECISBP2 mutation (12). Consistent with this hypothesis, cells transfected with a minigene construct containing the fs255X SECISBP2 mutation found in P1 did express shorter SBP2 isoforms, likely initiating from alternative ATGs (M233 and M300) downstream of the stop codon (Supplemental Figure 1C). Likewise, although the SECISBP2 splicing defects (Δ2-3-4 and Δ3-4) found in P2 are also predicted to terminate translation prematurely, protein synthesis can be reinitiated from these downstream methionine residues (Supplemental Figure 1E). Such truncated SBP2 isoforms in P1 and P2 would retain the carboxyterminal region of the protein, containing key domains mediating ribosome interaction, RNA binding, and Sec incorporation functions (Figure 1A). Indeed, previous studies have shown that an SBP2 truncation mutant containing these domains is capable of mediating Sec incorporation (13).
Azoospermia with spermatogenic maturation arrest.
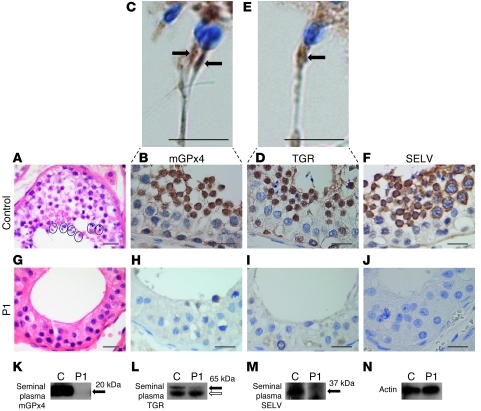
Following slow growth in early childhood, later pubertal development in P1 was normal, despite unilateral orchidectomy at age 15 years following an episode of testicular torsion. Primary infertility in adulthood prompted further investigation, with 2 separate analyses of semen from P1 showing complete azoospermia despite the presence of a sonographically normal, remaining testis (data not shown). Normal circulating testosterone (24 nmol/l; NR, 8–32 nmol/l), but significantly reduced Inhibin B (36 pg/ml; NR, 160–215 pg/ml), levels in P1 suggested preservation of Leydig cell but impaired Sertoli/germ cell function. Histological examination of the testis removed previously in adolescence showed maturation arrest in spermatogenesis, with preservation of spermatogonia and spermatocytes in the germ cell lining of the seminiferous tubules, but an absence of the mature stage spermatids and spermatozoa (Figure 2G). Western blot analysis of azoospermic seminal fluid from P1 showed markedly reduced levels of the known testis-enriched selenoproteins mitochondrial GPx4 (mGPx4), thioredoxin-glutathione reductase (TGR; also referred to as TXNRD3), and selenoprotein V (SELV) compared with normal, seminal plasma (Figure 2, K–M). Immunohistochemistry (IHC) of normal testis confirmed that mGPx4, TGR, and SELV expression was largely confined to later stages of spermatogenesis, with mGPx4 and TGR being particularly localized to the midpiece of normal spermatozoa (Figure 2, C and E, arrows); in contrast, these proteins were virtually absent in the testis of P1 (Figure 2, H–J).
Figure 2. Spermatogenic maturation arrest associated with deficiencies of testis-expressed selenoproteins.
H&E images (original magnification, ×40) of a seminiferous tubule from a normal subject (A) and P1 (G). Circled areas (A) from normal testis show mature spermatozoa. Spermatids and spermatozoa were absent, but with preservation of spermatogonia and spermatocytes, in P1 (G). IHC showed virtual absence of mGPx4, TGR, and SELV immunoreactivity in testis from P1 (H–J) compared with their expression in later stages of spermatogenesis in a normal subject (B, D, and F). Expanded images (C and E; original magnification, ×60) also highlighted mGPx4 and TGR expression in the midpiece of normal spermatozoa (arrows). Scale bars: 20 μm (A, B, D, and F–J); 5 μm (C and E). Western blotting of seminal plasma from a normal control subject and P1 using antibodies for mGPx4 (K), TGR (L), and SELV (M), with actin (N) as a loading control. Black arrows indicate specific bands; white arrow denotes nonspecific band.
Axial muscular dystrophy similar to SEPN1-related myopathies.
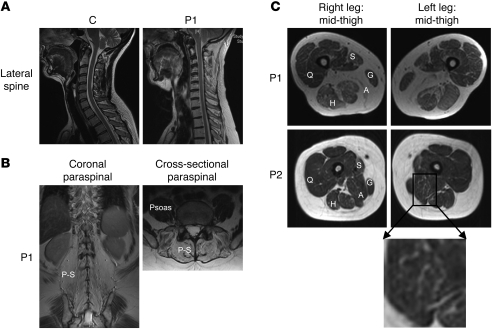
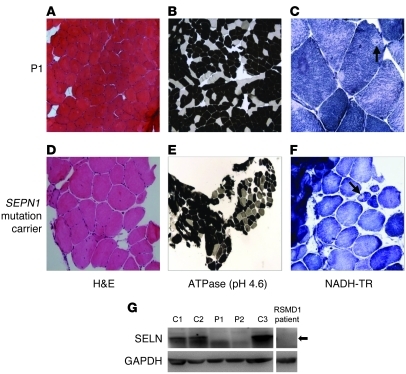
A history of reduced exercise tolerance and difficulties with daily activities of life (e.g., lifting and climbing stairs) in P1 prompted further investigation, which confirmed reduced aerobic exercise capacity (50% of predicted), reduced lung vital capacity (3.3 l; NR, 3.5–5.4 l), and diminished muscle strength affecting predominantly axial and neck muscle groups together with elevated serum creatine kinase (CK) levels (896 U/l; NR, 24–195 U/l), which isoenzyme electrophoresis showed to be skeletal muscle–derived (CK-MM). Imaging showed marked loss of normal spinal curvature (Figure 3A) with connective tissue and fatty infiltration of paraspinal muscles and adductor and sartorius muscle groups (Figure 3, B and C) closely resembling the selective pattern of muscle involvement previously reported in rigid spine muscular dystrophy (RSMD1), a disorder associated with defects in the selenoprotein N (SEPN1) gene (14, 15). Biopsy of his quadriceps muscle showed marked predominance of type 1 oxidative fibers (P1, 85%; normal, 35%), with occasional areas of sarcomere disorganization termed minicores — features that resembled muscle histology from a patient with RSMD1 with a SEPN1 mutation (Figure 4, A–F). P2 also showed clinical features (delayed milestones, hypotonia, mild proximal and axial weakness, early lumbar spinal rigidity, mild facial weakness, and nasal voice) and abnormal muscle imaging (fatty infiltration of adductors and Sartorius; Figure 3C) suggestive of an early myopathy, with remarkable similarity to the pattern of selective involvement documented in RSMD1 (14). Consistent with the similarity of their muscle phenotypes to SEPN1-related myopathies, Western blotting of dermal fibroblasts from P1 and P2 showed markedly reduced protein levels of selenoprotein N (SELN), comparable to cells from an unrelated RSMD1 case harboring a SEPN1 mutation (Figure 4G).
Figure 3. Radiological features similar to SEPN1-related myopathies.
(A) Sagittal T2-weighted MRI of the cervical and upper thoracic spine in a control subject and P1, showing loss of normal spinal curvature similar to that seen in RSMD1. (B) Coronal and cross-sectional T1-weighted MRI of the paraspinal region of P1 showing connective tissue/fatty infiltration of paraspinal (P-S) with sparing of psoas muscles. (C) Cross-sectional T1-weighted MRI at the mid-thigh level in P1 revealed connective tissue/fatty infiltration in the adductor and sartorius muscles, but with relative sparing of other muscle groups. Similar but less marked changes were already evident in P2. S, sartorius; G, gracilis; A, adductors; H, hamstrings; Q, quadriceps.
Figure 4. Histological features similar to SEPN1-related myopathies are associated with reduced selenoprotein N expression.
Muscle biopsy confirmed histological appearances similar to those found in a patient harboring a known SEPN1 mutation. Sections of quadriceps from P1 were stained with (A) H&E, showing 39% myofibers with internally located nuclei; (B) ATPase (pH 4.6), showing predominance of dark staining Type 1 fibers (~80%) and absence of type 2B fibers; and (C) NADH-TR, revealing occasional minicores (arrow) and a rare atrophic fiber. Comparable sections from a SEPN1 mutation carrier are shown (D–F). Original magnification, ×10 (A and D); ×5 (B and E); ×20 (C and F). (G) Reduced SELN expression in fibroblasts from P1 and P2, comparable to cells from a known RSMD1 subject. Whole cell lysates of primary skin fibroblasts from P1 and P2, control subjects (C1–C3), and a RSMD1 patient with a known SEPN1 mutation were Western blotted for SELN expression, with GAPDH as a loading control. Arrow denotes the specific SELN band.
Cutaneous photosensitivity and enhanced UV-mediated oxidative damage.
At age 13 years, following a history of skin reddening and blistering upon sun exposure, abnormal cutaneous photosensitivity was first documented in P1. Such symptoms persist into adulthood, necessitating constant use of high-strength sunblock. Repeat testing confirmed that P1 remained abnormally photosensitive, with exposure to UVA irradiation (350 nm), even at a low dose (e.g., 10 J/cm2), eliciting an abnormally rapid erythematous skin response within 90 minutes (Figure 5A), whereas normal subjects usually respond only at higher doses and after 24 hours.
Figure 5. Cutaneous photosensitivity and selenoenzyme deficiency.
(A) Reddening of skin in P1 90 minutes after exposure to graded doses (10–40 J/cm2) of UVA radiation (350 nm). The highest dose (57 J/cm2) was not tested because of the markedly abnormal responses seen with lower exposure levels. (B) Images (original magnification, ×20) showing markedly reduced GPx1 immunoreactivity (especially basal cell layer) in epidermis from P1 compared with a control subject. Scale bars: 50 μm. (C) Reduced TrxR activity in skin from P1. TrxR activity was determined in skin biopsy tissue from P1 and a sex- and age-matched control subject. (D) Reduced MSRB expression in dermal fibroblasts from P1 and P2. Whole cell lysates of fibroblasts from P1 and P2 and 2 age- and sex-matched controls were Western blotted for MSRB (arrow), with actin as a loading control.
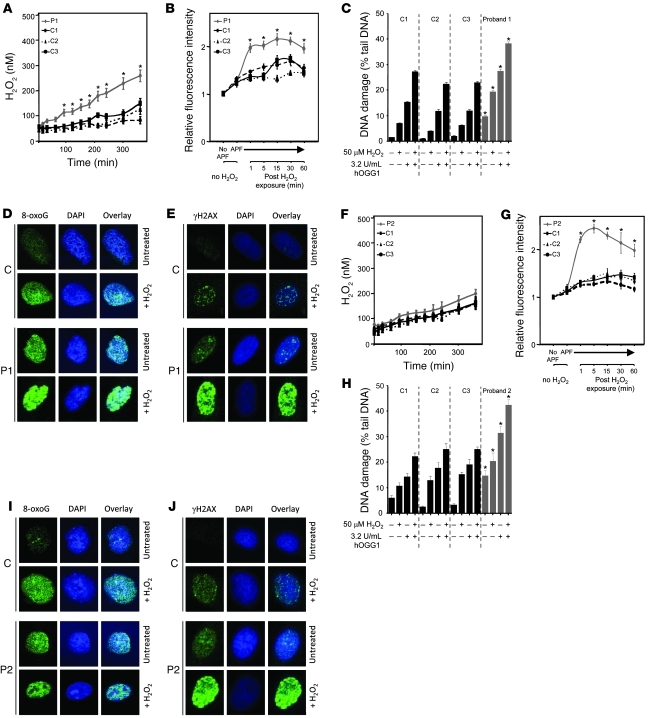
IHC showed markedly reduced expression of GPx1, particularly in the basal cell layer of the epidermis, in P1 (Figure 5B). TrxR enzyme activity in his skin biopsy was much lower than in control tissue (Figure 5C); expression of methionine-sulfoxide reductase B (MSRB), which catalyzes the reduction of ROS-induced methionine sulfoxides in proteins back to L-methionine (16), in his dermal fibroblasts was significantly reduced (Figure 5D). Consistent with deficiency of such antioxidant selenoenzymes, dermal fibroblasts from P1 showed more endogenous H2O2 production than control cells and greater accumulation of other ROS species following exogenous H2O2 exposure (Figure 6, A and B), confirming decreased cellular antioxidant capacity.
Figure 6. Impaired antioxidant defence in dermal fibroblasts.
Endogenous H2O2 production by fibroblasts from P1 (A) and P2 (F) and age- and sex-matched controls was assayed using a specific indicator, as described in Methods. ROS levels in fibroblasts from P1 (B) and P2 (G) and age- and sex-matched controls were determined by loading cells with APF at intervals (1–60 minutes) following H2O2 exposure (0.5 mM, 30 minutes), with measurement of fluorescence by FACS analysis. (Fluorescence in the absence of APF was set arbitrarily at 1.) DNA damage, determined using an alkaline comet assay, was assessed in fibroblasts from P1 (C) and P2 (H) and age- and sex-matched controls in the absence and presence of exogenous H2O2 (50 μM), with or without addition of hOGG1, which targets oxidatively modified DNA (8-oxoGua) for excision (see Methods). Fluorescence microscopy images (original magnification, ×63) showing 8-oxoGua levels in fibroblasts from P1 (D) and P2 (I) and matched controls either untreated or exposed to H2O2 (50 μM), with DAPI staining and overlay confirming its nuclear localization, and γH2AX foci in fibroblasts from P1 (E) and P2 (J) and matched controls, either untreated or exposed to H2O2 (100 μM), with DAPI staining and overlay.
DNA damage is a known consequence of increased cellular ROS and includes single-strand breaks (SSBs) as well as modification of DNA nucleobases to form 8-oxo-7,8-dihydroguanine (8-oxoGua). The cellular response to DNA damage includes nuclear accumulation of phosphorylated histone H2AX (γH2AX; ref. 17). Alkaline comet assay quantified much greater DNA damage in dermal fibroblasts from P1: SSBs and 8-oxoGua, which was significantly enhanced following exposure of his cells to H2O2 (Figure 6C). Direct immunofluorescence of untreated fibroblasts from P1 showed elevated 8-oxoGua, comparable to H2O2-treated control cells, with further enhancement following H2O2 exposure (Figure 6D), and similar observations were made with nuclear γH2AX foci in his cells (Figure 6E). Measurements over a longer time frame in comet assays indicated that elevated DNA damage was not caused by failure of DNA repair pathways (Supplemental Figure 2B).
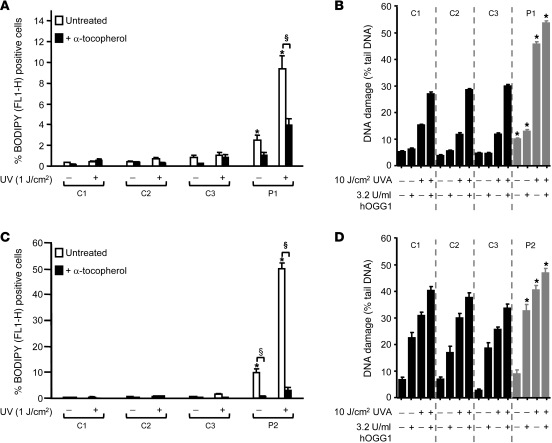
Lipid peroxidation is another well-recognized consequence of oxidative stress. Using the redox-sensitive dye BODIPY 581/591 C11, we quantified increased membrane lipid peroxidation in untreated fibroblasts from P1, which was ameliorated by pretreatment with α-tocopherol, a known membrane antioxidant (Figure 7A). Significantly, exposure of his dermal fibroblasts to UV irradiation markedly increased levels of both lipid peroxidation (Figure 7A) and DNA damage as assessed by comet assay (Figure 7B) compared with control cells.
Figure 7. Increased UV sensitivity in dermal fibroblasts.
Untreated or α-tocopherol–treated dermal fibroblasts from P1 (A) or P2 (C) together with age- and sex-matched controls were exposed to UV irradiation and then loaded with redox-sensitive dye BODIPY 581/591 C11, with quantitation of percent cells positive for oxidized dye (FL1-H). DNA damage, assayed with the hOGG1-modified alkaline comet assay, in either untreated or UV-exposed dermal fibroblasts from P1 (B) and P2 (D) or control cells.
At the conclusion of the present study, P2 did not exhibit cutaneous photosensitivity on formal testing (data not shown). His fibroblasts did not generate excess endogenous H2O2 (Figure 6F), although their exposure to oxidative stress was associated with increased ROS (Figure 6G), DNA damage (Figure 6, H and I), and γH2AX response (Figure 6J), with normal DNA repair (Supplemental Figure 2C). Although UV irradiation did enhance lipid peroxidation in his fibroblasts (Figure 7C), the amount of UV-induced DNA damage was not markedly greater than that in control cells (Figure 7D).
Impaired T cell proliferation and abnormal cytokine production.
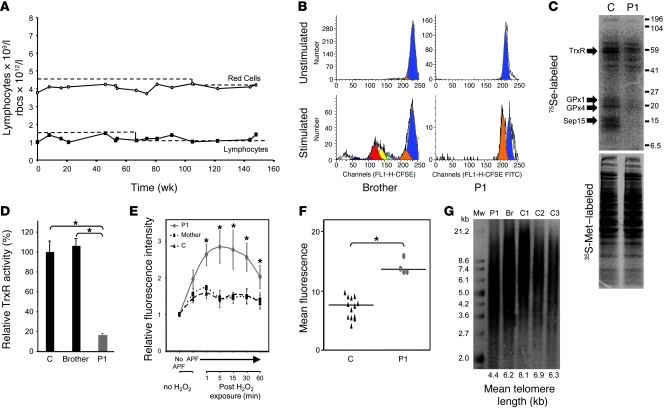
Extended monitoring (over 36 months) of hematologic parameters in P1 has documented a persistent, mild reduction in rbc and total lymphocyte counts (Figure 8A), with normal levels of other cell types (e.g., platelets, neutrophils, and monocytes). Immunophenotyping indicated no deficiency of particular lymphocyte subsets (CD4, CD4+CD25hi, CD4+CD45RO, CD8, CD19, CD19+CD27+, CD56) and normal Ig (IgG, IgM, IgA, IgE) levels (data not shown). However, the ability of his T cells to proliferate following polyclonal stimulation (CD3/CD28) was significantly reduced (Figure 8B), with such impairment not being related to lower IL-2 levels (data not shown). 75Se radiolabeling showed marked deficiency of known major T cell selenoproteins (TrxR, GPx1, and GPx4; ref. 18) mediating antioxidant defense (Figure 8C). Low GPx1 levels in rbcs (Table 1) and TrxR activity in PBMCs (Figure 8D), together with greater ROS accumulation in these cells (Figure 8, E and F), suggested more widespread loss of antioxidant defence in blood cells. Oxidative DNA damage secondary to reduced antioxidant capacity is known to include single-stranded, telomeric DNA, leading to accelerated telomere shortening in cells (19, 20). We therefore measured telomere restriction fragment (TRF) length in P1, finding a significant reduction in his PBMCs compared with controls of similar age (P1, 4.4 kb; controls, 6.2–8.1 kb; Figure 8G). We also documented shortening of TRF length in cells from P2 (Supplemental Figure 2D).
Figure 8. Impaired T cell proliferation, with reduced antioxidant defense and telomere shortening, in PBMCs.
(A) Persistently reduced peripheral rbc and lymphocyte counts from P1 over a 36-month period. (B) Impaired T cell proliferation in P1. Following stimulation of PBMCs from P1 and his brother, FACS analysis shows dilution of the intracellular dye (CFSE) in CD3+ T cells. (C) Selenoprotein levels in 75Se-labeled T cells, with 35S-Met labeling of cells confirming comparable protein loading, in P1 and an age- and sex-matched control subject. Arrows denote positions of bands corresponding to specific selenoproteins (TrxR, GPx1, GPx4, and Sep15). (D) TrxR activity in PBMCs from P1 compared with his brother and an age- and sex-matched control subject. (E) ROS production in PBMCs from P1, his mother, and an age- and sex-matched control, determined as described for dermal fibroblasts in Figure 6B. (F) ROS levels in RBCs from P1 (each symbol is an independent determination on a different occasion) or control subjects (each symbol is a measurement from a different individual). (G) Telomeric shortening in PBMCs of P1. Average telomere length (kb) in DNA from PBMCs of P1, his brother (Br), and 3 age- and sex-matched control subjects, determined by Southern blotting using a telomere-specific probe. Mw, molecular weight size marker.
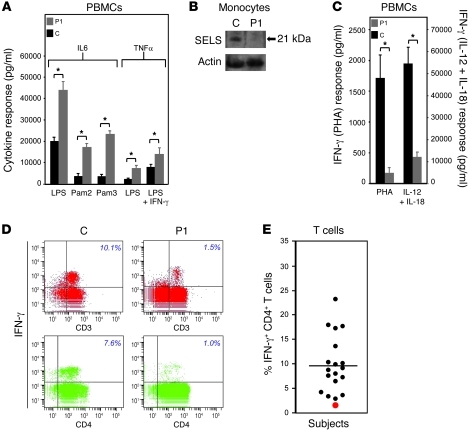
LPS or TLR ligand (Pam2 or Pam3) stimulation of PBMCs from P1 ex vivo resulted in markedly enhanced secretion of IL-6 and TNF-α (Figure 9A); levels of selenoprotein S in his monocytes were virtually negligible (Figure 9B). His PBMCs also showed significantly reduced IFN-γ production in response to stimulation with phytohemagglutinin (PHA) or with IL-12 and IL-18 (Figure 9C). FACS analysis of cells exposed to phorbol-12-myristate 13-acetate (PMA) and ionomycin localized intracellular IFN-γ deficiency to CD3+ and CD4+ T cells (Figure 9, D and E) and also CD8+ and CD3– cell populations (data not shown).
Figure 9. Abnormal cytokine production from PBMCs.
(A) IL-6 secretion in response to LPS, Pam2, and Pam3 exposure (24 h), and TNF-α secretion in response to LPS and LPS plus IFN-γ exposure (12 h), were assayed in supernatants of PBMCs from P1 and an age-matched control subject. (B) Whole cell lysates from CD14+ monocytes were Western blotted for SELS (arrow), with actin as a loading control. The control subject was age- and sex-matched. (C) PBMCs of P1 and an age-matched control subject were stimulated either by PHA or by IL-12 and IL-18, and IFN-γ responses were assayed at 48 h. (D and E) Intracellular IFN-γ levels in CD3+ and CD4+ cell populations derived from PBMCs exposed to PMA and ionomycin were determined by FACS analysis (see Methods) in P1 and a group of age- and sex-matched control subjects. Each symbol denotes 1 individual; red symbol denotes P1.
Long-term azathioprine treatment for eosinophilic colitis precluded assays of immune cell function in P2.
Increased fat mass but enhanced insulin sensitivity.
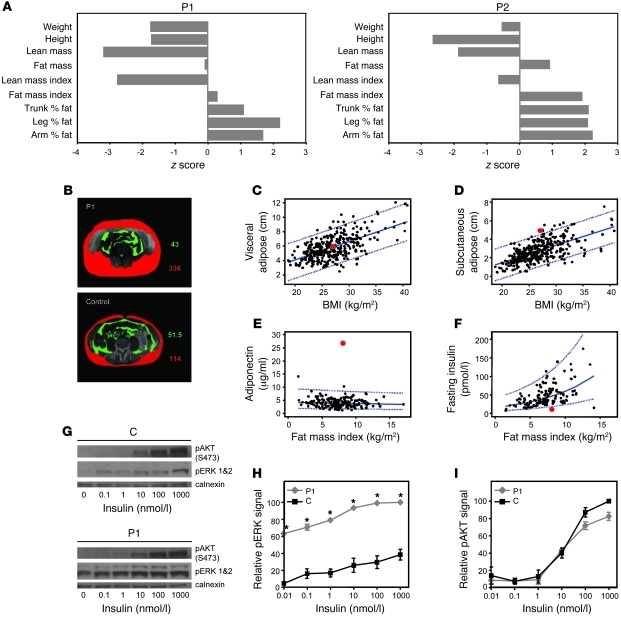
Growth retardation was noted in adolescence and early childhood in P1 and P2, respectively. Accordingly, measurements of body composition were adjusted for height. Lean mass index was reduced in both cases, possibly reflecting underlying myopathy; in contrast, their fat mass index was elevated (Figure 10A). Quantification of regional (abdominal) body fat in P1 showed that the excess adipose tissue was predominantly subcutaneous with normal visceral fat compared with age- and sex-matched normal subjects (Figure 10, B–D). Paradoxically, such heightened fat mass was associated with extremely favorable metabolic parameters, with low fasting insulin and strikingly elevated adiponectin levels (Figure 10, E and F), a favorable lipid profile (triglyceride, 0.5 mmol/l; NR, <1.7 mmol/l; HDL, 1.36 mmol/l; NR, >1.03 mmol/l), and almost negligible liver fat (hepatic lipid, 0.7%; NR, 0%–5%) as measured by magnetic resonance spectroscopy (MRS), indicating marked systemic insulin sensitivity. We therefore examined insulin-mediated signaling in his fibroblast cells ex vivo. Both basal and insulin-dependent phosphorylation of ERK1/2 were markedly increased in his cells (Figure 10, G–I).
Figure 10. Increased fat mass but enhanced insulin sensitivity.
(A) Anthropometric measures and body composition data in P1 and P2 are shown as z scores, relative to an age- and sex-matched normal reference population. (B) Quantitation of visceral (green) and subcutaneous (red) abdominal fat from cross-sectional magnetic resonance imaging scans in P1 and an age- and sex-matched control subject. (C–F) Abdominal visceral (C) and subcutaneous (D) fat in P1 (red symbol) and age- and sex-matched normal subjects (black symbols; n = 320) measured by ultrasound scan; circulating, fasting adiponectin (E) and insulin (F) levels in P1 (red symbol) and age- and sex-matched normal subjects (black symbols; n = 180). Normal individuals were subjects recruited to a local (MRC, Fenland) population-based cohort study. (G–I) Primary fibroblasts from P1 and an age- and sex-matched control subject were exposed to varying insulin concentrations. (G) Representative Western blot showing pAKT and pERK1/2 levels with calnexin as loading control. (H and I) Quantification of pERK1/2 and pAKT levels.
P2 exhibited a similar phenotype, with an elevated fat mass index (6.1 kg/m2; age- and sex-matched NR, 3.9–4.1 kg/m2; ref. 21), high circulating adiponectin (23.5 μg/ml; >97.5 centile of an 8-year-old normal population; ref. 22) and recurrent, fasting hypoglycemia with very low insulin levels.
Hearing loss.
Audiometry revealed bilateral mid- to high-frequency sensorineural hearing loss in P1 (Supplemental Figure 3A). Otoacoustic emissions showed absent responses at all frequencies, whereas brainstem auditory evoked responses were normal (data not shown), indicating a defect at the cochlear level. MRI imaging showed normal cochlear architecture. Rotatory vertigo in this subject correlated with bilaterally diminished vestibular outputs on caloric testing (data not shown). P2 also exhibited sensorineural hearing loss at higher frequencies, but the deficit was less marked (Supplemental Figure 3B).
Selenoproteome profiling.
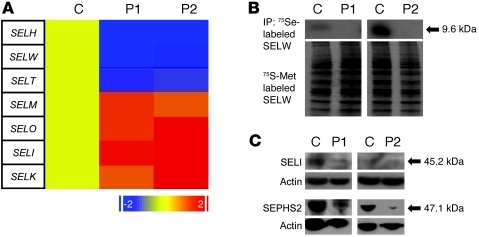
Cellular siRNA-mediated SBP2 knockdown is known to reduce transcripts of selenoprotein genes via NMD (23), prompting us to quantify selenoprotein gene expression in fibroblasts from our cases. Expression of 3 mRNAs (SELH, SELW, and SELT) predicted to be susceptible to NMD was significantly reduced (Figure 11A), which suggests that synthesis of the corresponding selenoproteins is diminished, and immunoprecipitation of SELW from radiolabeled cells confirmed this (Figure 11B). Conversely, levels of other transcripts, predicted to be either susceptible (SELM) or refractory (SELO, SELI, and SELK) to NMD were preserved or even upregulated (Figure 11A). However, measurement of protein derived from 1 transcript in this latter category (SELI, for which a reliable antibody was available) showed reduced levels in P1 (Figure 11C), which suggests that even these gene transcripts may not yield normal levels of protein product. Finally, expression of selenophosphate-synthetase 2 (SEPHS2), a Sec-containing protein that generates substrate for incorporation into tRNA[Ser]Sec (24), was reduced particularly in P2 (Figure 11C).
Figure 11. Altered expression of selenoproteome members in P1 and P2.
(A) Relative mRNA levels of 7 different selenoproteins, whose physiological roles remain to be defined, in fibroblasts from a control subject, P1, and P2, measured by qPCR. Red indicates higher, and blue lower, levels of gene expression relative to the control (uniformly designated yellow). (B) Autoradiographs of 75Se-labeled fibroblast cell lysates from P1 and P2 and age- and sex-matched controls, immunoprecipitated with anti-SELW antibody; 35S-Met–labeled cells are shown as a loading control. (C) Western blotting showing variably reduced expression of SELI and SEPHS2 in fibroblasts from P1 and P2 compared with age- and sex-matched controls, with actin loading control.
Discussion
We have described subjects, identified on the basis of a distinctive biochemical profile (elevated T4 and low selenoprotein levels), with compound heterozygous SECISBP2 defects that result in diminished synthesis of most known selenoproteins. The resulting phenotype is complex, but probably reflects 2 major pathogenic processes: first, tissue-specific effects caused by particular selenoprotein deficiencies in target organs; second, consequences of more generalized antioxidant selenoenzyme deficiencies with excess cellular ROS.
The testis is highly selenium enriched, with deficiency of this trace element in rodents being associated with infertility (25). We have documented azoospermia with deficiency of 3 testis-enriched selenoproteins, mGPx4, TGR, and SELV, in our adult proband (Figure 2). mGPx4, forming cross-links with other proteins, is a major structural component of the mitochondrial capsule in the midpiece of spermatozoa (26). Murine mGPx4 inactivation causes male infertility (27), and reduced human seminal mGPx4 activity correlates with oligospermia (28). TGR, also highly enriched in spermatids, may catalyze protein disulfide bond isomerization in sperm development (29). Human SELV expression is known to be testis restricted, but its function is unknown (3). Consistent with the known importance of mGPx4 and TGR in latter spermatogenic stages, testicular histology in P1 showed maturation arrest, with preservation of early cell types (e.g., spermatogonia and spermatocytes) but lack of mature spermatids and spermatozoa (Figure 2G). SEPP, acting as a source of selenium to meet tissue demand, has also been implicated in spermatogenesis, with SEPP-null mice showing abnormal sperm morphology and diminished testicular selenium content (30, 31). Thus, markedly reduced circulating SEPP levels in P1 (Figure 1B) may be an added factor contributing to his azoospermia. Although P2 was prepubertal, his serum SEPP (Figure 1C) and PBMC mGPx4 protein levels (Supplemental Figure 2A) were also low, suggesting that future spermatogenesis may also be compromised.
SELN is expressed in skeletal muscle, and mutations in either the coding region or 3′–untranslated region SECIS element of this gene are associated with a spectrum of myopathic disorders of varying clinical severity and age of onset, including RSMD1, desmin-related myopathy with Mallory body–like inclusions (MB-DRM), and congenital fiber type disproportion (CFTD) (32–34). The musculoskeletal phenotype of our subjects showed a marked resemblance to SEPN1 myopathies: the pattern of muscle weakness (axial) and involvement (adductors, sartorius) was very similar to RSMD1 (Figure 3, B and C); muscle histology (type 1 fiber predominance and occasional minicores; Figure 4, B and C) and reduced fibroblast SELN protein levels (Figure 4G) were comparable to SEPN1 myopathy cases. A congenital myopathy resembling that seen in SEPN1 mutation cases was also noted in a childhood case described very recently (35). Collectively, these results suggest that a skeletal myopathy, likely mediated by SELN deficiency, is a feature of this disorder.
Exposure of normal human skin to ultraviolet radiation (UVR) is known to generate free radicals and high millimolar levels of H2O2 (36). Furthermore, UVR exposure upregulates GPx (37) and TrxR (38) activity and MSRB levels (39), protecting cells from oxidatively derived damage. We have documented cutaneous deficiency of GPx1, TrxR, and MSRB (Figure 5, B–D), together with increased cellular ROS (Figure 6A), membrane lipid peroxidation (Figure 7A), and oxidative DNA damage (Figure 6, C–E) in dermal fibroblasts from P1. These findings, together with excess lipid peroxidation and DNA damage (8-oxoGua and γH2AX foci) seen in SBP2-depleted cell lines (40) and enhanced lipid peroxidation in murine GPx4 deficiency (41, 42), substantiate a link between selenoprotein deficiency and reduced cellular antioxidant defence. Furthermore, our observation of markedly enhanced oxidative damage following UV exposure in skin fibroblasts from P1 (Figure 7, A and B) provides a potential pathogenic basis for his photosensitivity. P2 was not abnormally photosensitive by the completion of the present study, but his cells were less susceptible to UV-mediated DNA damage (Figure 7D) and generated less H2O2 (Figure 6F). It is well recognized that cellular accumulation of ROS can itself damage enzymes (e.g., catalase) that mediate its removal (43) or pathways (e.g., MSRB) that repair oxidized proteins (44). As P2 is still very young (age 5 years at completion of the present study), it is conceivable that such cumulative ROS-mediated damage to antioxidant defence pathways could expose future photosensitivity.
The defective T cell proliferation we observed in P1 (Figure 8B) mirrors similar findings in murine T cell–specific selenoprotein knockout cells in which excess cellular ROS generated by T cell activation inhibits proliferation (45). Having documented deficiency of antioxidant selenoenzymes in T cells and increased PBMC ROS levels in P1 (Figure 8, C and E), we suggest that a similar mechanism operates in the human context. Markedly shortened telomere length seen in primary cells from both cases (P1, Figure 8G; P2, Supplemental Figure 2D) correlated with reduced TRF length seen in SBP2 knockdown in human cell lines (46) and may contribute to the slightly reduced rbc number and lymphopenia seen in P1 (Figure 8A). Thus, the degree of telomere shortening in his PBMCs is comparable to that seen in subjects with TERT mutations, which is associated with aplastic anemia (47); similarly, mice engineered to have short telomeres exhibit hematologic abnormalities, including low blood counts and impaired lymphocyte proliferation (48). Intriguingly, shortened telomere length in T cells has also been specifically associated with connective tissue disorders, including lupus, RA, and scleroderma (49, 50); in this context, we note that P1 has marked Raynaud disease, albeit without other clinical or serological features of a connective tissue disorder. Although neither proband was overtly immunodeficient, telomere erosion is most likely to limit self-renewal of highly proliferative cell compartments (e.g., bone marrow), and it is conceivable that added insults (e.g., viral infection and drug toxicity) could compromise hemopoiesis or immune function in these cases.
LPS-induced TNF-α secretion from macrophages cultured in selenium-depleted medium is markedly enhanced (51). A population study has correlated circulating TNF-α/IL-6 levels with a SNP in the SELS gene and siRNA knockdown of SELS in macrophages enhances LPS-induced TNF-α and IL-6 secretion (52). We therefore suggest that the observed reduction in SELS levels (Figure 9B) accounted for the excess TNF-α and IL-6 production by PBMCs in P1 (Figure 9A). Whether particular selenoprotein deficiencies mediate defective IFN-γ production by his immune cells remains to be elucidated.
Based on previous observations of insulin resistance in subjects with SEPN1-related myopathy (53), we were surprised that both probands were markedly insulin sensitive, particularly in association with enhanced fat mass. Interestingly, increased fat mass was also a feature in the recently described childhood case (35). Both probands exhibited deficiencies of antioxidant selenoenzymes (e.g., GPx1; Table 1 and Figure 5B) and elevated cellular ROS. In this context, GPx1-null mice with elevated ROS levels have recently been shown to be more insulin sensitive (54). Elevated ROS levels enhance ERK phosphorylation in a murine Sirt-3 deficiency model (55), and a similar mechanism could account for the increased pERK levels observed in fibroblasts from P1 (Figure 10, G and H). There is also evidence for cross-talk between ERK and Akt insulin signaling pathways (56). It is therefore plausible that increased ROS and elevated pERK levels, mediating greater tissue insulin responsiveness, contribute to the enhanced insulin sensitivity in both probands.
Although hearing loss is a feature in dio2-null mice (57), the thyroid hormone profile in both P1 and P2 and other published cases is more congruent with combined partial deficiency of all deiodinases (12, 58). ROS are known to induce cochlear damage, which can be limited by antioxidant treatment (59), and GPx1-null mice exhibit susceptibility to noise-induced hearing loss (60). ROS-mediated damage can also be cumulative (61), and this alternative mechanism for hearing loss might account for our observation that auditory deficit was more severe in P1 (Supplemental Figure 3A), who is older than P2 (Supplemental Figure 3B).
Overall, we suggest that some phenotypes (e.g., azoospermia and myopathy) in this disorder are mediated by tissue-specific selenoprotein deficiencies; other features (e.g., cutaneous photosensitivity and impaired T cell proliferation) are likely mediated by impaired cellular antioxidant defense, reflecting the high oxidative stress to which these tissues are subjected with sun exposure and antigenic stimulation, respectively. Some phenotypes (e.g., photosensitivity and hearing loss) may be age-dependent, reflecting cumulative ROS-mediated damage; it is therefore conceivable that other pathologies linked to oxidative damage (e.g., neoplasia, neurodegeneration, and premature aging) may only manifest with time. Future identification of other affected subjects, by biochemical screening of cases of idiopathic male infertility, SEPN1-like myopathies, or photosensitivity, for example, may delineate phenotypes that are more variably expressed. Thus, it is tempting to speculate that the biopsy-proven colitis of unknown etiology in P2 could be related to ileocolonic inflammation seen in compound GPx1/GPx2 knockout mice (62), although P1 has no gastrointestinal problems. Conversely, whereas selective depletion of selenoproteins in murine osteochondroprogenitor cells results in epiphyseal abnormalities and chondronecrosis (63), radiologic skeletal survey and bone mineral density in P1 were normal (data not shown). Further cases may also reveal additional phenotypes linked to deficiencies of selenoproteins of unknown function.
With regard to possible therapies, T3 treatment is beneficial in childhood cases with subnormal T3 levels, as has been documented by others (12) and us in the case of P2, although a plateau in his height and weight suggests that growth retardation may not be solely related to thyroid status (Supplemental Figure 4). Although trials of selenium supplementation of previous cases raised circulating levels of the trace element, defective selenoprotein synthesis was not corrected (64). As excess lipid peroxidation in cells from our cases was ameliorated by α-tocopherol exposure (Figure 7, A and C), we suggest that, as has been advocated in SEPN1-related myopathy (65), a trial of antioxidant treatment (e.g., n-acetyl cysteine, vitamin E/α-tocopherol, and ascorbic acid) in this disorder might represent a rational alternative.
Methods
All procedures were undertaken either with approval from the Cambridge Research Ethics Committee or as clinically indicated investigations, and prior informed consent was obtained from all participating study subjects.
Sequencing of SECISBP2 gene
For each proband, exons 1–17 of the SECISBP2 gene, intron-exon boundaries, and 900 bp of the promoter region were amplified using specific primers (Supplemental Table 1) and sequenced (3100 AVANT; ABI). RNA from PBMCs was reverse transcribed to generate SECISBP2 cDNAs, which were PCR amplified and sequenced.
SBP2 mutant characterization
The T668ΔT and C691R mutations were introduced into the previously described SBP2 WT minigene (10) using the Quick-Change site-directed mutagenesis kit (Stratagene) and the following primers: T668ΔT forward, 5′-GAATTTACCACACTGGACTTCCTGAACTGCAAGGTGC-3′; T668ΔT reverse, 5′-GCACCTTGCAGTTCAGGAAGTCCAGTGTGGTAAATTC-3′; C691R forward, 5′-CTGAAGCTCAAAAAACTGAAACGTGTCATTATTTCTCCC-3′; C691R reverse, 5′-GGGAGAAATAATGACACGTTTCAGTTTTTTGAGCTTCAG-3′. Plasmid integrity was verified by sequencing. Minigenes were transiently transfected into human embryonic kidney HEK293T cells using 2 μg of plasmid DNA per well of a 6-well plate and the FuGENE 6 transfection reagent (Roche Diagnostics). Cells were lysed 48 hours after transfection and analyzed by Western blotting using antibodies to SBP2 as previously described (24). For protein stability assessment, 293T cells were transfected with the SBP2 WT or C691R constructs, and 24 hours later, the proteosome inhibitor MG132 (10 μM) was added to the cells in culture and incubated for the time indicated.
Biochemical measurements
Plasma selenium was measured by inductively coupled plasma mass spectrometry (ICPMS; Thermo Elemental). We measured rbc GPx activity by enzymatic analysis (Ransel) as described previously (66). Serum free T4, free T3, and TSH together with plasma insulin and adiponectin were measured by 2-step, time-resolved immunofluorometric (DELFIA) assays and reverse T3 by radioimmunoassay (Biocode).
Radiolabeled selenoprotein studies
PBMCs were isolated by Ficoll gradient centrifugation. T cells were isolated by immunomagnetic cell separation as specified by the manufacturer’s protocol (Miltenyi Biotec), and their purity assessed by flow cytometry was greater than 90%. Cells were incubated either in standard medium (DMEM plus 10% FBS) supplemented with 10 μCi 75Se (University of Missouri research reactor facility) or in methionine-free medium supplemented with 50 μCi 35S-Met (Perkin Elmer), harvested after 48 hours, and analyzed by SDS-PAGE and autoradiography as described previously (24).
Histopathology and Western blot assays
Histopathology.
Lateral quadriceps muscle biopsy was subjected to conventional histochemical staining. Skin biopsy and testis tissue were formalin-fixed, paraffin processed, and sectioned for H&E and IHC studies as follows. IHC of testis was performed using anti-GPx4 (rabbit polyclonal sc-50497, Santa Cruz Biotechnology at 1:150 dilution), anti-TGR (rabbit polyclonal, gift from V. Gladyshev, Brigham and Women’s Hospital, Boston, Massachusetts, USA, at 1:5,000 dilution), and anti-SELV (goat polyclonal N-14, Santa Cruz Biotechnology at 1:50 dilution) antibodies. IHC of skin was performed using an anti-GPx1 antibody (rabbit polyclonal NBP1-18664, Novus Biologicals at 1:900 dilution).
Western blotting and immunoprecipitation.
PBMCs or dermal fibroblast cells, lysed in RIPA buffer containing a protease inhibitor cocktail, or seminal plasma were analyzed by SDS-PAGE and Western blotting using specific antibodies as follows: SBP2 (rabbit polyclonal, ref. 24); GPx4 (goat polyclonal EB07316, Everest Biotech); TGR (rabbit polyclonal, gift from V. Gladyshev, ref. 29); SELV (goat polyclonal N-14, Santa Cruz Biotechnology); SELN (rabbit polyclonal ab137, Abcam, ref. 67); MSRB (mouse monoclonal ab66061, Abcam); SELS (rabbit polyclonal ab58656, Abcam); SELI (mouse polyclonal AO1, Abnova); SEPHS2 (rabbit polyclonal I-23, Santa Cruz Biotechnology). Extracts of fibroblasts, radiolabeled with 10 μCi 75Se as described above, were immunoprecipitated with a SELW antibody (rabbit polyclonal 233,833; antibodies-online) and analyzed by SDS-PAGE, with 35S-Met–labeled extracts as a loading control.
Thioredoxin reductase activity in PBMCs and skin.
Skin tissue or PBMCs from P1, his sibling, and normal controls were homogenized in buffer (50 mM Tris; 1 mM EDTA; protease inhibitor cocktail, Roche Diagnostics), sonicated, and then centrifuged to generate supernatants. TrxR activity in cell lysates was measured by a sensitive method, based on assay of thioredoxin-dependent reduction of fluorescent-labeled insulin substrate (68).
ROS, lipid peroxidation, and DNA damage assays
ROS in rbcs.
Briefly, whole blood was diluted in PBS to a concentration of approximately 1 × 10⁶ erythrocytes/ml and incubated with 1 μM 5-(and-6)-chloromethyl-2′,7′-dichlorodihydrofluorescein diacetate, acetyl ester (CM-H2DCFDA, Invitrogen) or an equivalent volume of DMSO at room temperature for 30 minutes in the dark. After incubation, CM-H2DCFDA–loaded cells were washed and resuspended in PBS, and fluorescence was measured using a LSR II flow cytometer (BD Biosciences, FL1 channel). Each experiment was performed in duplicate using blood cells sampled on 4 separate occasions.
ROS assays in PBMCs and fibroblasts.
PBMCs diluted in PBS (5–10 × 106 cells/ml) or dermal fibroblasts (50 × 103 cells/well in a 24-well plate) were incubated with either 2 μM 3′-(p-aminophenyl)fluorescein (APF) or methyl acetate (solvent control) for 30 minutes (PBMCs, room temperature; fibroblasts, 37°C) in the dark, washed in PBS, and analyzed by flow cytometry (FACScalibur, BD Biosciences, FL1 channel) to measure baseline ROS levels. Cells were also preincubated with H2O2 (0.5 mM, 30 minutes) before being loaded with APF, and fluorescence was measured over a time course of 1–60 minutes.
Endogenous H2O2 generation by fibroblasts.
Extracellular H2O2 accumulation by dermal fibroblasts (cultured in HAM’s F12 plus 20% FBS), was assayed by addition of Amplex Red (Invitrogen) to the medium and measurement of fluorescence according to the manufacturer’s protocol. Values were adjusted for viable cell numbers quantified by an MTT assay.
Lipid peroxidation.
Dermal fibroblasts (105 cells), incubated in medium (DMEM plus 10% FCS) with or without α-tocopherol (1 mM, Sigma-Aldrich), were exposed to UVA (365 nm, 1 J/cm2) for 15 minutes, then loaded with 1 μM BODIPY 581/591 C11 (Invitrogen), and fluorescence was monitored by flow cytometry on channels FL1-H at 530 nm and FL2-H at 585 nm.
Assays of DNA damage and base excision repair.
DNA damage and repair were assessed using the human 8-oxoguanine DNA glycosylase 1–modified (hOGG1-modified) alkaline comet assay. Assay in the absence of hOGG1 enables the detection of SSBs and, at pH >13, alkali-labile sites, which may include apurinic/apyrimidinic (AP) sites, oxidized AP sites, and certain modified bases (69). Assay parameters with use of hOGG1 were as optimized previously (70), with the remaining conditions also as described before (71). All procedures were carried out under subdued light to minimize adventitious DNA damage. Dermal fibroblasts (~12 × 104 cells), immobilized in 0.6% low–melting point agarose, on precoated (1% agarose) slides, were lysed in ice-cold buffer (10 mM Tris, 100 mM EDTA, 2.5 M NaCl, 1 % Triton X-100), incubated with hOGG1 (3.2 U/ml, 37°C for 45 minutes), and then electrophoresed in alkaline buffer (300 mM NaOH, 1 mM EDTA, pH ≥13). Propidium iodide–stained cells (at least 100 cells per sample) were visualized by fluorescence microscopy, and image analysis software (Comet Assay IV, Perceptive Instruments) was used to calculate the percentage of damaged DNA in the tail of the comet for each cell. The antioxidant capacity of cells was determined by quantifying DNA damage by hOGG1-modified Comet assay (as described above) immediately following their exposure to H2O2 challenge (50 μM for 30 minutes) or UVA (10 J/cm2).
8-oxoGua levels and γH2AX foci in fibroblasts.
Dermal fibroblasts grown on coverslips were processed as described previously (72). For 8-oxoGua staining, cells were incubated in the absence or presence of 50 μM H2O2 for 30 minutes, fixed (methanol/acetone), and treated with 0.05M HCl and RNAase (100 mg/ml). Alkali DNA denaturation (0.15M NaOH) and proteinase K digestion (5 mg/ml) steps were followed by incubation with anti–8-oxoGua antibody (Millipore) at 1:250 dilution. For visualization of γH2AX foci, fibroblasts were incubated in the absence or presence of 100 μM H2O2 for 30 minutes, fixed (95% ethanol and 5% acetic acid), and incubated with anti–phospho-Histone H2AX (Ser139) antibody (Millipore) at 1:500 dilution. In both protocols, cells were counterstained with DAPI and visualized by fluorescence microscopy.
Telomere restriction fragment length assay
Telomere length was determined using the Telo TAGGG telomere length assay kit (Roche). Briefly, DNA from either buccal mucosal cells or PBMCs was digested with HinfI and RsaI, separated by gel electrophoresis, Southern blotted, and hybridized with a telomere-specific digoxigenin-labeled probe, as described by the manufacturer.
T cell proliferation and cytokine production
T cell proliferation assays.
PBMCs, isolated by Ficoll gradient centrifugation, were incubated in plates coated with anti-CD3 (1 μg/ml, BD Biosciences — Pharmingen 550368), washed with medium (RPMI plus 10% autologous serum), then dye labeled (5 μM CFSE, Invitrogen) and plated (1 × 10⁶ cells/well) with either medium alone (unstimulated cells) or medium supplemented with anti-CD28 monoclonal antibody (1 μg/ml, gift from H. Waldmann, Oxford University, Oxford, United Kingdom). After 5–6 days, cells were labeled with anti-CD3 APC antibody (Serotec MCA463APC) and analyzed by FACS (BD FACSCalibur flow cytometer). CD3+ cells were identified within a gated lymphocyte population, and CFSE staining was visualized using a histogram plot (MODFIT LT 3.0 PC software, Verity Software House). The parental population was identified using unstimulated cells, and anti-CD3/CD28–induced cell proliferation was analyzed.
Cytokine profiling of PBMCs.
PBMCs isolated by Ficoll gradient centrifugation were plated (1 × 10⁶ cells/ml, 96-well plates) and exposed to stimulatory agents as follows: Pam2CSK4 and Pam3CSK4 (EMC microcollections and List biological laboratories/Quadratech, 0.4 μg/ml, blocked with 40 μg/ml Polymyxin B [Fluka]); LPS (from S. Minnesota E595, 1 μg/ml); PHA-P (10 μg/ml, Sigma-Aldrich); IL-12 (R&D Systems, 20 μg/ml); IL-18 (R&D Systems, 50 μg/ml); and IFN-γ (2 × 10⁴ U/ml, Immukin, Boehringer Ingelheim). Cell supernatants were harvested at different time points to measure cytokine levels (12 hours, TNF-α and IL-12; 24 hours, IL-6; 48 hours, IFN-γ). Cytokine levels were determined by either standard ELISA (IFN-γ, Pelikine, CLB Holland) or by Luminex (Bioplex, Biorad) technology-based assays (TNF-α and IL-6, R&D Systems) as specified by the manufacturers.
Intracellular cytokine assays.
PBMCs from P1 and normal controls were stimulated for 5 hours with PMA (50 ng/ml, Sigma-Aldrich) and ionomycin (1 μg/ml, Sigma-Aldrich) in the presence of Golgi stop (BD Biosciences — Pharmingen). Cells were then stained with RPE-Cy5–conjugated anti-CD3 and APC-conjugated anti-CD4 antibodies (BD Biosciences), fixed and permeabilized with Cytofix/Cytoperm (BD Biosciences — Pharmingen), and stained with Pacific Blue–conjugated antibody to IFN-γ (eBioscience). Data were acquired on FACS Canto II and analyzed with FACSDiva software (BD Biosciences).
Insulin signaling pathway
Fibroblasts from P1 and control cells were serum deprived (16 hours), exposed to varying concentrations of insulin (5 minutes), lysed, and analyzed by Western blotting using specific antibodies as follows: pERK1/2 (T202/T204) (mouse monoclonal 9106, Cell Signalling); pAKT (S473) (rabbit monoclonal 9271, Cell Signalling); calnexin (rabbit polyclonal ab 13504, Abcam).
Quantitative real-time PCR assays of selenoprotein expression
RNA (100 ng) from fibroblasts was reverse transcribed using a high-capacity cDNA archive kit (Applied Biosystems). Taqman assays (Applied Biosystems) used probes listed in Supplemental Table 2. The comparative Ct method was used to quantify transcripts and normalize to cyclophilin A expression levels. Additional software was used to normalize data to expression levels in control cells (GeneSpring 7.2 software, Agilent) and generate heatmaps (PARTEK genomics suite, Partek).
Statistics
For all figures, error bars indicate mean ± SEM of at least 3 independent determinations. Statistical analyses were performed using 2-tailed Student’s t test (Figure 5C; Figure 7, A and C; Figure 8, D and F; and Figure 9, A, C, and E); 2-way ANOVA (Figure 6, A, B, F, and G; Figure 8E; and Figure 10H) with post-hoc Bonferroni correction for multiple comparisons where appropriate; or Mann-Whitney tests (Figure 6, C and H, and Figure 7, B and D). A P value less than 0.05 was considered significant.
Supplementary Material
Acknowledgments
This work was supported by the Wellcome Trust and National Institute for Health Research Cambridge Biomedical Research Centre (to K. Chatterjee, M. Gurnell, and R. Semple); the Medical Research Council (to R. Fitzgerald and N. Wareham); and Muscular Dystrophy Campaign Centre (to F. Muntoni). We thank Afzal Chaudhry for advice with statistical analysis and Greg Strachan for help with confocal microscopy.
Footnotes
Conflict of interest: The authors have declared that no conflict of interest exists.
Citation for this article: J Clin Invest. 2010;120(12):4220–4235. doi:10.1172/JCI43653.
References
- 1.Steinbrenner H, Sies H. Protection against reactive oxygen species by selenoproteins. Biochim Biophys Acta. 2009;1790(11):1478–1485. doi: 10.1016/j.bbagen.2009.02.014. [DOI] [PubMed] [Google Scholar]
- 2.Avval FZ, Holmgren A. Molecular mechanisms of thioredoxin and glutaredoxin as hydrogen donors for Mammalian s phase ribonucleotide reductase. . J Biol Chem. 2009;284(13):8233–8240. doi: 10.1074/jbc.M809338200. [DOI] [PMC free article] [PubMed] [Google Scholar]
- 3.Kryukov GV, et al. Characterization of mammalian selenoproteomes. Science. 2003;300(5624):1439–1443. doi: 10.1126/science.1083516. [DOI] [PubMed] [Google Scholar]
- 4.Papp LV, Lu J, Holmgren A, Khanna KK. From selenium to selenoproteins: synthesis, identity, and their role in human health. Antioxid Redox Signal. 2007;9(7):775–806. doi: 10.1089/ars.2007.1528. [DOI] [PubMed] [Google Scholar]
- 5.Bellinger FP, Raman AV, Reeves MA, Berry MJ. Regulation and function of selenoproteins in human disease. Biochem J. 2009;422(1):11–22. doi: 10.1042/BJ20090219. [DOI] [PMC free article] [PubMed] [Google Scholar]
- 6.Berry MJ, et al. Recognition of UGA as a selenocysteine codon in type 1 deiodinase requires sequences in the 3’ untranslated region. Nature. 1991;353(6341):273–276. doi: 10.1038/353273a0. [DOI] [PubMed] [Google Scholar]
- 7.Copeland PR, Fletcher JE, Carlson BA, Hatfield DL, Driscoll DM. A novel RNA binding protein, SBP2, is required for the translation of mammalian selnoprotein mRNAs. EMBO J. 2000;19(2):306–314. doi: 10.1093/emboj/19.2.306. [DOI] [PMC free article] [PubMed] [Google Scholar]
- 8.Donovan J, Copeland PR. Threading the needle: getting selenocysteine into proteins. Antioxid Redox Signal. 2010;12(7):881–892. doi: 10.1089/ars.2009.2878. [DOI] [PMC free article] [PubMed] [Google Scholar]
- 9.Low SC, Grundner-Culemann E, Harney JW, Berry MJ. SECIS-SBP2 interactions dictate selenocysteine incorporation efficiency and selenoprotein hierarchy. EMBO J. 2000;19(24):6882–6890. doi: 10.1093/emboj/19.24.6882. [DOI] [PMC free article] [PubMed] [Google Scholar]
- 10.Papp LV, et al. Functional characterization of alternatively spliced human SECISBP2 transcript variants. Nucleic Acids Res. 2008;36(22):7192–7206. doi: 10.1093/nar/gkn829. [DOI] [PMC free article] [PubMed] [Google Scholar]
- 11.Dumitrescu AM, et al. Mutations in SECISBP2 result in abnormal thyroid hormone metabolism. Nat Genet. 2005;37(11):1247–1252. doi: 10.1038/ng1654. [DOI] [PubMed] [Google Scholar]
- 12.Di Cosmo C, et al. Clinical and molecular characterization of a novel selenocysteine insertion sequence-binding protein 2 (SBP2) gene mutation (R128X). . J Clin Endocrinol Metab. 2009;94(10):4003–4009. doi: 10.1210/jc.2009-0686. [DOI] [PMC free article] [PubMed] [Google Scholar]
- 13.Copeland PR, Stepanik VA, Driscoll DM. Insight into mammalian selenocysteine insertion: domain structure and ribosome binding properties of Sec insertion sequence binding protein 2. Mol Cell Biol. 2001;21(5):1491–1498. doi: 10.1128/MCB.21.5.1491-1498.2001. [DOI] [PMC free article] [PubMed] [Google Scholar]
- 14.Mercuri E, et al. Clinical and imaging findings in six cases of congenital muscular dystrophy with rigid spine syndrome linked to chromosome 1p (RSMD1). Neuromuscul Disord. 2002;12(7–8):631–638. doi: 10.1016/S0960-8966(02)00023-8. [DOI] [PubMed] [Google Scholar]
- 15.Janssen WJ, Collard HR, Saint S, Weinberger SE. Clinical problem-solving. A perfect storm. N Engl J Med. 2005;353(18):1956–1961. doi: 10.1056/NEJMcps050136. [DOI] [PubMed] [Google Scholar]
- 16.Schallreuter KU. Functioning methionine-S-sulfoxide reductases A and B are present in human skin. J Invest Dermatol. 2006;126(5):947–949. doi: 10.1038/sj.jid.5700086. [DOI] [PubMed] [Google Scholar]
- 17.Bonner WM, et al. GammaH2AX and cancer. Nat Rev Cancer. 2008;8(12):957–967. doi: 10.1038/nrc2523. [DOI] [PMC free article] [PubMed] [Google Scholar]
- 18.Gladyshev VN, Stadtman TC, Hatfield DL, Jeang KT. Levels of major selenoproteins in T cells decrease during HIV infection and low molecular mass selenium compounds increase. Proc Natl Acad Sci U S A. 1999;96(3):835–839. doi: 10.1073/pnas.96.3.835. [DOI] [PMC free article] [PubMed] [Google Scholar]
- 19.Petersen S, Saretzki G, von Zglinicki T. Preferential accumulation of single-stranded regions in telomeres of human fibroblasts. Exp Cell Res. 1998;239(1):152–160. doi: 10.1006/excr.1997.3893. [DOI] [PubMed] [Google Scholar]
- 20.Evans MD, Cooke MS. Factors contributing to the outcome of oxidative damage to nucleic acids. Bioessays. 2004;26(5):533–542. doi: 10.1002/bies.20027. [DOI] [PubMed] [Google Scholar]
- 21.Robinson SM, et al. Variations in infant feeding practice are associated with body composition in childhood: a prospective cohort study. J Clin Endocrinol Metab. 2009;94(8):2799–2805. doi: 10.1210/jc.2009-0030. [DOI] [PubMed] [Google Scholar]
- 22.Ong KK, Frystyk J, Flyvbjerg A, Petry CJ, Ness A, Dunger DB. Sex-discordant associations with adiponectin levels and lipid profiles in children. Diabetes. 2006;55(5):1337–1341. doi: 10.2337/db05-1272. [DOI] [PubMed] [Google Scholar]
- 23.Squires JE, Stoytchev I, Forry EP, Berry MJ. SBP2 binding affinity is a major determinant in differential selenoprotein mRNA translation and sensitivity to nonsense-mediated decay. Mol Cell Biol. 2007;27(22):7848–7855. doi: 10.1128/MCB.00793-07. [DOI] [PMC free article] [PubMed] [Google Scholar]
- 24.Papp LV, Lu J, Striebel F, Kennedy D, Holmgren A, Khanna KK. The redox state of SECIS binding protein 2 controls its localization and selenocysteine incorporation function. Mol Cell Biol. 2006;26(13):4895–4910. doi: 10.1128/MCB.02284-05. [DOI] [PMC free article] [PubMed] [Google Scholar]
- 25.Flohe L. Selenium in mammalian spermiogenesis. Biol Chem. 2007;388(10):987–995. doi: 10.1515/BC.2007.112. [DOI] [PubMed] [Google Scholar]
- 26.Ursini F, et al. Dual function of the selenoprotein PHGPx during sperm maturation. Science. 1999;285(5432):1393–1396. doi: 10.1126/science.285.5432.1393. [DOI] [PubMed] [Google Scholar]
- 27.Schneider M, et al. Mitochondrial glutathione peroxidase 4 disruption causes male infertility. FASEB J. 2009;23(9):3233–3242. doi: 10.1096/fj.09-132795. [DOI] [PubMed] [Google Scholar]
- 28.Foresta C, Flohé L, Garolla A, Roveri A, Ursini F, Maiorino M. Male fertility is linked to the selenoprotein phospholipid hydroperoxide glutathione peroxidase. Biol Reprod. 2002;67(3):967–971. doi: 10.1095/biolreprod.102.003822. [DOI] [PubMed] [Google Scholar]
- 29.Su D, et al. Mammalian selenoprotein thioredoxin-glutathione reductase. Roles in disulfide bond formation and sperm maturation. J Biol Chem. 2005;280(28):26491–26498. doi: 10.1074/jbc.M503638200. [DOI] [PubMed] [Google Scholar]
- 30.Kehr S, et al. X-ray fluorescence microscopy reveals the role of selenium in spermatogenesis. J Mol Biol. 2009;389(5):808–818. doi: 10.1016/j.jmb.2009.04.024. [DOI] [PMC free article] [PubMed] [Google Scholar]
- 31.Olson GE, Winfrey VP, Nagdas SK, Hill KE, Burk RF. Selenoprotein P is required for mouse sperm development. Biol Reprod. 2005;73(1):201–211. doi: 10.1095/biolreprod.105.040360. [DOI] [PubMed] [Google Scholar]
- 32.Moghadaszadeh B, et al. Mutations in SEPN1 cause congenital muscular dystrophy with spinal rigidity and restrictive respiratory syndrome. Nat Genet. 2001;29(1):17–18. doi: 10.1038/ng713. [DOI] [PubMed] [Google Scholar]
- 33.Ferreiro A, et al. Mutations of the selenoprotein N gene, which is implicated in rigid spine muscular dystrophy, cause the classical phenotype of multiminicore disease: reassessing the nosology of early-onset myopathies. Am J Hum Genet. 2002;71(4):739–749. doi: 10.1086/342719. [DOI] [PMC free article] [PubMed] [Google Scholar]
- 34.Ferreiro A, et al. Desmin-related myopathy with Mallory body-like inclusions is caused by mutations of the selenoprotein N gene. Ann Neurol. 2004;55(5):676–686. doi: 10.1002/ana.20077. [DOI] [PubMed] [Google Scholar]
- 35.Azevedo MF, et al. Selenoprotein-related disease in a young girl caused by nonsense mutations in the SBP2 gene. J Clin Endocrinol Metab. 2010;95(8):4066–4071. doi: 10.1210/jc.2009-2611. [DOI] [PubMed] [Google Scholar]
- 36.Schallreuter KU, Wood JM. Thioredoxin reductase – its role in epidermal redox status. J Photochem Photobiol B. 2001;64(2–3):179–184. doi: 10.1016/S1011-1344(01)00235-4. [DOI] [PubMed] [Google Scholar]
- 37.Meewes C, et al. Adaptive antioxidant response protects dermal fibroblasts from UVA-induced phototoxicity. Free Radic Biol Med. 2001;30(3):238–247. doi: 10.1016/S0891-5849(00)00463-9. [DOI] [PubMed] [Google Scholar]
- 38.Didier C, Kerblat I, Drouet C, Favier A, Béani JC, Richard MJ. Induction of thioredoxin by ultraviolet-A radiation prevents oxidative-mediated cell death in human skin fibroblasts. Free Radic Biol Med. 2001;31(5):585–598. doi: 10.1016/S0891-5849(01)00617-7. [DOI] [PubMed] [Google Scholar]
- 39.Ogawa F, et al. The repair enzyme peptide methionine-S-sulfoxide reductase is expressed in human epidermis and upregulated by UVA radiation. . J Invest Dermatol. 2006;126(5):1128–1134. doi: 10.1038/sj.jid.5700116. [DOI] [PubMed] [Google Scholar]
- 40.Papp LV, et al. SECIS binding protein 2 promotes cell survival by protecting against oxidative stress. Antioxid Redox Signal. 2010;12(7):797–808. doi: 10.1089/ars.2009.2913. [DOI] [PMC free article] [PubMed] [Google Scholar]
- 41.Seiler A, et al. Glutathione peroxidase 4 senses and translates oxidative stress into 12/15-lipoxygenase dependent- and AIF-mediated cell death. Cell Metab. 2008;8(3):237–248. doi: 10.1016/j.cmet.2008.07.005. [DOI] [PubMed] [Google Scholar]
- 42.Yoo MH, et al. Delineating the role of glutathione peroxidase 4 in protecting cells against lipid hydroperoxide damage and in Alzheimer’s disease. Antioxid Redox Signal. 2010;12(7):819–827. doi: 10.1089/ars.2009.2891. [DOI] [PMC free article] [PubMed] [Google Scholar]
- 43.Wood JM, Schallreuter KU. UVA-irradiated pheomelanin alters the structure of catalase and decreases its activity in human skin. J Invest Dermatol. 2006;126(1):13–14. doi: 10.1038/sj.jid.5700051. [DOI] [PubMed] [Google Scholar]
- 44.Schallreuter KU, et al. Methionine sulfoxide reductases A and B are deactivated by hydrogen peroxide (H2O2) in the epidermis of patients with vitiligo. . J Invest Dermatol. 2008;128(4):808–815. doi: 10.1038/sj.jid.5701100. [DOI] [PubMed] [Google Scholar]
- 45.Shrimali RK, et al. Selenoproteins mediate T cell immunity through an antioxidant mechanism. . J Biol Chem. 2008;283(29):20181–20185. doi: 10.1074/jbc.M802559200. [DOI] [PMC free article] [PubMed] [Google Scholar]
- 46.Squires JE, Davy P, Berry MJ, Allsopp R. Attenuated expression of SECIS binding protein 2 causes loss of telomeric reserve without affecting telomerase. Exp Gerontol. 2009;44(9):619–623. doi: 10.1016/j.exger.2009.06.005. [DOI] [PMC free article] [PubMed] [Google Scholar]
- 47.Yamaguchi H, et al. Mutations in TERT, the gene for telomerase reverse transcriptase, in aplastic anemia. N Engl J Med. 2005;352(14):1413–1424. doi: 10.1056/NEJMoa042980. [DOI] [PubMed] [Google Scholar]
- 48.Armanios M, Alder JK, Parry EM, Karim B, Strong MA, Greider CW. Short telomeres are sufficient to cause the degenerative defects associated with aging. Am J Hum Genet. 2009;85(6):823–832. doi: 10.1016/j.ajhg.2009.10.028. [DOI] [PMC free article] [PubMed] [Google Scholar]
- 49.Wallace DJ. Telomere diseases. N Engl J Med. 2010;362(12):1150. doi: 10.1056/NEJMc1000801. [DOI] [PubMed] [Google Scholar]
- 50.Fujii H, Shao L, Colmegna I, Goronzy JJ, Weyand CM. Telomerase insufficiency in rheumatoid arthritis. Proc Natl Acad Sci U S A. 2009;106(11):4360–4365. doi: 10.1073/pnas.0811332106. [DOI] [PMC free article] [PubMed] [Google Scholar]
- 51.Vunta H, Belda BJ, Arner RJ, Channa Reddy C, Vanden Heuvel JP, Sandeep Prabhu K. Selenium attenuates pro-inflammatory gene expression in macrophages. Mol Nutr Food Res. 2008;52(11):1316–1323. doi: 10.1002/mnfr.200700346. [DOI] [PubMed] [Google Scholar]
- 52.Curran JE, et al. Genetic variation in selenoprotein S influences inflammatory response. Nat Genet. 2005;37(11):1234–1241. doi: 10.1038/ng1655. [DOI] [PubMed] [Google Scholar]
- 53.Clarke NF, et al. SEPN1: associated with congenital fiber-type disproportion and insulin resistance. Ann Neurol. 2006;59(3):546–552. doi: 10.1002/ana.20761. [DOI] [PubMed] [Google Scholar]
- 54.Loh K, et al. Reactive oxygen species enhance insulin sensitivity. Cell Metab. 2009;10(4):260–272. doi: 10.1016/j.cmet.2009.08.009. [DOI] [PMC free article] [PubMed] [Google Scholar]
- 55.Sundaresan NR, Gupta M, Kim G, Rajamohan SB, Isbatan A, Gupta MP. Sirt3 blocks the cardiac hypertrophic response by augmenting Foxo3a-dependent antioxidant defense mechanisms in mice. J Clin Invest. 2009;119(9):2758–2771. doi: 10.1172/JCI39162. [DOI] [PMC free article] [PubMed] [Google Scholar]
- 56.von Kriegsheim A, et al. Cell fate decisions are specified by the dynamic ERK interactome. Nat Cell Biol. 2009;11(12):1458–1464. doi: 10.1038/ncb1994. [DOI] [PMC free article] [PubMed] [Google Scholar]
- 57.Ng L, et al. Hearing loss and retarded cochlear development in mice lacking type 2 iodothyronine deiodinase. Proc Natl Acad Sci U S A. 2004;101(10):3474–3479. doi: 10.1073/pnas.0307402101. [DOI] [PMC free article] [PubMed] [Google Scholar]
- 58.Galton VA, Schneider MJ, Clark AS, St Germain DL. Life without thyroxine to 3,5,3’-triiodothyronine conversion: studies in mice devoid of the 5’-deiodinases. Endocrinology. 2009;150(6):2957–2963. doi: 10.1210/en.2008-1572. [DOI] [PMC free article] [PubMed] [Google Scholar]
- 59.Ohinata Y, Yamasoba T, Schacht J, Miller JM. Glutathione limits noise–induced hearing loss. Hear Res. 2000;146(1–2):28–34. doi: 10.1016/S0378-5955(00)00096-4. [DOI] [PubMed] [Google Scholar]
- 60.McFadden SL, Ohlemiller KK, Ding D, Shero M, Salvi RJ. The influence of superoxide dismutase and glutathione peroxidase deficiencies on noise–induced hearing loss in mice. Noise and Health. 2001;3(11):49–64. [PubMed] [Google Scholar]
- 61.Riva C, Donadieu E, Magnan J, Lavieille JP. Age-related hearing loss in CD/1 mice is associated to ROS formation and HIF target proteins up-regulation in the cochlea. Exp Gerontol. 2007;42(4):327–336. doi: 10.1016/j.exger.2006.10.014. [DOI] [PubMed] [Google Scholar]
- 62.Chu FF, et al. Bacteria-induced intestinal cancer in mice with disrupted Gpx1 and Gpx2 genes. Cancer Res. 2004;64(3):962–968. doi: 10.1158/0008-5472.CAN-03-2272. [DOI] [PubMed] [Google Scholar]
- 63.Downey CM, et al. Osteo-chondroprogenitor-specific deletion of the selenocysteine tRNA gene, Trsp, leads to chondronecrosis and abnormal skeletal development; a putative model for Kashin-Beck disease. PLoS Genet. 2009;5(8):e1000616. doi: 10.1371/journal.pgen.1000616. [DOI] [PMC free article] [PubMed] [Google Scholar]
- 64.Schomburg L, et al. Selenium supplementation fails to correct the selenoprotein synthesis defect in subjects with SBP2 gene mutations. Thyroid. 2009;19(3):277–281. doi: 10.1089/thy.2008.0397. [DOI] [PMC free article] [PubMed] [Google Scholar]
- 65.Arbogast S, Beuvin M, Fraysse B, Zhou H, Muntoni F, Ferreiro A. Oxidative stress in SEPN1-related myopathy: from pathophysiology to treatment. Ann Neurol. 2009;65(6):677–686. doi: 10.1002/ana.21644. [DOI] [PubMed] [Google Scholar]
- 66.Mishra V, et al. Effect of selenium supplementation on biochemical markers and outcome in critically ill patients. Clin Nutr. 2007;26(1):41–50. doi: 10.1016/j.clnu.2006.10.003. [DOI] [PubMed] [Google Scholar]
- 67.Petit N, et al. Selenoprotein N: an endoplasmic reticulum glycoprotein with an early developmental expression pattern. Hum Mol Genet. 2003;12(9):1045–1053. doi: 10.1093/hmg/ddg115. [DOI] [PubMed] [Google Scholar]
- 68.Arner ES, Zhong L, Holmgren A. Preparation and assay of mammalian thioredoxin and thioredoxin reductase. Methods Enzymol. 1999;300:226–239. doi: 10.1016/s0076-6879(99)00129-9. [DOI] [PubMed] [Google Scholar]
- 69.Cadet J, et al. Oxidative base damage to DNA: specificity of base excision repair enzymes. Mutat Res. 2000;462(2–3):121–128. doi: 10.1016/s1383-5742(00)00022-3. [DOI] [PubMed] [Google Scholar]
- 70.Cooke MS, Duarte TL, Cooper D, Chen J, Nandagopal S, Evans MD. Combination of azathioprine and UVA irradiation is a major source of cellular 8-oxo-7,8-dihydro-2’-deoxyguanosine. DNA Repair (Amst). 2008;7(12):1982–1989. doi: 10.1016/j.dnarep.2008.08.007. [DOI] [PubMed] [Google Scholar]
- 71.Duarte TL, Cooke MS, Jones GD. Gene expression profiling reveals new protective roles for vitamin C in human skin cells. Free Radic Biol Med. 2009;46(1):78–87. doi: 10.1016/j.freeradbiomed.2008.09.028. [DOI] [PubMed] [Google Scholar]
- 72.Suraweera A, et al. Senataxin, defective in ataxia oculomotor apraxia type 2, is involved in the defense against oxidative DNA damage. J Cell Biol. 2007;177(6):969–979. doi: 10.1083/jcb.200701042. [DOI] [PMC free article] [PubMed] [Google Scholar]
Associated Data
This section collects any data citations, data availability statements, or supplementary materials included in this article.


