Abstract
Noonan syndrome (NS) is an autosomal dominant genetic disorder characterized by short stature, unique facial features, and congenital heart disease. About 10%–15% of individuals with NS have mutations in son of sevenless 1 (SOS1), which encodes a RAS and RAC guanine nucleotide exchange factor (GEF). To understand the role of SOS1 in the pathogenesis of NS, we generated mice with the NS-associated Sos1E846K gain-of-function mutation. Both heterozygous and homozygous mutant mice showed many NS-associated phenotypes, including growth delay, distinctive facial dysmorphia, hematologic abnormalities, and cardiac defects. We found that the Ras/MAPK pathway as well as Rac and Stat3 were activated in the mutant hearts. These data provide in vivo molecular and cellular evidence that Sos1 is a GEF for Rac under physiological conditions and suggest that Rac and Stat3 activation might contribute to NS phenotypes. Furthermore, prenatal administration of a MEK inhibitor ameliorated the embryonic lethality, cardiac defects, and NS features of the homozygous mutant mice, demonstrating that this signaling pathway might represent a promising therapeutic target for NS.
Introduction
Noonan syndrome (NS), estimated to affect 1 out of 1,000–2,500 newborns, is characterized by variable developmental delay, short stature, characteristic facial features, congenital heart disease (CHD), and predisposition to myeloproliferative disease (MPD) (1–4). CHD is the primary cause of morbidity and mortality in NS patients. Pulmonary valve stenosis (PS) is the most common NS-associated cardiac phenotype, although some NS patients have cardiac hypertrophy and/or septal defects.
NS can occur sporadically or be inherited in an autosomal dominant fashion. Positional cloning and candidate gene approaches have identified NS-associated gene mutations in protein tyrosine phosphatase, non-receptor type 11 (PTPN11), son of sevenless 1 (SOS1), and RAF1 in about 60%–70% of NS cases, along with more rare mutations in N-RAS, K-RAS, and SHOC2 (5–12). Although additional NS genes remain to be identified, all the NS genes identified thus far encode mutant versions of RAS/MAPK pathway components that result in increased signaling in the pathway. Several related syndromes, also caused by mutations in RAS/MAPK family genes, share phenotypes with NS but also have significant differences (1). Although there is some purported genetic overlap, in most cases, mutations in different genes are associated with distinct syndromes. These disorders, now collectively referred to as the “Rasopathies,” show that germline mutations in members of the RAS/MAPK pathway lead to a phenotypically related set of genetic disorders (1, 13). A detailed understanding of the molecular etiology of these syndromes should yield new insights into the complexity of RAS/MAPK pathway regulation and is critical to intelligent pharmacological intervention.
About 10%–15% of NS cases are caused by gain-of-function mutations in SOS1 (7, 8), which encodes a bifunctional guanine nucleotide exchange factor (GEF) for RAS and RAC (14–18). A common NS-associated SOS1 missense mutation, E846K, is thought to cause a conformational change in the protein that leads to constitutive RASGEF activation (7, 8). Cultured cells transfected with the SOS1E846K mutant show sustained RAS activation and increased levels of phosphorylated ERK1/2 (p-ERK1/2) in response to EGF stimulation, suggesting that the RAS/MAPK pathway is activated by this mutation (8). Although most of the phenotypes in NS patients with the PTPN11 or SOS1 mutation are indistinguishable, PS and atrial septal defects (ASDs) are more prevalent in PTPN11 cases than in SOS1 cases, whereas those with SOS1-associated NS are less likely to have short stature or significant developmental delays (7, 8), suggesting that the underlying molecular effects of SOS1 and PTPN11 mutations might be overlapping but distinct.
As the RAS/MAPK pathway is also frequently affected by mutations in cancers, many inhibitors of pathway components are under development as antineoplastic agents (19–21). These inhibitors might be useful for treating the Rasopathies. Accurate mouse models of these disorders can be useful for prioritizing potential therapeutic agents.
To better understand the molecular pathogenesis of NS caused by SOS1 mutations and to enable evaluation of drug interventions to treat the phenotypic features of NS, we generated and characterized a mouse line carrying the Sos1E846K-activating mutation.
Results
Generation of E846K mice by unidirectional recombination.
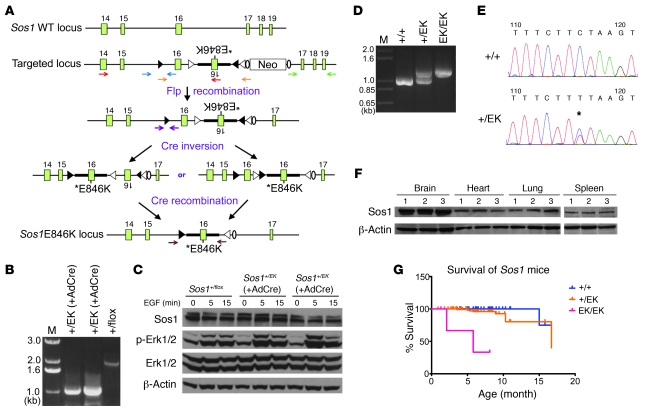
The MAPK pathway is critical for many cellular functions throughout embryogenesis. To eliminate the possibility that expression of an activating Sos1 mutation might lead to dominant embryonic lethality, we introduced a silent Sos1E846K mutation into mouse ES cells that could be activated only when desired. To accomplish this goal, we used a unidirectional loxP recombination system in which selective recombination is achieved by means of a mutant loxP (mloxP) site that preferentially recombines with another mloxP but not with WT loxP (wloxP) and vice versa (22) (Figure 1A).
Figure 1. Generation of knock-in mice expressing Sos1EK.
(A) Schematic representation of unidirectional targeting of Sos1EK in exon 16. When Cre recombinase is present, inversions occur either between the wloxP sites or the mloxP sites at opposite orientations, generating loxP sites with identical orientation. Subsequently, Cre recombinase mediates the excision between wloxP or mloxP sites in the same orientation, resulting in a targeted exon bearing the E846K mutation (solid triangles, wloxP; open triangles, mloxP; ovals, FRT site). Exons are indicated by rectangles. Primer pairs indicated by red, blue, green, and purple arrows were used in long-range PCR to screen positive ES cell clones (see Methods and Supplemental Figure 6). (B) Results of PCR of 2 ES cell clones with (and 1 clone without) Ad-Cre infection, showing that the desired modification has been achieved, using primer pairs indicated by orange arrows in A. M, DNA marker. Numbers indicate the size of PCR bands in kilo-base pairs (kb). (C) Sos1EK activates Erk1/2 in 2 ES cell clones after Ad-Cre infection. ES cells were starved and stimulated with EGF (25 ng/ml) and analyzed by immunoblotting. (D) PCR results for genotyping the Sos1EK-targeted locus, using primer pairs indicated by brown arrows in A. (E) Sequencing results of the RT-PCR of WT and Sos1+/EK RNAs. The asterisk indicates the E846K mutation. (F) Immunoblotting showing equal amount of Sos1 proteins in tissues of all genotypes (1, WT; 2, Sos1+/EK; 3, Sos1EK/EK). (G) Kaplan-Meier survival curves of the mice. WT, n = 92; Sos1+/EK, n = 137; P = 0.02 versus WT. Sos1EK/EK, n = 4; P < 0.001 versus WT.
To test the efficacy of this strategy, we infected properly targeted ES cells with Cre recombinase–encoding adenovirus (Ad-Cre). Examination of genomic DNA from resulting colonies using long-range PCR revealed the desired inversion and recombination events (Figure 1B). Importantly, the level of Sos1 protein in the infected colonies was similar to that in the uninfected cells (Figure 1C). Moreover, p-Erk1/2 levels, an indicator of Erk activity, were increased in the infected cells in response to EGF stimulation (Figure 1C). These results indicated that the unidirectional recombination successfully introduced the functional E846K mutation into the ES cells.
We injected 2 ES clones (without Ad-Cre infection) into C57BL/6J blastocysts and obtained high-percentage chimeric mice that transmitted the modified allele to the germline. These mice were mated with EIIA-Cre transgenic mice, which express Cre recombinase in their germline (23). Examination of DNA from the resulting mice using PCR and sequencing revealed that the recombination events occurred as expected (Figure 1D and data not shown). RT-PCR with mRNA-specific primers, followed by sequencing as well as immunoblotting experiments, showed that the Sos1E846K allele was expressed at normal levels (Figure 1, E and F). We refer to the mutant locus as Sos1EK.
Homozygosity of Sos1EK results in severe cardiac defects and embryonic lethality.
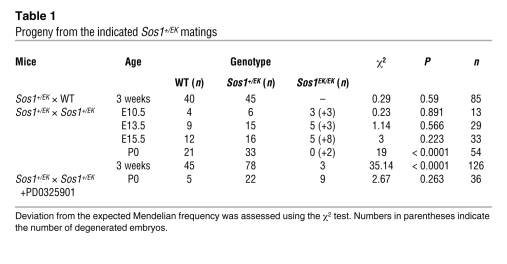
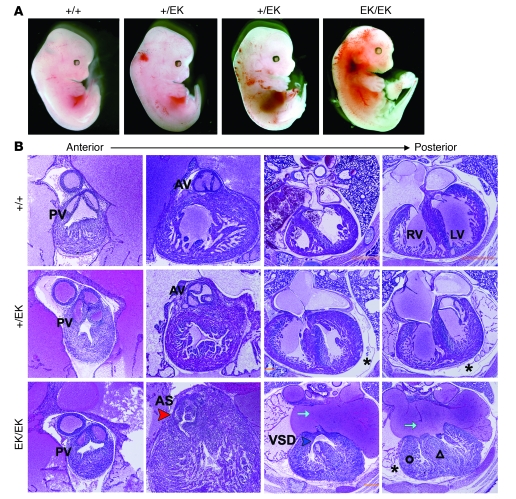
We obtained Sos1+/EK mice at the expected Mendelian ratios from backcrosses with WT mice in a C57BL/6J background and from intercrosses of Sos1+/EK mice in a mixed C57BL/6J and 129S1/SvImJ background (Table 1). However, the number of Sos1EK/EK progeny from the intercross was significantly lower than the expected frequency (n = 3 out of 126 mice, 2.38%; χ2 = 35.14, P < 0.0001; Table 1). Analysis of embryos at different stages of embryogenesis revealed that Sos1EK/EK mice died at various stages from E10.5 to the neonatal stage (Table 1). Sos1EK/EK embryos showed subcutaneous edema and hemorrhage, suggesting severe impairment of cardiovascular function (Figure 2A). Histological analysis of E15.5 Sos1EK/EK embryos showed several cardiac defects, including secundum ASD (n = 5/5 embryos), ventricular septal defect (n = 4/5 embryos), aortic valvular (AV) stenosis (AS) due to thickened leaflets (n = 3/5 embryos), interventricular septal (IVS) and right ventricular hypertrophy (n = 3/5 embryos), and pericardial effusions (n = 5/5 embryos) (Figure 2B). Secundum ASD, a typical type of ASD diagnosed in NS patients, was also observed in Sos1+/EK embryos, while only foramen ovale was observed in WT embryos (data not shown).
Table 1 .
Progeny from the indicated Sos1+/EK matings
Figure 2. Cardiac defects in Sos1EK/EK embryos.
(A) Gross appearance of E13.5 embryos. (B) Representative H&E-stained transverse sections of hearts from E15.5 embryos. Note edema (asterisks), AS (red arrowhead), ASD (cyan arrows), ventricular septal defect (VSD, blue arrowhead), right ventricular hypertrophy (open circle), and IVS hypertrophy (open triangle) in Sos1EK/EK hearts. PV, pulmonary valve. PV and AV original magnification, ×10. Four-Chamber sections original magnification, ×4.
To assess what part of the developing heart might be involved in leading to these phenotypes, we examined the expression patterns of Sos1 in this organ at E13.5. We observed that Sos1 protein was predominantly expressed in the aortic arch, pulmonary trunk, and the semilunar and the atrioventricular valves (Supplemental Figure 1; supplemental material available online with this article; doi: 10.1172/JCI43910DS1). This expression pattern was similar in the WT and mutant embryos (Supplemental Figure 1).
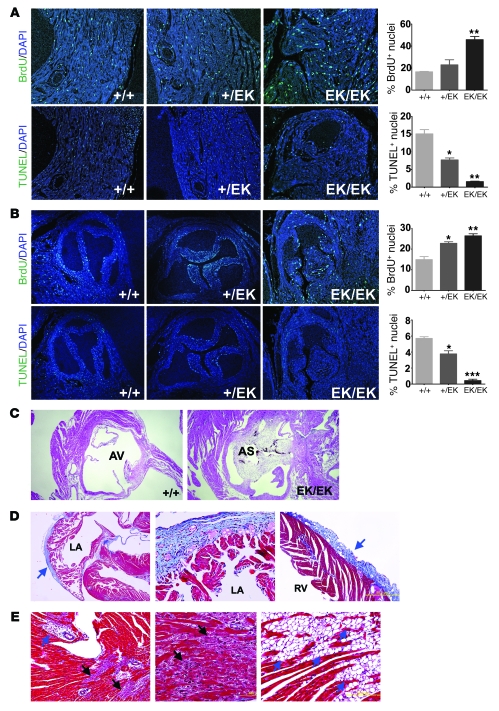
Developmental remodeling of cardiac tissues involves substantial cell proliferation and apoptosis at specific times and regions, such as in the developing valves of aortic and pulmonary trunk and the upper part of the IVS (24). We investigated cell proliferation using BrdU staining and apoptosis using TUNEL assay in the upper IVS region (Figure 3A) and AV leaflets (Figure 3B) in E15.5 embryos. At both sites, we observed increased BrdU labeling and a decreased number of TUNEL-positive cells in Sos1EK/EK embryos compared with those of WT littermate controls, which could account for or contribute to the thickened AV and hypertrophic IVS (Figure 2B and Figure 3, A and B). These data suggest that aberrant patterns of cell proliferation and apoptosis are the cause of thickening of the semilunar valve and septal defects in the Sos1EK/EK mice.
Figure 3. Cardiac defects in Sos1EK/EK mice.
(A and B) Immunofluorescence staining for BrdU (top rows) and TUNEL (bottom rows) in the (A) interventricular septum and (B) aortic valve leaflets of E15.5 embryos. Graphs show quantification with error bars indicating SD. *P < 0.05, **P < 0.01, ***P < 0.001 when compared with WT littermates. (C) H&E-stained sections showing AS in 3-month-old Sos1EK/EK mice. (A–C) Original magnification, ×4. (D) Masson trichrome staining of heart tissue, showing fibrosis in 3-month-old Sos1EK/EK mice. Note blue collagen staining in the left atrial (LA) epicardium (blue arrow) (left panel original magnification, ×4), with a magnified view in the middle panel (original magnification, ×20), as well as in right ventricular epicardium (right panel, original magnification, ×10). (E) Masson trichrome staining of Sos1EK/EK hearts. Black arrows indicate degenerating cardiomyocytes. Blue arrows indicate adipocytes in the area surrounding (or around) the blood vessels (left panel, original magnification, ×10) and within the interventricular septum (right panel, original magnification, ×20).
The few Sos1EK/EK mice that were born had a significantly lower life expectancy (Figure 1G). Histological analysis of these mice at the age of 3 months showed severe AS due to thickened leaflets (n = 3 mice; Figure 3C). Masson trichrome staining revealed epicardial and myocardial fibrosis (Figure 3D and Supplemental Figure 2) and degenerated myocardium (Figure 3E) in Sos1EK/EK hearts. Interestingly, we observed a significant amount of adipocyte infiltration in the ventricular myocardium and in the surrounding blood vessels in the Sos1EK/EK hearts (Figure 3E). None of these phenotypes were observed in WT littermates, whereas a small number of adipocytes were seen in the Sos1+/EK hearts (data not shown). Taken together, these data suggest that Sos1EK homozygosity caused multiple cardiac defects, similar to those in humans with NS, as well as a significant degree of embryonic lethality.
Sos1+/EK mice develop cardiac hypertrophy.
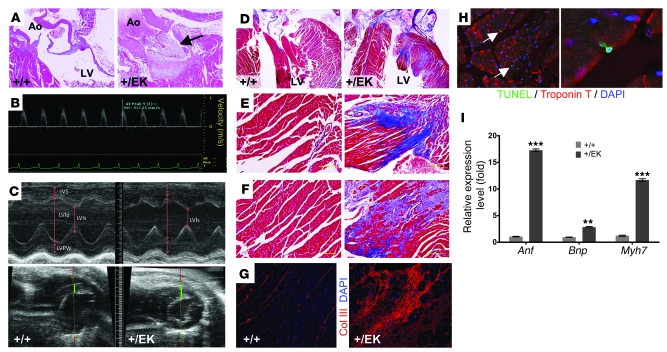
Although subcutaneous edema, hemorrhage, and pericardial effusion were observed in some Sos1+/EK embryos (Figure 2, A and B), we obtained Sos1+/EK mice at the expected frequency (Table 1). Histological analysis of Sos1+/EK mice showed that some of them developed AS due to thickened leaflets, starting at the age of 8.5 months (n = 4/10 mice; Figure 4A). Although NS patients with SOS1 mutation develop PS, we did not observe PS in the Sos1+/EK hearts (data not shown).
Figure 4. Cardiac defects in Sos1+/EK mice.
(A) Representative H&E-stained transverse sections, showing AS (arrow) in Sos1+/EK hearts. Ao, aorta. Original magnification, ×10. (B) Representative Doppler image, with measurement of ascending aortic peak velocity of an 8-month-old Sos1+/EK mouse. (C) Representative M-mode (left parasternal short axis view; top) and 2D (left parasternal long and short axes; bottom) echocardiographic images obtained from 8-month-old mice. Green bars (bottom) indicate the thickness of interventricular septum. IVS, IVS thickness; LVId, left ventricular dimension at diastole; LVIs, left ventricular dimension at systole; LVPW, left ventricular posterior wall thickness. (D–F) Representative Masson trichrome staining showing fibrosis in the hearts of a 9-month-old Sos1+/EK mouse (right) but not in a WT littermate (left). (D) Original magnification, ×4. (E and F) Original magnification, ×10. (G) Immunofluorescence staining of collagen III (Col III) in the left ventricular wall. Original magnification, ×40. (H) TUNEL assay costained with the cardiomyocyte marker Troponin T, showing cardiomyocyte death in a Sos1+/EK heart; the right panel shows a higher magnification view. Arrows indicate TUNEL positive cells. Original magnification, ×40 and ×64. (I) Representative quantitative real-time PCR results, showing increased expression of cardiac hypertrophic markers in the Sos1+/EK hearts. Error bars indicate SD. **P < 0.01; ***P < 0.001.
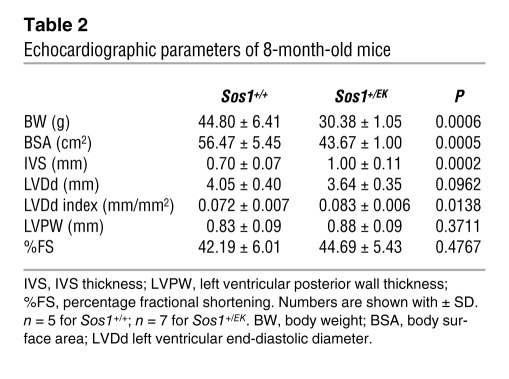
With or without valve dysfunction, about 20% of SOS1 mutant-associated NS patients develop HCM (7, 8). We monitored male Sos1+/EK mice using echocardiography monthly, beginning at 5 months. The echocardiograms of approximately 5- to 7-month-old WT and Sos1+/EK mice were comparable (data not shown). At 8 months, while Doppler examinations of aortic blood velocity suggested normal valve function (130 ± 34.6 cm/s; Figure 4B), maximal wall thickness in the IVS was significantly increased in Sos1+/EK mice (n = 7 mice) when compared with that of WT littermate controls (n = 5 mice) (1.0 ± 0.11 mm vs. 0.7 ± 0.07 mm; P < 0.001; Figure 4C and Table 2). In humans, the left ventricular end-diastolic diameter (LVDd) is indexed for the body weight to enable comparison among individuals with significantly different body size (25). Because of the significant differences in body weight between WT and Sos1+/EK mice (see below), we normalized the LVDd to the body surface area (BSA) of the mice. The indexed parameters showed a significantly increased LVDd in Sos1+/EK mice when compared with that of WT littermates. Taken together, these results indicated that Sos1+/EK mice developed left ventricular hypertrophy (LVH; Table 2). Importantly, Sos1+/EK mice had normal blood pressure, suggesting that hypertension was not the cause of their LVH (Supplemental Table 1).
Table 2 .
Echocardiographic parameters of 8-month-old mice
Wheat germ agglutinin staining of the Sos1+/EK hearts at 8.5 months of age showed increased size and irregular shape of cardiomyocytes (Supplemental Figure 3). Masson trichrome staining of Sos1+/EK hearts showed severe fibrosis of the left ventricular walls (Figure 4D), with both focal (Figure 4E) and interstitial (Figure 4F) fibrosis. Collagen III staining further confirmed significantly increased collagen deposits in Sos1+/EK hearts (Figure 4G). In addition, the cardiomyocytes around the fibrotic areas showed TUNEL-positive nuclei, indicating cardiomyocyte death in the Sos1+/EK mice (Figure 4H). Several hypertrophic markers, including atrial natriuretic factor (Anf), B-type natriuretic peptide (Bnp), and myosin heavy polypeptide 7, cardiac muscle, β (Myh7), were overexpressed in the Sos1+/EK hearts (Figure 4I). Taken together, our results show that Sos1+/EK mice develop pathological cardiac hypertrophy, which is also seen in NS patients.
Short stature and facial dysmorphia in Sos1+/EK mice.
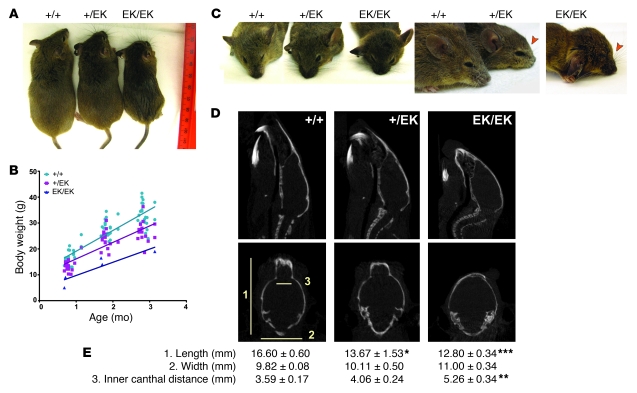
NS is characterized by short stature (7, 8). Similarly, Sos1+/EK and Sos1EK/EK mutant mice showed gene dosage-dependent reduced body size, weight, and length, with preservation of overall body proportions when compared with WT littermates (Figure 5, A and B). As with NS patients, Sos1+/EK and Sos1EK/EK faces tended to be more “triangular” (Figure 5C), and mutant mice also tended to have blunter snouts caused by depression of the anterior frontal bone (Figure 5C). We further characterized the bone structure and quantified the actual dimensions of the mouse skull using CT scans (Figure 5D). Sos1+/EK and Sos1EK/EK mice had significantly shorter skull lengths and increased inner canthal distances when compared with those of WT littermates at the age of 3 months (Figure 5E).
Figure 5. Short stature and facial dysmorphia in Sos1EK mice.
(A) Representative appearance of 3-month-old littermates, showing reduced body length and size in Sos1 mutant mice. (B) Body weights of WT and mutant male mice with lines fit by linear regression. (P < 0.001 for Sos1+/EK versus WT and P < 0.05 for Sos1EK/EK versus WT.) (C) Facial defects in 3-month-old Sos1 mice. Arrowheads indicate blunt noses of mutant mice. (D) CT scans of 3-month-old mice. A sagittal projection (top row) and a coronal projection (bottom row) are shown. Numbers refer to the measurements shown in E. (E) Morphometric characteristics of the mice. Measurements were obtained on the CT sections at the same axial, coronal, and sagittal reference position in all mice (n = 3 for each genotype). Numbers are shown with SD. *P < 0.05, **P < 0.01, ***P < 0.001.
Hematological disorders in Sos1+/EK mice.
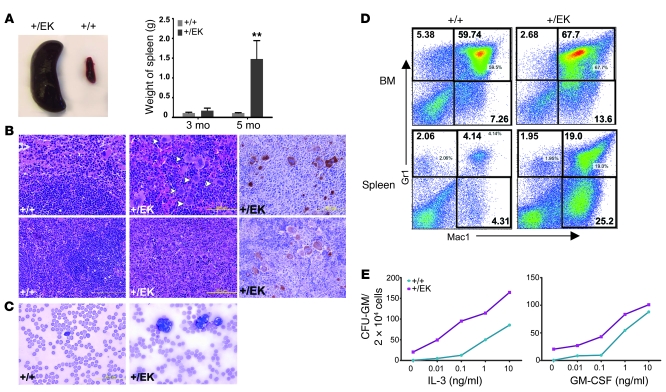
Individuals with NS often have unexplained hepatosplenomegaly and some develop MPD (3). By the age of 5 months, Sos1+/EK mice developed splenomegaly (n = 8/8 mice; Figure 6A) resulting from extramedullary hematopoiesis, with increased erythropoiesis and increased numbers of megakaryocytes (Figure 6B). Blood smears from the Sos1+/EK mice showed an increased number of neutrophils (n = 3/8 mice; Figure 6C). Sos1+/EK mice showed a subtle but significant increase of leukocytes in peripheral blood counts when compared with WT littermates (4.74 ± 3.37 × 10³/μl vs. 2.06 ± 1.08 × 10³/μl; P < 0.05; Supplemental Table 2) at the age of 5 months. Flow cytometric analysis confirmed the myeloid expansion in the bone marrow and spleen of Sos1+/EK mice (Figure 6D and Supplemental Figure 4). Bone marrow progenitors from Sos1+/EK mice showed increased sensitivity to IL-3 or GM-CSF and also gave rise to factor-independent colonies (Figure 6E). These results indicate that Sos1EK is associated with the development of hematological disorders.
Figure 6. Sos1+/EK mice develop hematological disorder.
(A) Representative view showing splenomegaly in Sos1+/EK mice, with quantification graphed (n = 8). Error bars indicates SD. **P < 0.01. (B) Representative H&E-stained sections of spleens, showing increased numbers of megakaryocytes (white arrowheads) and massive increase of red pulp (bottom panel) in the Sos1+/EK mice. Immunohistochemistry staining showing CD41-positive megakaryocytes (brown cells; right panels). Original magnification, ×75. (C) Blood smears showing an increased number of neutrophils in Sos1+/EK mice. Original magnification, ×100. (D) Flow cytometric analysis of bone marrow and spleen, showing increased percentages of myeloid lineage (Mac1+ and Mac1+Gr1+) cells in Sos1+/EK mice (P < 0.05 for bone marrow; P < 0.01 for spleen). Numbers indicate the percentage of positively-stained cells. (E) Increased myeloid colony formation of Sos1+/EK bone marrow in the absence or presence of the indicated concentrations of GM-CSF or IL-3 (P < 0.05 and P < 0.01, respectively).
Signaling abnormalities in Sos1EK hearts.
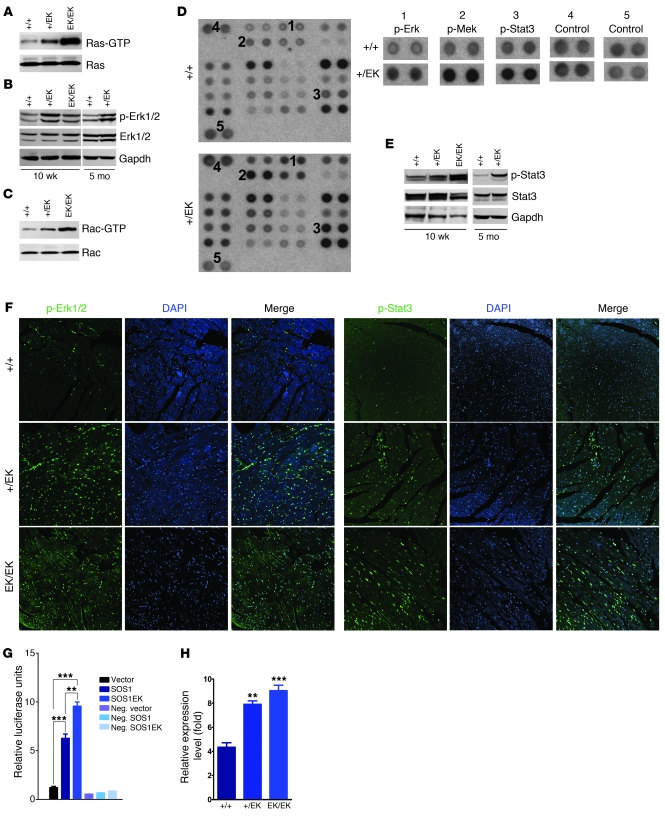
Human cells that overexpress SOS1E846K show increased RasGEF activity, as manifested by sustained RAS activation and increased levels of p-ERK in response to EGF stimulation (8). Consistent with these findings, we observed increased Ras-GTP (Figure 7A) and p-Erk1/2 (Figure 7B) levels in Sos1+/EK and Sos1EK/EK hearts.
Figure 7. Altered signaling in Sos1EK hearts.
(A) Ras-GTP levels are increased in mutant hearts. (B) p-Erk1/2 levels are increased in mutant hearts. (C) Rac-GTP levels are increased in mutant hearts. (D) The phospho-kinase array detects phosphorylated proteins in WT and Sos1+/EK heart lysates (left panel). The right panel shows higher magnification of numbered spots on the left panel. Note increased levels of p-Erk1/2, p-Mek, and p-Stat3 in Sos1+/EK hearts. (E) Increased levels of p-Stat3 in the mutant hearts. (F) Immunofluorescence staining of p-Erk1/2 and p-Stat3 in heart sections from 3-month-old mice. Note colocalization of p-Erk1/2 and p-Stat3 with the DAPI stain. Original magnification, ×40. (G) STAT3 reporter assay showing increased STAT3 transcriptional activities in cells cotransfected with SOS1 or SOS1E846K. **P < 0.01, ***P < 0.01. neg, cotransfected with negative control vector. (H) Quantitative real-time PCR results showing increased expression of IL-6 in the Sos1EK hearts. Error bars indicate SD. n = 3 for each genotype. **P < 0.01, ***P < 0.001 when compared with WT littermates.
Several studies have shown that Sos1 also can function as a RacGEF in transfected cell systems (14). We also observed a gene dosage-dependent increase in the level of endogenous Rac1-GTP in Sos1+/EK and Sos1EK/EK hearts (Figure 7C), providing the first evidence to our knowledge that Sos1EK also functions as a RacGEF under physiologically relevant conditions.
We also asked whether Sos1EK leads to increased activation of other MAPK pathway components or alterations in other signaling pathways that are associated with cardiac hypertrophy. We profiled kinase phosphorylation using phospho-kinase array (Figure 7D) and validated the results using immunoblotting. Interestingly, we found that the level of phosphorylated-Stat3 at Tyr705 (p-Stat3) was significantly increased in Sos1+/EK and Sos1EK/EK hearts (Figure 7, D and E). In contrast, we did not detect consistent activation of phosphorylation of Stat3 at Ser727, Stat5, p38, JNK, or Akt in all of the Sos1EK hearts (Supplemental Figure 5). Both p-Erk1/2 and p-Stat3 can translocate to the nucleus and increase transcriptional initiation (26, 27). We observed increased nuclear staining of both p-Erk1/2 and p-Stat3 in Sos1+/EK and Sos1EK/EK hearts (Figure 7F). In addition, overexpression of SOS1E846K increased the transcriptional activities of STAT3 when compared with WT SOS1 in human cells (Figure 7G), which further confirmed the activation of STAT3 by SOS1E846K mutation.
Previous studies suggest that Rac1 can induce STAT3 phosphorylation at Tyr705, but not at Ser727, by promoting autocrine production of IL-6 (28, 29). Interestingly, we detected increased expression of IL-6 in Sos1+/EK and Sos1EK/EK hearts (Figure 7H). These results suggest that Sos1EK increased Rac activity that might induce Stat3 activation through autocrine IL-6. Erk1/2 and Stat3 are known to be involved in cardiac hypertrophy (30–33), and it is likely that both signaling molecules contribute to the cardiac phenotypes observed in the Sos1EK mice.
Prenatal treatment with MEK inhibitor improves the embryonic lethality and NS features in Sos1EK/EK mice.
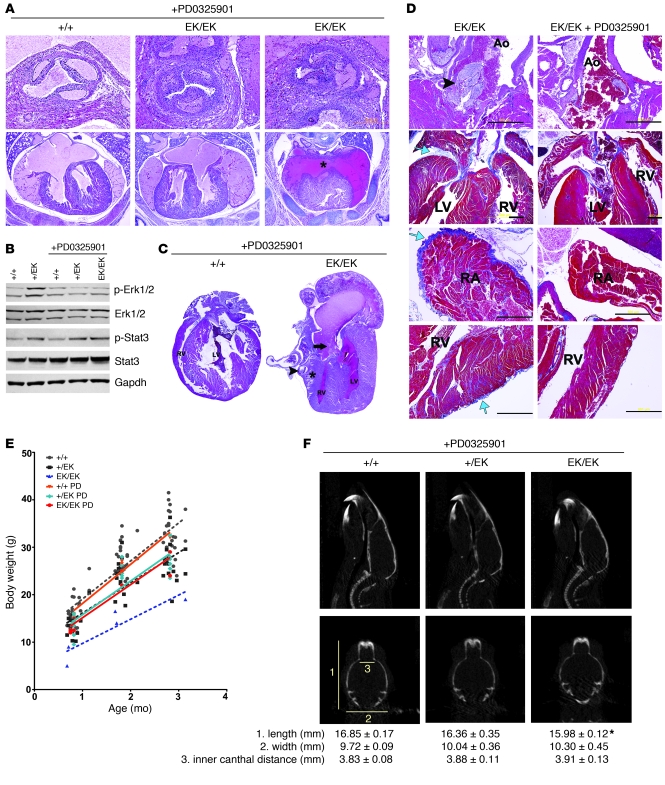
We asked whether treating pregnant mothers with a small-molecule RAS/MAPK pathway inhibitor could diminish the embryonic lethality or phenotypic features of Sos1 mutant offspring. PD0325901 selectively binds to and inhibits MEK, resulting in reduction of the phosphorylation and activation of Erk1/2 (19, 34–36). PD0325901 was shown to be efficient in preventing tumor incidence and growth in mice at a dosage of 1 mg/kg of body weight (mg/kg) (37). Therefore, we administered PD0325901 (1 mg/kg) daily i.p. to pregnant mice from Sos1+/EK intercrosses (n = 6 mice), beginning at 7 days post coitum and continuing (in nursing females) until P9. Beginning at P10, the drug was injected individually into pups (i.p.) until P28. Prenatal administration of the drug completely rescued the prenatal lethality of homozygous mice, such that they were born at the expected Mendelian ratio (n = 9 out of 36 mice, 25%; χ2 = 2.67, P = 0.263; Table 1). We examined 3 Sos1EK/EK mice at P2 and found a normal heart structure in 2 of the mice, while the third had died and had a secundum ASD (Figure 8A). Immunoblotting indicated that the phosphorylation of Erk1/2 had been normalized, whereas p-Stat3 levels remained high in Sos1EK/EK hearts (Figure 8B). One Sos1EK/EK mouse died at P14 with a secundum ASD and hypertrophic right ventricles with dilated epicardial vessels (Figure 8C). The rest of the Sos1EK/EK mice survived (n = 5 mice) and, unlike untreated Sos1EK/EK mice, had no anatomical abnormalities in their hearts at the age of 3 months (n = 3 mice; Figure 8D).
Figure 8. Prenatal treatment with the MEK inhibitor blocks development of NS features.
(A) H&E-stained sections of hearts from PD0325901-treated mice at P2. The asterisk indicates ASD. Top panel, original magnification, ×20. Bottom panel, original magnification, ×4. (B) Immunoblot showing effects of PD0325901 treatment on Erk1/2 and Stat3 activation. (C) H&E-stained section of a PD0325901-treated Sos1EK/EK mouse that died at P14. Note ASD (arrow), hypertrophic right ventricle wall (asterisk), and dilated epicardial vessels (arrowhead). (D) Representative sections of heart tissue of 3-month-old Sos1EK/EK mice with or without PD0325901 treatment. H&E-stained sections showing AS in the untreated mice (black arrowhead; row 1, original magnification, ×10). Masson Trichrome–stained sections showing fibrosis in untreated mice (rows 2–4). Note blue collagen staining (blue arrow) in left ventricular epicardium (row 2, original magnification, ×4), right atrial (RA) epicardium (row 3, original magnification, ×10), and right ventricular epicardium and myocardium (row 4, original magnification, ×10). Scale bar: 500 μm. (E) Body weight of treated and untreated male mice fit by linear regression. P < 0.01 for both PD0325901-treated Sos1+/EK mice versus PD0325901-treated WT mice and PD0325901-treated Sos1EK/EK mice versus PD0325901-treated WT mice. PD, PD0325901. (F) CT scans of treated and control mice (top row). A sagittal projection (top row) and a coronal projection (bottom row) are shown. Skull measurements are shown as in Figure 5E. *P < 0.05 when compared with WT.
The body weight of PD0325901-treated Sos1EK/EK mice increased and was comparable to either treated or untreated Sos1+/EK mice but was still lower when compared with either treated or untreated WT mice (Figure 8E). Furthermore, CT scans of the skull of the treated Sos1+/EK and Sos1EK/EK mice showed improvement of their facial dysmorphia at the age of 3 months (Figure 8F).
These data suggest that prenatal inhibition of Erk1/2 activation by the MEK inhibitor PD0325901 successfully rescued the embryonic lethality and reduced the penetrance of cardiac defects of Sos1EK/EK mice.
Discussion
We describe here what we believe to be the first mouse model for NS caused by Sos1 mutation. Analogous to that in humans, heterozygosity of this mutation leads to a number of phenotypes, such as reduced growth, facial dysmorphia, hematological defects, and cardiac hypertrophy. We observed that in the heart, Sos1EK leads to Ras activation and, importantly, Rac activation as well. In addition to increased activation of the Ras/MAPK pathway, we unexpectedly observed increased activation of Stat3. Homozygous Sos1EK mutation resulted in a severe NS phenotype, with some embryos dying as early as E10.5, whereas others were born and lived for at least 3 months. Examination of late-stage Sos1EK/EK embryos revealed a spectrum of severe cardiac abnormalities.
Distinct phenotypes of Sos1EK mice.
Our studies indicate that the phenotypes in Sos1EK mice and previous NS-associated Ptpn11D61G or other Ptpn11 mouse models were overlapping to some degree but distinguishable (38–43). First, Ptpn11D61G/D61G were completely embryonic lethal, whereas we obtained a small number of Sos1EK/EK mice (41). Second, we observed several distinct cardiac phenotypes in Sos1EK/EK mice, such as epicardial fibrosis and adipocyte infiltration, which were not detected in any of the Ptpn11 models (38–43). Third, LVH was not documented in Ptpn11 models; indeed, mice with homozygous Ptpn11D61G or heterozygous Ptpn11D61Y mutations have dilated cardiomyopathy (41, 42). By contrast, Sos1+/EK mice developed LVH and ventricular fibrosis. Although the majority of the Sos1+/EK mice with AS showed LVH, we also observed LVH in several Sos1+/EK mice without AS and with normal blood pressure.
SOS1EK mutations appeared to have selective effect on semilunar valves, whereas Ptpn11DG mice had more of an effect on atrioventricular valves. In addition, although PS is the major clinical cardiac feature of NS patients carrying SOS1 mutation, neither histological analysis nor Doppler echocardiography detected PS in our mouse model (data not shown). On the other hand, AS was observed frequently in Sos1EK/EK mice and in older Sos1+/EK mice. Finally, in addition to activation of Ras and Erk, we found that Rac and Stat3 were also activated in Sos1EK mice, which was not found in the Ptpn11 models (38–40, 44). It is possible, if not likely, that the common phenotypes observed in Sos1 and Ptpn11 models, such as growth delay, craniofacial features, hematological disorders, and some cardiac defects, were due to the enhanced Erk activation seen in both models, whereas the distinct features in the Sos1 model described above were due to the selective activation of Rac and/or Stat3.
Distinct molecular signaling in Sos1EK mice.
SOS1 not only has a RasGEF activity but can act as a RacGEF in cultured cells. These GEF activities are mediated by distinct Cdc25 homology and Dbl homology (DH) domains, respectively (45, 46), in SOS1. Rac is a key molecule in integrating diverse stimuli and transducing signals in the cardiovascular system (47). Several studies indicate that Rac activation can contribute to cardiac hypertrophy in vitro and in vivo (48–52). Our study provides the first in vivo evidence to our knowledge for Rac activation by gain-of-function Sos1 proteins under endogenous levels of expression and suggests a role for Rac activation in the pathogenesis of Sos1-associated NS. Since the E846 residue is not in the Rac-binding DH domain of the Sos1 protein, the precise mechanism of the activation of Rac needs further investigation.
Our study also suggests that Stat3 activation contributes to the cardiac defects in our mouse model. The transcription factor Stat3 participates in a wide range of physiological processes, including proliferation, apoptosis, tumor growth, and angiogenesis (26). Stat3 activation also promotes cardiomyocyte survival and hypertrophy (31). Stat3 can be activated by the G protein–coupled receptor via Rac1 (53–60). Some studies suggested that Rac1 directly binds to and regulates STAT3 (61, 62), while other studies suggested that Rac1 induces cytokine secretion that activates STAT3 (28, 29, 63). Our data suggest that Sos1EK mutation causes Rac activation and increased production of IL-6, leading to Stat3 activation in the heart.
Small-molecule treatments for Sos1EK mice.
Several studies suggest that targeting RAS/MAPK signaling might be a powerful therapeutic strategy against cardiac hypertrophy (64). Our data provide what we believe to be the first example of successful rescue of embryonic lethality and reduced penetrance of cardiac defects by prenatal treatment with a small-molecule MEK inhibitor in a NS mouse model. However, some cardiac defects still exist in the Sos1EK/EK mice, possibly because of the persistently activated Stat3. Inhibitors for Rac and/or Stat3 may be necessary to further relieve the cardiac defects in Sos1EK/EK mice. Previously, the use of the MEK inhibitor U0126 in a transgenic Ptpn11 NS mouse model during pregnancy reduced the craniofacial defects (40). Our PD0325901-treated Sos1EK mice also showed improved skull shape. The growth of the PD0325901-treated Sos1EK/EK mice was improved but not normalized. In fact, the growth of the PD0325901-treated Sos1+/EK mice remained the same as that of the untreated ones, suggesting that inhibiting Erk1/2 during pregnancy and early age might not be sufficient for normalizing the short statue in NS. Our previous studies showed that strong mutant alleles of PTPN11 cause both perinatal and postnatal growth defects, whereas others caused only postnatal defects (41, 42). Together with the present Sos1 model, our studies suggest that there is a distinct pathogenesis of these growth defects.
In summary, our data suggested that Ras and Erk1/2, as well as Rac and Stat3, are activated and may all contribute to the cardiac defects of the Sos1EK mouse models. Normalizing all of these pathways might be required for successful amelioration of the entire spectrum of observed phenotypes. Given the gene-specific differences in NS phenotypes that our mouse models have revealed (41, 42), it also is possible that distinct treatment regimes will be warranted for different NS patients based on the specific genetic mutation they carry.
Methods
Generation of Sos1 mutant mice.
All animal experiments were performed according to protocols approved by the Institutional Animal Care and Use Committee of Harvard Medical School. Briefly, the Sos1 E846K mutation was introduced by site-directed mutagenesis and subsequently incorporated into a targeting vector, with a unidirectional Cre-mediated recombination system. The targeting construct contains an inverted exon 16, with the mutation E846K flanked by 2 wloxP and 2 mloxP sites in opposite orientations in intron 17 (Figure 1A). The targeting vector was linearized and used to electroporate J1 ES cells (129Sv background). Long-range PCR was used to screen the G418-resistant clones (Figure 1A and Supplemental Figure 6). Correctly targeted ES clones were microinjected into C57BL/6 blastocysts, and the resulting chimeras were mated with ACT-FLPe transgenic mice (C57BL/6J background; The Jackson Laboratory) to delete the Neo cassette by Flp-mediated recombination. Offspring bearing the targeted locus were crossed with EIIA-Cre transgenic mice (C57BL/6J background) to obtain heterozygous mutant mice (Sos1+/EK mice), which were then backcrossed to C57BL/6J mice for an additional 4 generations and then crossed once with 129S1/SvImJ to obtain offspring that were approximately 50% C57BL/6J and 50% 129S1/SvImJ background. These offspring were then intercrossed (Sos1+/EK × Sos1+/EK) to obtain homozygous mice (Sos1EK/EK mice).
Histology.
Hearts were excised from WT and mutant mice, washed in Dulbecco’s PBS (DPBS), arrested in 1 M KCl solution, fixed in 4% paraformaldehyde in DPBS at 4°C for fewer than 16 hours, and processed for paraffin embedding. Tissues were serially sectioned (5-μM sections) in the transverse or sagittal plane. H&E staining and Masson trichrome staining were used to define cellular architecture, and sections were analyzed by an experienced cardiac pathologist who was blinded to the genotypes. Peripheral blood smears were prepared from tail blood and stained with Wright-Giemsa solution.
RT-PCR and real-time PCR.
Tissues were pretreated with RNAlater (Ambion) solution overnight at 4°C. RNA was extracted using TRIzol (Invitrogen), treated with DNase (Invitrogen), and purified by using the PureLink RNA Mini Kit (Invitrogen). RNA was subjected to SuperScript One-Step RT-PCR (Invitrogen) for specific gene amplifications or to the High-Capacity cDNA Archive Kit (ABI) to generate cDNA for real-time PCR. Messenger RNA-specific primers (Supplemental Table 3) and Power SYBR Green PCR Master Mix (ABI) were used for real-time PCR. TaqMan Gene Expression Assays for GAPDH (ABI) and TaqMan Universal PCR Master Mix (ABI) were used as controls.
Immunoblotting, GTPase activity assay, and phospho-kinase array.
Left and right ventricles or other tissues were lysed in RIPA buffer (50 mM Tris-HCl, pH 7.4; 1% NP-40; 150 mM NaCl; 0.5% sodium deoxycholate; 0.1% SDS) containing a Mini Tablet Protease Inhibitor (Roche) and phosphatase inhibitors (25 μM sodium fluoride and 50 μM sodium orthovanadate). For each sample, 80 μg protein was subjected to SDS-PAGE, followed by transfer to nitrocellulose membranes. Blots were incubated with primary antibodies at 4°C overnight and secondary antibodies for 1 hour at room temperature and then developed with Amersham ECL Plus Western Blotting Detection Reagents (GE Healthcare). To quantify Ras-GTP and Rac-GTP in cardiac lysates, Ras and Rac Activation Assay Kits (Millipore) were used according to the manufacturer’s instructions. The Phospho-Kinase Array Kit (Proteome Profiler Antibody Array, R&D Systems) was used according to the manufacturer’s instructions.
Echocardiographic studies.
Mice were anesthetized using an isoflurane vaporizer (VetEquip), and each limb was placed on the ECG leads on a Vevo Mouse Handling Table (VisualSonics Inc.) to maintain body temperature at 37°C. Chest hair was removed with depilatory cream, and transthoracic echocardiography was performed using a Vevo 770 High-Resolution In Vivo Micro-Imaging System and an RMV 707B Scanhead (VisualSonics Inc.). Heart rates were 500–550 beats per minute. Images were acquired in 2D (left parasternal long and short axes) and M-mode (left parasternal short axis). Measurements of 3 consecutive beats of M-mode tracings were averaged and used for calculating left ventricular end-diastolic diameter (LVDd), left ventricular end-systolic diameter (LVSd), and wall thickness (IVS and left ventricular posterior wall). Left ventricular fractional shortening (%) was calculated as follows: (LVDd – LVSd)/LVDd × 100. Wall thickness and LVDd were indexed for BSA to enable comparison among mice of significantly different size (25). BSA was calculated as follows (25): BSA = (BW × 9.5)2/3. For Doppler studies, to measure the aortic and pulmonary blood flow velocity, the probe was moved to a slightly higher position from the regular long and short axis positions, respectively, and the angle of the probe was adjusted until a good waveform was observed. The peak velocity was averaged from 3 consecutive waveforms. All echocardiographic measurements were done by a single experienced observer blinded to mouse genotype.
Blood pressure.
Blood pressure was measured in trained conscious mice using a Visitech BP-2000 Analysis System. Mice were kept in the restrainer on a heated device to maintain body temperature at 37°C during the measurements. The mice were “trained” to the procedure twice every day for 3 consecutive days, and data were recorded over the following 2 days. For each mouse, at least 30 readings were collected and used for statistical analysis.
CT.
CT scans were performed with the preclinical imaging eXplore Vista PET/CT machine, using 40 kVolt, 140 μAmp, and 1-shot and standard resolution (GE Healthcare). Morphometric parameters were measured using eXplore Vista CT software.
Immunohistochemistry, immunofluorescence staining, and TUNEL assay.
Tissue sections were deparaffinized, rehydrated, treated with 0.1 M citric acid (pH 6.0), and blocked with 5% normal donkey serum in PBS. Phospho-specific antibodies against ERK1/2 (Thr202/Tyr204), STAT3 (Tyr705), STAT3 (Ser727), STAT5 (Tyr694), JNK1/2 (Thr183/Tyr185), p38 (Thr180/Tyr182), and Akt (Ser473) were obtained from Cell Signaling Technology. Anti-BrdU antibody was obtained from Sigma-Aldrich. Anti-Sos1 antibody was obtained from Santa Cruz Biotechnology Inc. For immunohistochemistry, Biotin-SP–conjugated secondary antibodies (Jackson ImmunoResearch Inc.) and the VECTASTAIN Elite ABC System (Vector Laboratories) were used for detection. For immunofluorescence, Dy-Light–conjugated secondary antibodies (Jackson ImmunoResearch Inc.) were used for detection. TUNEL assays to detect apoptotic cells were performed using the In Situ Cell Death Detection Kit (Roche), according to the manufacturer’s instructions.
Flow cytometry.
Single cell suspensions from bone marrow and spleen were prepared as described previously (41) and washed in PBS containing 2% fetal bovine serum. Fc receptor-mediated binding was blocked by preincubation with anti-CD16/CD32. Aliquots of 0.5 × 10⁶ cells were stained with monoclonal antibodies specific for Mac-1 (CD11b), Gr-1, B220, CD4, and CD8 conjugated to PE, allophycocyanin (APC), or FITC. All antibodies were obtained from BD Pharmingen. Flow cytometry was performed with FACSCalibur (BD) and analyzed with FlowJo software.
Bone marrow colony-formation assays.
Myeloid colony formation by WT and mutant bone marrow cells was examined in the presence or absence of IL-3 or GM-CSF stimulation. Bone marrow cells were collected from the femurs by flushing cold PBS into the bone with a 23-gauge needle. The cell suspension was filtered though a 40-μm cell strainer. Cells were collected by centrifugation, resuspended in IMDM, seeded (105 cells/plate) in MethoCult M3234 medium (Stemcell Technologies) with IL-3 or GM-CSF at various concentrations, and colonies were enumerated after 12 days of incubation.
STAT3 reporter assay.
293T cells were transfected with pcDNA3 vector, pcDNA3-SOS1, or pcDNA3-SOS1E846K with luciferase reporters, accordingly. The Cignal STAT3 Reporter (luc) Kit (SA Biosciences) was used according to the manufacturer’s instructions. The Dual-Luciferase Reporter Assay System (Promega) was used for detecting luciferase luminescence.
Small-molecule treatment.
PD0325901 was resuspended in vehicle (0.5% hydroxypropylmethylcellulose with 0.2% Tween80) and injected i.p. (1.0 mg/kg body weight) into pregnant mice daily, beginning on gestational day 7.5 (E7.5) and continuing until P9. Vehicle-injected mice served at controls. Beginning at P10, PD0325901 or vehicle alone was injected (i.p.) directly into pups every other day, until 4 weeks after birth.
Statistics.
Continuous variables, such as ECG intervals and conduction parameters, were measured by 2 observers and summarized as the mean ± SD. Two-way ANOVA was used for comparisons among genotypes. The Fisher exact t test and 2-tailed t test with Welch’s correction were used for categorical variables. A P value of less than 0.05 was considered significant.
Supplementary Material
Acknowledgments
We thank Libin Wang, Elizabeth Sparks, Katarina Riesner, Shuyan Wang, and Erica Tworog-Dube for technical assistance. This work is supported by NIH grant CA 84301 (to R. Kucherlapati), NHLBI NIH Syscode and LeDucq Foundation (to J.G. Seidman), NIH grants CA49132 and HL083273 (to B.G. Neel), and HHMI and LeDucq Foundation (to C.E. Seidman).
Footnotes
Conflict of interest: The authors have declared that no conflict of interest exists.
Citation for this article: J Clin Invest. 2010;120(12):4353–4365. doi:10.1172/JCI43910.
References
- 1.Tidyman WE, Rauen KA. The RASopathies: developmental syndromes of Ras/MAPK pathway dysregulation. Curr Opin Genet Dev. 2009;19(3):230–236. doi: 10.1016/j.gde.2009.04.001. [DOI] [PMC free article] [PubMed] [Google Scholar]
- 2.Allanson JE. Noonan syndrome. Am J Med Genet C Semin Med Genet. 2007;145C(3):274–279. doi: 10.1002/ajmg.c.30138. [DOI] [PubMed] [Google Scholar]
- 3.Hasle H. Malignant diseases in Noonan syndrome and related disorders. Horm Res. 2009;72(suppl 2):8–14. doi: 10.1159/000243773. [DOI] [PubMed] [Google Scholar]
- 4.Choong K, Freedman MH, Chitayat D, Kelly EN, Taylor G, Zipursky A. Juvenile myelomonocytic leukemia and Noonan syndrome. J Pediatr Hematol Oncol. 1999;21(6):523–527. doi: 10.1097/00043426-199911000-00015. [DOI] [PubMed] [Google Scholar]
- 5.Tartaglia M, et al. Mutations in PTPN11, encoding the protein tyrosine phosphatase SHP-2, cause Noonan syndrome. Nat Genet. 2001;29(4):465–468. doi: 10.1038/ng772. [DOI] [PubMed] [Google Scholar]
- 6.Schubbert S, et al. Germline KRAS mutations cause Noonan syndrome. Nat Genet. 2006;38(3):331–336. doi: 10.1038/ng1748. [DOI] [PubMed] [Google Scholar]
- 7.Tartaglia M, et al. Gain-of-function SOS1 mutations cause a distinctive form of Noonan syndrome. Nat Genet. 2007;39(1):75–79. doi: 10.1038/ng1939. [DOI] [PubMed] [Google Scholar]
- 8.Roberts AE, et al. Germline gain-of-function mutations in SOS1 cause Noonan syndrome. Nat Genet. 2007;39(1):70–74. doi: 10.1038/ng1926. [DOI] [PubMed] [Google Scholar]
- 9.Razzaque MA, et al. Germline gain-of-function mutations in RAF1 cause Noonan syndrome. Nat Genet. 2007;39(8):1013–1017. doi: 10.1038/ng2078. [DOI] [PubMed] [Google Scholar]
- 10.Pandit B, et al. Gain-of-function RAF1 mutations cause Noonan and LEOPARD syndromes with hypertrophic cardiomyopathy. Nat Genet. 2007;39(8):1007–1012. doi: 10.1038/ng2073. [DOI] [PubMed] [Google Scholar]
- 11.Cirstea IC, et al. A restricted spectrum of NRAS mutations causes Noonan syndrome. Nat Genet. 2010;42(1):27–29. doi: 10.1038/ng.497. [DOI] [PMC free article] [PubMed] [Google Scholar]
- 12.Cordeddu V, et al. Mutation of SHOC2 promotes aberrant protein N-myristoylation and causes Noonan-like syndrome with loose anagen hair. Nat Genet. 2009;41(9):1022–1026. doi: 10.1038/ng.425. [DOI] [PMC free article] [PubMed] [Google Scholar]
- 13.Schubbert S, Shannon K, Bollag G. Hyperactive Ras in developmental disorders and cancer. Nat Rev Cancer. 2007;7(4):295–308. doi: 10.1038/nrc2109. [DOI] [PubMed] [Google Scholar]
- 14.Nimnual A, Bar-Sagi D. The two hats of SOS. Sci STKE. 2002;2002(145):pe36. doi: 10.1126/stke.2002.145.pe36. [DOI] [PubMed] [Google Scholar]
- 15.Rossman KL, Der CJ, Sondek J. GEF means go: turning on RHO GTPases with guanine nucleotide-exchange factors. Nat Rev Mol Cell Biol. 2005;6(2):167–180. doi: 10.1038/nrm1587. [DOI] [PubMed] [Google Scholar]
- 16.Bar-Sagi D, Hall A. Ras and Rho GTPases: a family reunion. Cell. 2000;103(2):227–238. doi: 10.1016/S0092-8674(00)00115-X. [DOI] [PubMed] [Google Scholar]
- 17.Bernards A, Settleman J. GEFs in growth factor signaling. Growth Factors. 2007;25(5):355–361. doi: 10.1080/08977190701830375. [DOI] [PubMed] [Google Scholar]
- 18.Scita G, et al. Signaling from Ras to Rac and beyond: not just a matter of GEFs. EMBO J. 2000;19(11):2393–2398. doi: 10.1093/emboj/19.11.2393. [DOI] [PMC free article] [PubMed] [Google Scholar]
- 19.Sebolt-Leopold JS, Herrera R. Targeting the mitogen-activated protein kinase cascade to treat cancer. Nat Rev Cancer. 2004;4(12):937–947. doi: 10.1038/nrc1503. [DOI] [PubMed] [Google Scholar]
- 20.Klein S, McCormick F, Levitzki A. Killing time for cancer cells. Nat Rev Cancer. 2005;5(7):573–580. doi: 10.1038/nrc1651. [DOI] [PubMed] [Google Scholar]
- 21.Gibbs JB. Anticancer drug targets: growth factors and growth factor signaling. J Clin Invest. 2000;105(1):9–13. doi: 10.1172/JCI9084. [DOI] [PMC free article] [PubMed] [Google Scholar]
- 22.Xin HB, et al. Gene trap and gene inversion methods for conditional gene inactivation in the mouse. Nucleic Acids Res. 2005;33(2):e14. doi: 10.1093/nar/gni016. [DOI] [PMC free article] [PubMed] [Google Scholar]
- 23.Lakso M, et al. Efficient in vivo manipulation of mouse genomic sequences at the zygote stage. Proc Natl Acad Sci U S A. 1996;93(12):5860–5865. doi: 10.1073/pnas.93.12.5860. [DOI] [PMC free article] [PubMed] [Google Scholar]
- 24.Savolainen SM, Foley JF, Elmore SA. Histology atlas of the developing mouse heart with emphasis on E11.5 to E18.5. Toxicol Pathol. 2009;37(4):395–414. doi: 10.1177/0192623309335060. [DOI] [PMC free article] [PubMed] [Google Scholar]
- 25.Cheung MC, et al. Body surface area prediction in normal, hypermuscular, and obese mice. J Surg Res. 2009;153(2):326–331. doi: 10.1016/j.jss.2008.05.002. [DOI] [PubMed] [Google Scholar]
- 26.Yu H, Jove R. The STATs of cancer--new molecular targets come of age. Nat Rev Cancer. 2004;4(2):97–105. doi: 10.1038/nrc1275. [DOI] [PubMed] [Google Scholar]
- 27.Zehorai E, Yao Z, Plotnikov A, Seger R. The subcellular localization of MEK and ERK--a novel nuclear translocation signal (NTS) paves a way to the nucleus. Mol Cell Endocrinol. 2010;314(2):213–220. doi: 10.1016/j.mce.2009.04.008. [DOI] [PubMed] [Google Scholar]
- 28.Faruqi TR, Gomez D, Bustelo XR, Bar-Sagi D, Reich NC. Rac1 mediates STAT3 activation by autocrine IL-6. . Proc Natl Acad Sci U S A. 2001;98(16):9014–9019. doi: 10.1073/pnas.161281298. [DOI] [PMC free article] [PubMed] [Google Scholar]
- 29.Arulanandam R, Geletu M, Feracci H, Raptis L. Activated Rac1 requires gp130 for Stat3 activation, cell proliferation and migration. Exp Cell Res. 2010;316(5):875–886. doi: 10.1016/j.yexcr.2009.10.017. [DOI] [PubMed] [Google Scholar]
- 30.Kehat I, Molkentin JD. Extracellular signal-regulated kinase 1/2 (ERK1/2) signaling in cardiac hypertrophy. Ann N Y Acad Sci. 2010;1188:96–102. doi: 10.1111/j.1749-6632.2009.05088.x. [DOI] [PMC free article] [PubMed] [Google Scholar]
- 31.Fischer P, Hilfiker-Kleiner D. Survival pathways in hypertrophy and heart failure: the gp130-STAT3 axis. Basic Res Cardiol. 2007;102(4):279–297. doi: 10.1007/s00395-007-0658-z. [DOI] [PubMed] [Google Scholar]
- 32.Rohini A, Agrawal N, Koyani CN, Singh R. Molecular targets and regulators of cardiac hypertrophy. Pharmacol Res. 2010;61(4):269–280. doi: 10.1016/j.phrs.2009.11.012. [DOI] [PubMed] [Google Scholar]
- 33.Muslin AJ. MAPK signalling in cardiovascular health and disease: molecular mechanisms and therapeutic targets. Clin Sci (Lond). 2008;115(7):203–218. doi: 10.1042/CS20070430. [DOI] [PMC free article] [PubMed] [Google Scholar]
- 34.Bain J, et al. The selectivity of protein kinase inhibitors: a further update. Biochem J. 2007;408(3):297–315. doi: 10.1042/BJ20070797. [DOI] [PMC free article] [PubMed] [Google Scholar]
- 35.Thompson N, Lyons J. Recent progress in targeting the Raf/MEK/ERK pathway with inhibitors in cancer drug discovery. Curr Opin Pharmacol. 2005;5(4):350–356. doi: 10.1016/j.coph.2005.04.007. [DOI] [PubMed] [Google Scholar]
- 36.Wang JY, Wilcoxen KM, Nomoto K, Wu S. Recent advances of MEK inhibitors and their clinical progress. Curr Top Med Chem. 2007;7(14):1364–1378. doi: 10.2174/156802607781696837. [DOI] [PubMed] [Google Scholar]
- 37.Wentz SC, et al. Targeting MEK is effective chemoprevention of hepatocellular carcinoma in TGF-alpha-transgenic mice. J Gastrointest Surg. 2008;12(1):30–37. doi: 10.1007/s11605-007-0396-4. [DOI] [PubMed] [Google Scholar]
- 38.Nakamura T, et al. Mediating ERK 1/2 signaling rescues congenital heart defects in a mouse model of Noonan syndrome. J Clin Invest. 2007;117(8):2123–2132. doi: 10.1172/JCI30756. [DOI] [PMC free article] [PubMed] [Google Scholar]
- 39.Nakamura T, Gulick J, Colbert MC, Robbins J. Protein tyrosine phosphatase activity in the neural crest is essential for normal heart and skull development. Proc Natl Acad Sci U S A. 2009;106(27):11270–11275. doi: 10.1073/pnas.0902230106. [DOI] [PMC free article] [PubMed] [Google Scholar]
- 40.Nakamura T, Gulick J, Pratt R, Robbins J. Noonan syndrome is associated with enhanced pERK activity, the repression of which can prevent craniofacial malformations. Proc Natl Acad Sci U S A. 2009;106(36):15436–15441. doi: 10.1073/pnas.0903302106. [DOI] [PMC free article] [PubMed] [Google Scholar]
- 41.Araki T, et al. Mouse model of Noonan syndrome reveals cell type- and gene dosage-dependent effects of PTPN11 mutation. Nat Med. 2004;10(8):849–857. doi: 10.1038/nm1084. [DOI] [PubMed] [Google Scholar]
- 42.Araki T, Chan G, Newbigging S, Morikawa L, Bronson RT, Neel BG. Noonan syndrome cardiac defects are caused by PTPN11 acting in endocardium to enhance endocardial-mesenchymal transformation. Proc Natl Acad Sci U S A. 2009;106(12):4736–4741. doi: 10.1073/pnas.0810053106. [DOI] [PMC free article] [PubMed] [Google Scholar]
- 43.Krenz M, Gulick J, Osinska HE, Colbert MC, Molkentin JD, Robbins J. Role of ERK1/2 signaling in congenital valve malformations in Noonan syndrome. Proc Natl Acad Sci U S A. 2008;105(48):18930–18935. doi: 10.1073/pnas.0806556105. [DOI] [PMC free article] [PubMed] [Google Scholar]
- 44.Zhang W, et al. Negative regulation of Stat3 by activating PTPN11 mutants contributes to the pathogenesis of Noonan syndrome and juvenile myelomonocytic leukemia. J Biol Chem. 2009;284(33):22353–22363. doi: 10.1074/jbc.M109.020495. [DOI] [PMC free article] [PubMed] [Google Scholar]
- 45.Nimnual AS, Yatsula BA, Bar-Sagi D. Coupling of Ras and Rac guanosine triphosphatases through the Ras exchanger Sos. Science. 1998;279(5350):560–563. doi: 10.1126/science.279.5350.560. [DOI] [PubMed] [Google Scholar]
- 46.Innocenti M, et al. Mechanisms through which Sos-1 coordinates the activation of Ras and Rac. . J Cell Biol. 2002;156(1):125–136. doi: 10.1083/jcb.200108035. [DOI] [PMC free article] [PubMed] [Google Scholar]
- 47.Gregg D, Rauscher FM, Goldschmidt-Clermont PJ. Rac regulates cardiovascular superoxide through diverse molecular interactions: more than a binary GTP switch. Am J Physiol Cell Physiol. 2003;285(4):C723–C734. doi: 10.1152/ajpcell.00230.2003. [DOI] [PubMed] [Google Scholar]
- 48.Clerk A, Sugden PH. Small guanine nucleotide-binding proteins and myocardial hypertrophy. Circ Res. 2000;86(10):1019–1023. doi: 10.1161/01.res.86.10.1019. [DOI] [PubMed] [Google Scholar]
- 49.Pracyk JB, et al. A requirement for the rac1 GTPase in the signal transduction pathway leading to cardiac myocyte hypertrophy. J Clin Invest. 1998;102(5):929–937. doi: 10.1172/JCI2552. [DOI] [PMC free article] [PubMed] [Google Scholar]
- 50.Satoh M, Ogita H, Takeshita K, Mukai Y, Kwiatkowski DJ, Liao JK. Requirement of Rac1 in the development of cardiac hypertrophy. Proc Natl Acad Sci U S A. 2006;103(19):7432–7437. doi: 10.1073/pnas.0510444103. [DOI] [PMC free article] [PubMed] [Google Scholar]
- 51.Higuchi Y, et al. The small GTP-binding protein Rac1 induces cardiac myocyte hypertrophy through the activation of apoptosis signal-regulating kinase 1 and nuclear factor-kappa B. J Biol Chem. 2003;278(23):20770–20777. doi: 10.1074/jbc.M213203200. [DOI] [PubMed] [Google Scholar]
- 52.Sussman MA, et al. Altered focal adhesion regulation correlates with cardiomyopathy in mice expressing constitutively active rac1. J Clin Invest. 2000;105(7):875–886. doi: 10.1172/JCI8497. [DOI] [PMC free article] [PubMed] [Google Scholar]
- 53.Bhat GJ, Baker KM. Cross-talk between angiotensin II and interleukin-6-induced signaling through Stat3 transcription factor. Basic Res Cardiol. 1998;93(suppl 3):26–29. doi: 10.1007/s003950050203. [DOI] [PubMed] [Google Scholar]
- 54.Marrero MB, et al. Direct stimulation of Jak/STAT pathway by the angiotensin II AT1 receptor. Nature. 1995;375(6528):247–250. doi: 10.1038/375247a0. [DOI] [PubMed] [Google Scholar]
- 55.Tsai CT, et al. Angiotensin II activates signal transducer and activators of transcription 3 via Rac1 in atrial myocytes and fibroblasts: implication for the therapeutic effect of statin in atrial structural remodeling. Circulation. 2008;117(3):344–355. doi: 10.1161/CIRCULATIONAHA.107.695346. [DOI] [PubMed] [Google Scholar]
- 56.Pan J, et al. Role of angiotensin II in activation of the JAK/STAT pathway induced by acute pressure overload in the rat heart. Circ Res. 1997;81(4):611–617. doi: 10.1161/01.res.81.4.611. [DOI] [PubMed] [Google Scholar]
- 57.Booz GW, Day JN, Baker KM. Interplay between the cardiac renin angiotensin system and JAK-STAT signaling: role in cardiac hypertrophy, ischemia/reperfusion dysfunction, and heart failure. J Mol Cell Cardiol. 2002;34(11):1443–1453. doi: 10.1006/jmcc.2002.2076. [DOI] [PubMed] [Google Scholar]
- 58.Mascareno E, Siddiqui MA. The role of Jak/STAT signaling in heart tissue renin–angiotensin system. Mol Cell Biochem. 2000;212(1–2):171–175. doi: 10.1023/A:1007157126806. [DOI] [PubMed] [Google Scholar]
- 59.Haznedaroglu IC, Arici M, Buyukasik Y. A unifying hypothesis for the renin-angiotensin system and hematopoiesis: sticking the pieces together with the JAK-STAT pathway. Med Hypotheses. 2000;54(1):80–83. doi: 10.1054/mehy.1998.0830. [DOI] [PubMed] [Google Scholar]
- 60.Kodama H, et al. Biphasic activation of the JAK/STAT pathway by angiotensin II in rat cardiomyocytes. Circ Res. 1998;82(2):244–250. doi: 10.1161/01.res.82.2.244. [DOI] [PubMed] [Google Scholar]
- 61.Horiuchi M, Cui TX, Li Z, Li JM, Nakagami H, Iwai M. Fluvastatin enhances the inhibitory effects of a selective angiotensin II type 1 receptor blocker, valsartan, on vascular neointimal formation. Circulation. 2003;107(1):106–112. doi: 10.1161/01.CIR.0000043244.13596.20. [DOI] [PubMed] [Google Scholar]
- 62.Simon AR, Vikis HG, Stewart S, Fanburg BL, Cochran BH, Guan KL. Regulation of STAT3 by direct binding to the Rac1 GTPase. Science. 2000;290(5489):144–147. doi: 10.1126/science.290.5489.144. [DOI] [PubMed] [Google Scholar]
- 63.Pelletier S, Duhamel F, Coulombe P, Popoff MR, Meloche S. Rho family GTPases are required for activation of Jak/STAT signaling by G protein-coupled receptors. Mol Cell Biol. 2003;23(4):1316–1333. doi: 10.1128/MCB.23.4.1316-1333.2003. [DOI] [PMC free article] [PubMed] [Google Scholar]
- 64.Lorenz K, Schmitt JP, Vidal M, Lohse MJ. Cardiac hypertrophy: targeting Raf/MEK/ERK1/2-signaling. Int J Biochem Cell Biol. 2009;41(12):2351–2355. doi: 10.1016/j.biocel.2009.08.002. [DOI] [PubMed] [Google Scholar]
Associated Data
This section collects any data citations, data availability statements, or supplementary materials included in this article.


