

Abstract
Recent studies of genome-wide nucleosomal organization suggest that the DNA sequence is one of the major determinants of nucleosome positioning. Although the search for underlying patterns encoded in nucleosomal DNA has been going on for about 30 years, our knowledge of these patterns still remains limited. Based on our evaluations of DNA deformation energy, we developed new scoring functions to predict nucleosome positioning. There are three principal differences between our approach and earlier studies: (i) we assume that the length of nucleosomal DNA varies from 146 to 147 bp; (ii) we consider the anisotropic flexibility of pyrimidine-purine (YR) dimeric steps in the context of their neighbors (e.g., YYRR versus RYRY); (iii) we postulate that alternating AT-rich and GC-rich motifs reflect sequence-dependent interactions between histone arginines and DNA in the minor groove. Using these functions, we analyzed 20 nucleosome positions mapped in vitro at single nucleotide resolution (including clones 601, 603, 605, the pGUB plasmid, chicken β-globin and three 5S rDNA genes). We predicted 15 of the 20 positions with 1-bp precision, and two positions with 2-bp precision. The predicted position of the ‘601’ nucleosome (i.e., the optimum of the computed score) deviates from the experimentally determined unique position by no more than 1 bp — an accuracy exceeding that of earlier predictions.
Our analysis reveals a clear heterogeneity of the nucleosomal sequences which can be divided into two groups based on the positioning ‘rules’ they follow. The sequences of one group are enriched by highly deformable YR/YYRR motifs at the minor-groove bending sites SHL ±3.5 and ±5.5, which is similar to the α-satellite sequence used in most crystallized nucleosomes. Apparently, the positioning of these nucleosomes is determined by the interactions between histones H2A/H2B and the terminal parts of nucleosomal DNA. In the other group (that includes the ‘601’ clone) the same YR/YYRR motifs occur predominantly at the sites SHL ±1.5. The interaction between the H3/H4 tetramer and the central part of the nucleosomal DNA is likely to be responsible for the positioning of nucleosomes of this group, and the DNA trajectory in these nucleosomes may differ in detail from the published structures.
Thus, from the stereochemical perspective, the in vitro nucleosomes studied here follow either an X-ray-like pattern (with strong deformations in the terminal parts of nucleosomal DNA), or an alternative pattern (with the deformations occurring predominantly in the central part of the nucleosomal DNA). The results presented here may be useful for genome-wide classification of nucleosomes, linking together structural and thermodynamic characteristics of nucleosomes with the underlying DNA sequence patterns guiding their positions.
Keywords: nucleosome, nucleosome positioning, DNA bending, DNA sequence patterns, DNA kinks
Introduction
Nucleosomes play a crucial role in gene regulation in eukaryotes by modulating the access of transcriptional machinery to DNA (1). Therefore, understanding the molecular mechanisms involved in controlling nucleosome positions has become a central issue in chromatin biology. Recent genome-wide data on in vivo (2-9) and in vitro (10, 11) nucleosome organization reveal numerous factors influencing the exact placement of nucleosomes along DNA, such as DNA sequence patterns, DNA methylation, histone variants, histone post-translational modifications, higher-order chromatin structure, chromatin remodeling and interactions with non-histone DNA-binding proteins. The general view is that the in vivo data is the result of concerted interactions among all these factors, while the in vitro data reflects the intrinsic DNA sequence preference for nucleosomes. Although the quest for sequence patterns guiding nucleosome positioning started 30 years ago, our knowledge of these patterns still remains limited.
It has been known for years that certain sequence motifs usually occur at particular sites within a nucleosome, constituting characteristic patterns (for review see ref. 12). The initial breakthrough was made by Trifonov and Sussman (13), who observed periodic AA:TT oscillation in genomic sequences and postulated that it is critical for stabilization of nucleosomes. Since then, various sequence patterns have been suggested to be essential for DNA bending and packaging in chromatin (12, 14-16), including periodically oscillating GG:CC dinucleotides (17, 18).
After it became clear how tightly DNA is packed in nucleosomes, the concept of anisotropic bending of DNA was introduced (19-22). This implies that bending across the grooves (in the Tilt direction) is much less pronounced than bending into the grooves (in the Roll direction) (Figure 1). The variation of Tilt is hindered by the base-base stacking interactions between the base pairs and stereochemical constraints of the backbone. This feature, first predicted by energy calculations (22), was later confirmed once a large number of free DNA fragments and protein-DNA complexes had been crystallized (23-25).
Figure 1.
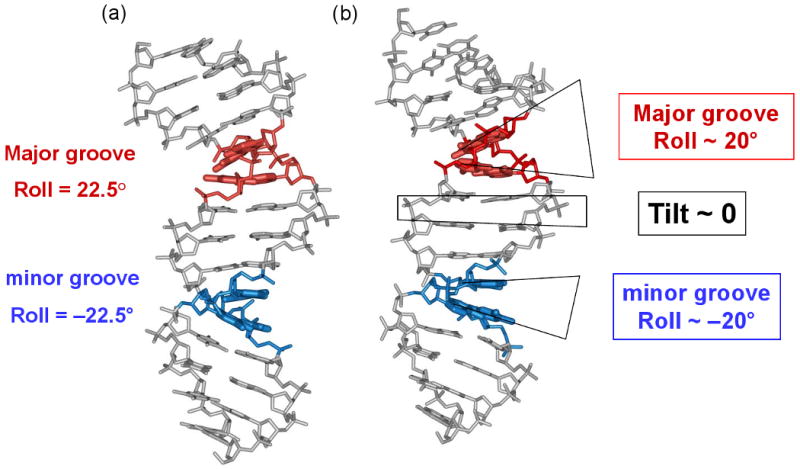
Comparison of the “mini-kink” model for nucleosomal DNA bending (22, 38), (a), and the crystallographic structure of a nucleosome (54), (b). (a) According to the model, bends into the major and minor grooves occur predominantly at the YR (red) and RY (blue) dimers, respectively. (b) Directionality and extent of the DNA bending in the nucleosomal X-ray structure (54) are generally consistent with the earlier model shown in (a). The DNA fragment shown corresponds to the superhelical locations SHL −4 and −3.5 in the X-ray structure 1KX3 (54). The color coding is the same as in (a): red for positive Roll (bending into the major groove) and blue for negative Roll (bending into the minor groove). The actual Roll values are about ±15-20°, which is close to ±22.5° estimated by the “mini-kink” model (22, 38).
DNA anisotropy is sequence-dependent: overall, the purine-pyrimidine (RY) dimers bend predominantly into the minor groove, whereas the pyrimidine-purine (YR) dimers bend more frequently toward the major groove (26, 27). Historically, this rule originates from Calladine's (28) steric clash model, which was used to rationalize the alternation of positive and negative Roll in the CG and GC steps, respectively, in the Dickerson-Drew dodecamer (29). Despite its simplicity, the YR/RY rule still holds for numerous B-DNA and protein-DNA crystal structures (for review see ref. 30). This YR/RY rule was implemented to predict nucleosome positioning in the early DNA sequence ‘threading’ studies (31-33).
In addition to the RY and YR steps, there are two other sets of sequence patterns whose bending anisotropy is well established. These are the AT-rich (WW/WWW) and the GC-rich (SS/SSS) dimeric and trimeric motifs, originally identified in the pioneering work of Travers and colleagues, who characterized the nucleosome core particle (NCP) DNA fragments obtained from chicken erythrocytes (34). Later, the alternating AT-rich and GC-rich patterns (localized at the sites of the minor- and major-groove bending of nucleosomal DNA, respectively) were detected in nucleosomes of yeast (3, 7), the fruit fly (9) and the nematode (4). The stereochemical explanation for why AT-rich fragments usually bend into the minor groove, toward the histone core, is related to the favorable electrostatic interactions between the AT-rich DNA and the histone arginines penetrating into the minor groove (35-37).
The YR dimers deserve special attention. In addition to being the most anisotropic dimers (their equilibrium Roll angles have the largest absolute values), they are also the most flexible of all the dimeric steps (27, 30, 38-40). The bending and ‘bendability’ of YR steps in the crystal structures of DNA duplexes (41-43) have been thoroughly analyzed and compared with those derived from the NCP fragments (3, 34, 44, 45). Several interesting features have been observed, in particular, for the TA and CA:TG steps.
For example, the central TA step in the decamer CCTTTAAAGG crystal structure bends toward the major groove of DNA (41, 42, 46). Energy computations (38) and various models for DNA bending in solution (15, 30, 47) also suggest the major-groove bending of the TA step (at least, in the TTAA context). However, sequence analysis of chicken (34) and yeast (3) nucleosomes indicates that the TA dimer usually occurs at the sites where DNA bends into the minor groove. Accordingly, the TTAA motif is frequently found at the minor-groove bending sites of the synthetic high affinity sequences, including the TG-pentamer (48) and the ‘601’ clone (49, 50) — especially at the sites SHL ±1.5. Thus, we see that the TA step demonstrates a certain ‘dualism’ (or bistability). In solution and in numerous crystal structures (including the well-known complex of the TATA box with TBP (51)) it bends into the major groove, while in nucleosomes, the TA step bends preferentially into the minor groove.
The other pyrimidine-purine dimer, CA:TG, has also been known to be bistable for decades. In 1989, Heinemann and Alings (52) noted that CA:TG reveals an ‘unusual’ conformation with a negative Roll in the crystallized decamer CCAGGCCTGG. This observation has been further substantiated by Dickerson and colleagues (41) who formulated the ‘YCAR/RCAY’ rule — namely, that CA bends into the minor groove in the context YCAR (this conformation was denoted High Twist Profile, or HTP), while in the context RCAY, the CA step bends into the major groove (Low Twist Profile, or LTP conformation). Note that the CA:TG dimer reveals clear bistability in the nucleosomal structures. It bends into the major groove in the chicken NCPs analyzed by Satchwell et al. (34), and into the minor groove in the nucleosomes crystallized with the α-satellite sequence (53, 54). In the latter case, the CA:TG dimer attains the HTP conformation according to the classification described above (41), or belongs to the CA− substate according to the notation used by Olson et al. (26).
Recently, Tolstorukov et al. (35) demonstrated that in addition to anistropic bending, the nucleosomal DNA undergoes severe lateral displacements, or Slide, especially at the minor-groove kinks. These ‘Kink-and-Slide’ distortions are highly sequence-specific, being most favorable for the CA:TG and TA dimers, which is critical for the nucleosome positioning (see also ref. 55). The all-atom computations (56) generally confirmed this sequence dependence: the ‘Kink-and-Slide’ deformation energy of DNA increases in the order TA < CA:TG < CG < GC. These studies (35, 56) taken together provide a detailed stereochemical explanation for why the YR dimers demonstrate the bistability described above, and why the TA and CA:TG steps prefer the ‘Kink-and-Slide’ deformations observed in nucleosomes (53, 54). Based on these results, we modified the earlier ‘mini-kink’ model of DNA bending (31-33, 38) postulating that the YR dimers bend only into the major groove. Now we assume that the YR steps can bend into both grooves, the TA and CA being the most favorable for minor-groove bending (see Methods). Furthermore, we extended the ‘YCAR/RCAY’ rule formulated by Dickerson (41) and applied it to the other YR steps as well — that is, we assumed that in the context YYRR, the YR dimer usually bends into the minor groove, while in the context RYRY, it bends into the major groove. Although this ‘extended’ YYRR rule remains tentative (for a while), it is supported by the results presented in this issue by Wang et al. (56): the TA and CG steps are more likely to bend into the minor groove in the contexts TTAA and CCGG, compared to ATAT and GCGC.
The GC step is yet another dimer whose DNA bending is demonstrably context-dependent. According to x-ray data, GC bends into the minor groove in the context CGCG (29, 57), whereas in the GGCC context, it bends into the major groove (58). Therefore, despite the fact that the GC dimer most frequently occurs at the predicted major-groove bending sites in both the chicken and yeast NCP sequences (3, 34), one also has to consider the alternative possibility — namely, the bending of GC into the minor groove, especially because this directionality of GC bending is predominant in the high-resolution nucleosomal structure 1KX5 (54). Out of eight GC dimers, six have negative Roll — that is, these six dimers are bent into the minor groove, with the average Roll = −6.3° (data computed with CompDNA/3DNA software (26, 59)).
In this study, we used the best established ‘canonical’ sequence patterns (YR, WW/WWW and SS/SSS) in a simple computation scheme, with the aim of detecting the DNA sequence features responsible for positioning of 20 nucleosomes mapped in vitro at single-nucleotide resolution (Table I). Using these ‘canonical’ patterns, we correctly predicted approximately half of the 20 positions, including the highly stable ‘601’ nucleosome (49). To account for the remaining nucleosome positions, we incorporated in our scheme several ‘alternative’ patterns such as YYRR, RYRY and GC, and found that they indeed improved the agreement with experimental data. The scheme was further ‘fine-tuned’ by optimizing the weights for the ‘canonical’ and ‘alternative’ patterns using a minimization protocol. The physical meaning of our nucleosome positioning score is straightforward – the lower the DNA deformation energy for particular sequence motifs placed at the sites of DNA distortion, the higher the score.
Table I.
High-resolution nucleosome positions analyzed in this study.
| Number | Nucleosome positioning fragment | Experimental dyad position | GC (%) | Group | Agreement | Reference |
|---|---|---|---|---|---|---|
| 1 | ‘601’ | 134 | 56 | I | + | (50, 60) |
| 2 | ‘603’ | 153 | 57 | I | Δ2 | ″ |
| 3 | ‘605’ | 131 | 55 | I | + | ″ |
| 4 | X. borealis somatic 5S rDNA | −24 | 61 | II | + | (66) |
| 5 | ″ | −3 | 62 | I | + | ″ |
| 6 | ″ | +7 | 61 | I | + | ″ |
| 7 | ″ | +48 | 58 | I | + | ″ |
| 8 | ″ | +58 | 57 | I | + | ″ |
| 9 | X. borealis oocyte 5S rDNA | −2 | 52 | II | + | (66) |
| 10 | ″ | +20 | 54 | II | Δ3 | ″ |
| 11 | ″ | +34 | 56 | III | − | ″ |
| 12 | ″ | +58 | 56 | I | + | ″ |
| 13 | Sea urchin 5S rDNA | −11/−12 | 44 | II | + | (65) |
| 14 | ″ | +8 | 46 | I | + | ″ |
| 15 | Chicken βA-globin | −281 | 62 | II | + | (61) |
| 16 | MMTV | −127 | 35 | III | − | (67) |
| 17 | ″ | +70 | 57 | II | Δ2 | ″ |
| 18 | pGUB | 84 | 54 | II | + | (68) |
| 19 | ″ | 104 | 52 | II | + | ″ |
| 20 | Fragment 67 | 113 | 51 | II | + | (62) |
GC (%): GC content of the 147-bp fragment with the center at the indicated dyad position.
Group: Assignment of the nucleosome positions to the three Groups is based on the extent of agreement between the experimental data and the prediction based on the ‘canonical’ positioning patterns (Set 1 in Table SIII).
Group I: the experimental dyad is close to a ‘strong’ peak of the computed nucleosome positioning score (the peak that is higher than its neighbors within ±7 bp interval, with discrepancy not exceeding 1 bp).
Group II: the dyad is close to a ‘weak’ peak (lower than its highest neighbors within ±7 bp interval).
Group III: the dyad corresponds to a minimum of the computed positioning score.
Agreement: The extent of agreement between the experimental data and the predictions using optimized weights (Sets 3 and 4 in Table SIII; see also Figure 6).
‘+’ indicates that the discrepancy between the predicted maximal score and experimental dyad position does not exceed 1 bp.
Δ2 and Δ3 represent the 2 bp and 3 bp discrepancies, respectively.
‘−’ indicates that the predicted and experimental positions are separated by 5-6 bp (that is, by a half helical turn of DNA duplex).
We wish to emphasize that our aim is to predict both rotational and translational positioning of nucleosomes; finding correct ‘orientation phasing’ of DNA with respect to the histone core is not sufficient, in our opinion. If, for example, the computed positioning score has a local maximum coinciding with the experiment, but the global maximum is shifted by 10 bp (60), we consider the error to be 10 bp. As mentioned earlier (35, 55), the correct translational positioning can be predicted only if the DNA distortion in nucleosome is considered to be non-uniform, as observed in the crystal structures (37, 53, 54). In particular, the DNA deformation in the superhelical locations SHL ±3.5 and ±5.5 is more severe than in SHL ±0.5 and ±2.5 (Figure 2). (Paraphrasing George Orwell, “Some kinks are more equal than others.”) Therefore, we assigned different weights to different DNA bending sites. Furthermore, we introduced a special function evaluating the difference between the score value in the immediate vicinity of the experimental position (±1 bp) and in the adjacent regions (±17 bp). Optimizing this function, we found the positioning scores that adequately describe various sets of nucleosomes mapped in vitro.
Figure 2.
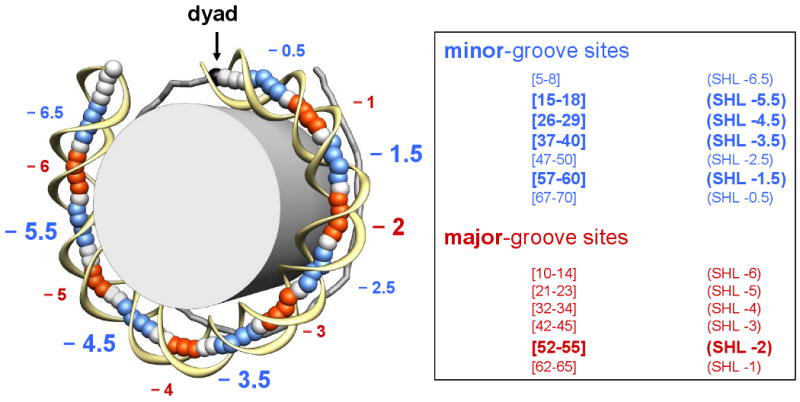
Locations of the minor- and major-groove bending sites. (Left) The crystal structure of the 1KX5 nucleosome with 147-bp long DNA (54) shown schematically: the DNA fragment is divided into two halves, separated by the dyad (black ball and arrow). The base-pair centers in the ‘anterior’ half are represented by large balls, and the sugar-phosphate backbone is shown by a yellow ribbon. For the ‘posterior’ half of the nucleosome, the base-pair centers are connected by sticks. The fragments whose minor grooves face the histone octamer (grey cylinder) are colored in blue (minor-groove bending sites), while the fragments whose minor grooves face away from the histone are colored in red (major-groove bending sites). The minor- and major-groove sites are defined based on the Roll values of the 147-bp core DNA, shown in Figure S1. (Right) The exact location for each site in the ‘anterior’ half is given, which is symmetric to the corresponding site in the ‘posterior’ half with respect to position 74 (for the 147-bp template) or position 73.5 (for the 146-bp template). The sites with the highest Roll values (‘critical sites’) are indicated by larger letters (superhelical locations SHL −1.5, −2, −3.5, and −5.5).
Our results suggest that the selected in vitro nucleosomes are naturally divided into two groups based on the sequence patterns guiding their positioning. One group is characterized by frequent occurrence of the highly deformable YR/YYRR motifs at the sites SHL ±3.5 and ±5.5, apparently facilitating severe DNA deformations at the sites, similar to the ‘Kinks-and-Slides’ found in the majority of nucleosomes crystallized so far. Accordingly, the positioning of these nucleosomes is likely to be determined by the interactions between histones H2A/H2B and the terminal parts of nucleosomal DNA.
In the other group (that includes the ‘601’ clone) the same YR/YYRR motifs occur predominantly at the sites SHL ±1.5 that are believed to be critical to nucleosome positioning (49). The DNA trajectory in these nucleosomes may differ in detail from published structures. The interaction between the H3/H4 tetramer and the central part of nucleosomal DNA is likely to be responsible for the positioning of nucleosomes of this group.
We anticipate that in the near future, our results on the DNA sequence-structure relationship may help elucidating structural and thermodynamic characteristics determining functionally important features of nucleosomes, such as their responsiveness (or resistance) to chromatin rearrangements during transcription and other cellular processes.
Materials and Methods
Datasets
A total of 20 reconstituted nucleosome positions were precisely mapped in vitro (Table I). These positions can be divided into two sets based on the mapping techniques employed. The first set includes five nucleosomes: ‘601’, ‘603’, ‘605’ (49, 50), the nucleosome 5A in the chicken β-globinA gene (61), and Fragment 67 (62). The positions of the ‘601’, ‘603’ and ‘605’ nucleosomes were determined by hydroxyl radical footprinting experiments (60, 63), while the other two nucleosome positions were obtained using three DNA cleavage enzymes: micrococcal nuclease (MNase), DNase I and exonuclease III (61, 62, 64). Both approaches can easily determine the rotational phase of DNA wrapped around histones and the dyad position of a nucleosome by analysis of the nucleolytic digestion pattern of DNA. In addition, the position of nucleosome ‘601’ was determined using the site-directed hydroxyl radical method (A. Travers, personal communication). Since the two positions of the ‘601’ nucleosome (obtained by two different methods) coincide, we assume that positions of the other nucleosomes mentioned above are also established rather precisely.
The second set contains 15 nucleosome positions on the sea urchin 5S rDNA gene (65), the X. borealis somatic and oocyte 5S rDNA genes (66), as well as MMTV (67) and pGUB (68) sequences. These positions were mapped at single base-pair resolution by the site-directed hydroxyl radical method (65). This differs from the free solution hydroxyl radical approach in two respects. First, a photochemical reagent (EDTAcyst) is linked to modified residues on the surface of the histone octamer, close to DNA near the pseudodyad axis of the nucleosome. Second, the hydroxyl radicals generated from the reagent are directed to attack each DNA strand close to the dyad axis. Analysis of the DNA mapping pattern on denaturing PAGE can precisely determine the position of the dyad.
Note that for the X. borealis somatic rDNA gene, six nucleosome positions were detected with the dyad at −44, −24, −3, +7, +48, and +58 relative to transcription start-site (+1), while for the X. borealis oocyte rDNA gene, five positions with the dyad at −2, +20, +34, +58 and +80 were found, before incubation with TFIIIA (66). The positions at −44 for the somatic 5S rDNA and +80 for the oocyte 5S rDNA were not included in our list (Table I) because they are too close to the ends of DNA fragments used in nucleosome reconstitution (the distances between the dyads and the DNA ends are less than 73 bp).
Nucleosome positioning score
We analyzed a series of 28 DNA sequence patterns occurring at discrete regions (‘sites’) of the nucleosome where DNA bends anisotropically into the grooves. Below, we describe how these sites are defined for the 147-bp and 146-bp nucleosomal templates and how the scores are calculated for the dimeric (YR, WW, SS, GC), trimeric (WWW, SSS) or tetrameric (YYRR, RYRY) patterns. The scores calculated for the 147-bp and 146-bp templates were combined together, to provide a greater flexibility to the process of predicting nucleosome positioning. The resulting profiles obtained for individual sequence patterns were summed up with the pre-determined or optimized weights.
(a) Computing the scores for sequence patterns at minor- and major-groove sites
The score for a sequence pattern is defined as the sum of occurrences of certain motifs at the specific sites. The 14 regions of minor-groove DNA bending (minor sites) and the 12 areas of major-groove bending (major sites) were selected based on the Roll values observed in the nucleosomal structures 1KX5, 1KX3 and 1KX4 (Figure S1). The positions of these sites are given in Figure 2, both for the 147-bp and 146-bp templates. Note that the major sites SHL ±4 and ±5 are 3 bp in length; all the remaining sites (including 14 minor sites) are 4 bp long.
Let us take, for an example, the YR sequence pattern. For a nucleosomal fragment with the center at position n, the score S(n) for the pattern YR at the 14 minor sites is the sum of the counts Cx for the contributing motifs (x = TA, CA, TG or CG) occurring at these 14 sites, and is defined as
where CTA = CCA = CTG =1 and CCG = 0.5. If two YR dimers occur at the same site, say, CACG in SHL −5.5, the higher of the two counts is used (in this case Cx = CCA = 1). If there is no YR dimer at a given site, Cx = 0. Similarly, for the pattern YR at the major sites, the pattern score S(n) is the sum of 12 counts Cx, where CCG = CCA = CTG =1 and CTA = 0.5.
We assigned different coefficients (counts) to the TA and CG dimers occurring at the minor and major sites to reflect their preference for bending into the minor and major grooves, respectively (see Introduction). To be consistent, we assigned different counts to the tetramers YTAR (Cx = 1) and YCGR (Cx = 0.5) occurring at the minor sites, and to the tetramers RTAY (Cx = 0.5) and RCGY (Cx = 1) occurring at the major sites (see Table SII for details). For the other sequence patterns such as WW, SS, WWW, SSS and GC, the counts for the contributing motifs are the same (Cx = 1). Note that when we count the GC dimers occurring at the minor sites, we consider only those cases when there is no YA:TR dimer (e.g., TA or CA:TG) at a given minor site.
(b) Dimers versus trimers and tetramers
The pattern scores for dimers such as YR, WW, SS and GC are computed differently from those for trimers and tetramers such as WWW, SSS, YYRR and RYRY. Let us take as an example the 4-bp site SHL −5.5 covering positions 15-18 (Figure 2). When computing the WW score for this site, we consider three dimeric steps: 15-16, 16-17 and 17-18. If two or three WW dimers occur in the site, the count is the same as for one WW. In other words, the occurrences of WW at the same site are considered to be non-additive. The same holds for the other dimeric motifs.
When computing the WWW score, we count occurrences of the WWW trimers at the minor sites extended by 1 bp in both directions. For example, in the case of the site SHL −5.5, we consider the four trimers with centers at positions 15, 16, 17 or 18. (Accordingly, when counting the YYRR motifs, we consider the three consecutive tetrameric positions: 14-17, 15-18 and 16-19.) As with the WW dimers, the WWW trimers occurring at the same site are non-additive; that is, the scores for WWWW and for WWW are the same.
On the other hand, the WW and WWW scores (or SS and SSS scores) are additive; if the sequence CAAT occurs at the 4-bp long minor site, it is counted both as WW and WWW. This approach is consistent with the idea that a ‘long’ AT-rich fragment is more advantageous (compared to a single WW dimer) for interaction with the histone arginine penetrating into the minor groove, and for DNA bending in this direction (35, 37).
(c) Threading of patterns and summing up individual pattern profiles
A given pattern (for example, the YR pattern) is moved along the sequence of interest, one base pair at a time. A pattern score is generated for each position of the nucleosomal fragment; as a result, the YR ‘profile’ is obtained for the selected sequence. (This procedure is often called ‘threading’ – see, for example (35, 55, 69).) Next, the profiles obtained for different sequence patterns are summed up as follows. For each nucleosomal fragment centered at position n, the total score f(n) is defined as
where Si(n) is the score for the ith pattern and wi is the weight for this pattern.
The weights for 28 sequence patterns are either pre-determined (see Sets 1 and 2 in Table SIII), or optimized (see below). Note that the weights for the ‘critical’ sites SHL ±5.5, ±4.5, ±3.5, ±2 and ±1.5 are twice as large as those for the other sites (see ‘Other’ in Table II). This is because these sites are characterized by large Roll and/or Slide absolute values, and the Roll-and-Slide deformations of DNA have been shown to be important for nucleosome positioning (35).
Table II.
Optimized weights of the sequence patterns for Groups I, II, and III.
| Pattern (SHL) | Groups I & II (18) | Group I (9) | Group II (9) | Group III (2) | |
|---|---|---|---|---|---|
| MMTV (-127) | 5S oocyte (+34) | ||||
| minor YR/YYRR (±5.5, ±3.5) | 2.0 | 0.5 | 2.0 | 0.9 | 0.0 |
| minor YR/YYRR (±4.5) | 1.5 | 2.0 | 0.1 | 1.0 | 1.5 |
| minor YR/YYRR (±1.5) | 2.0 | 2.0 | 0.8 | 0.0 | 0.0 |
| minor YR/YYRR (other) | 0.1 | 0.0 | 0.7 | 1.8 | 0.0 |
| minor WW/WWW (±5.5, ±3.5) | 0.0 | 0.1 | 0.0 | 1.0 | 0.1 |
| minor WW/WWW (±4.5) | 0.8 | 0.7 | 0.5 | 0.0 | 1.6 |
| minor WW/WWW (±1.5) | 1.5 | 2.0 | 0.2 | 1.8 | 1.4 |
| minor WW/WWW (other) | 0.5 | 0.5 | 0.5 | 1.3 | 0.4 |
| minor GC (±5.5, ±3.5) | 0.8 | 0.0 | 0.6 | 0.5 | 0.9 |
| minor GC (±4.5) | 1.9 | 1.7 | 1.2 | 0.3 | 0.3 |
| minor GC (±1.5) | 0.4 | 0.2 | 0.0 | 0.2 | 0.9 |
| minor GC (other) | 1.6 | 0.2 | 1.9 | 0.3 | 0.9 |
| Major YR (±2) | 0.0 | 2.0 | 0.0 | 0.7 | 2.0 |
| Major YR (other) | 0.0 | 0.0 | 0.6 | 2.0 | 2.0 |
| Major RYRY (±2) | 0.2 | 2.0 | 0.0 | 0.5 | 2.0 |
| Major RYRY (other) | 2.0 | 0.3 | 1.9 | 1.4 | 0.4 |
| Major SS/SSS (±2) | 1.2 | 1.8 | 0.8 | 2.0 | 1.6 |
| Major SS/SSS (other) | 0.1 | 0.6 | 0.2 | 0.0 | 0.0 |
Pattern (SHL): The ‘critical’ positions of the minor and major-groove sites are shown in parentheses (see Figure 2 for details).
During optimization, the 28 sequence patterns were combined in 18 subsets (see Methods). The weights of the patterns changed from 0 to 2. For the Groups I and II, the optimized weight values that are equal to 1 or higher are in bold. The values in bold that differentiate between the two Groups are underlined.
(d) Combining profiles for the 147-bp and 146-bp nucleosomal templates
In this study, we combined profiles the for 147-bp and 146-bp templates in the following way. For the nucleosomal fragments starting at position i of the DNA sequence, the threading score is ascribed to position i+74 (for the 147-bp template) or to position i+73.5 (for the 146-bp template). As a result, we have two sets of scores, one set for the integer and one set for the half-integer positions. Next, for each integer k, we compare the f(n) values for n = k and k±0.5. The highest of the three values is assigned to the middle point, k. The resulting ‘147/146-bp profile’ is compared with the experimentally detected position of the nucleosome.
(e) Optimizing pattern weights
A minimization procedure was developed to optimize the weights of the patterns, with the aim of maximizing the difference between the highest threading score f(n) in the ‘vicinity’ of the experimental positions of nucleosomes, and the highest score in the ‘neighboring regions’ (see below). In other words, we allowed a certain discrepancy (1-2 bp) between the predicted and experimental positions of nucleosomes, reflecting the limited precision of mapping experiments and our predictions.
Let us assume that the experimentally determined dyad of a nucleosome is located in position k. Then, the interval [k−1, k+1] is denoted as the ‘vicinity’ of the dyad, and the ‘neighboring regions’ are defined as the intervals [k−17, k−2] and [k+2, k+17]. Our aim is to maximize the difference between the two values: max(dyad) = max(f(k−1), f(k), f(k+1)) and max(background) = max(f(k−17), f(k−16), … f(k−2), f(k+2), … f(k+16), f(k+17)).
To this aim, we minimized the function F defined as follows:
| delta = max(dyad) − max(background) |
| if (delta < X) then |
| F = F − 10 × (delta) |
| else |
| F = F − 10 × X − (delta) + X. |
The X value was arbitrarily selected as 3.
The function F was minimized using a standard minimization procedure, to obtain a set of weights wi (i = 1 to 28), corresponding to the minimal value of F. The resulting weights were considered to be the ‘optimal fit’ for a selected set of nucleosome positions.
Since the number of sequence patterns considered in this study, 28, exceeds the number of the sequences in our dataset, 20 (Table I), we grouped certain patterns together by giving them the same weights during minimization. For example, the patterns YR and YYRR in positions SHL ±5.5 and ±3.5 were assigned the same weights (see Table II). As a result, we used 18 independent variables in the course of minimization.
Results and Discussion
‘Canonical’ sequence patterns observed in the in vitro nucleosomal fragments
Twenty nucleosome positions mapped at high resolution (Table I) were selected from the literature and the corresponding 147-bp fragments were aligned with the experimental dyad positions (marked in Table SI). As shown in Figure 3a, variation in the combined occurrence of the AT-rich WW dimers (AA:TT + AT + TA) follows a well-known sinusoidal pattern (3, 34), with the peaks separated by ∼10 bp, between positions 10 and 70. In particular, the most pronounced peaks at positions 38, 48 and 58-59 are observed in the sites where nucleosomal DNA is bent into the minor groove (SHL ±3.5, ±2.5 and ±1.5, see Figure 2). For the GC-rich SS dimers (GG:CC + GC + CG) the pattern is relatively weak with strong peaks only occurring at positions 33-34, 42 and 53-54, clearly in the predicted major-groove bending sites (SHL ±4, ±3 and ±2, Figure 2). This is consistent with earlier observations made for the chicken (34) and yeast (3) NCP fragments – namely, that the AT-rich dimers are more numerous at sites where DNA bends into the minor groove, while the GC-rich fragments are frequently found at sites where DNA is bent toward the major groove.
Figure 3.

Positioning of the WW (AA:TT + AT + TA), SS (GG:CC + GC + CG) and YR (CA:TG + TA + CG) dimers in the 20 nucleosome sequences, each 147 bp in length (Table I). (a-c) Combined frequencies of occurrence for the three sets of dimers ‘symmetrized’ with respect to the dyad at base-pair step 73.5 (vertical dashed lines).
(d-f) The distance autocorrelation function, P(n), represents the frequency of occurrence of two dimers from the same set (e.g., WW, SS or YR) with the distance n between them (70). Complete 147-bp fragments in both strands were used to calculate this function. The raw data are shown in thin lines and the 3-point averages are in thick lines (blue for WW, and red for SS). Note that this color coding is the same as in Figure 1, because the WW and SS dimers preferentially occur at the sites where DNA bends into the minor and major grooves, respectively (3, 34).
The periodicity of occurrence of the WW and SS dimers were calculated using the auto-correlation function P(n) (70). The maxima of this function observed at n = 10-11 (Figures 3d-e), indicate a clear ∼10-bp periodicity of the nucleosomal sequences. In other words, the WW and SS dimers are most frequently separated by a helical turn of the DNA duplex (in agreement with the ‘canonical’ periodicity observed in genomic sequences (13)). On the other hand, variation in the combined frequency of the YR dimers (CA:TG + TA + CG) is more ‘noisy’ in the sense that the peaks occur at least twice every 10 bp (Figure 3c). The auto-correlation function for the YR dimers has peaks at n = 6 and 10, which indicates a periodicity of ∼5-bp (Figure 3f). This means that the YR dimers are predominantly separated by a half-helical turn of the DNA duplex, apparently reflecting the flexible nature of these dimers, which can easily bend into both the minor and major grooves under certain conditions. In addition, the TA dimer mostly occurs at minor groove sites, while CG is frequently found at major groove sites (data not shown). This is in accord with the elastic energy (35, 55) and all-atom energy calculations (56) suggesting that the deformation energy required to stabilize the minor-groove ‘Kink-and-Slide’ conformation is significantly less for a TA dimer compared to CG.
Next, we compared the periodic occurrence of AT-rich dimers (Figure 3a) with those derived from the chicken (34) and yeast (3) NCP sequences. Interestingly, the profile presented in Figure 3a is similar to the profile observed for the yeast nucleosomes, but differs from the profile for the chicken NCPs (71). Namely, the chicken sequences (34) are characterized by a reversal in the phase of the AT-rich ‘signal’ (between position 60 and the dyad), whereas this does not occur in either the yeast sequences (3) or the nucleosomes mapped in vitro (Figure 3a). Since the linker histone (LH) is abundant in chicken but rare in yeast, we had hypothesized earlier that this phase reversal could be related to LH binding (71). The fact that the LH-related ‘signal’ is absent in the in vitro nucleosomes supports our hypothesis, because LH was not present during in vitro reconstitution.
Overall, we see that the nucleosomes selected in vitro follow the ‘canonical’ nucleosome positioning patterns that are derived from the crystal structures of DNA and DNA-protein complexes, the NCP sequences from chicken and yeast, and theoretical calculations. The precise mapping of in vitro reconstituted nucleosomes makes them a unique set of sequences suitable for testing various predictive sequence patterns.
Nucleosome heterogeneity revealed by ‘canonical’ positioning patterns
To determine whether the aforementioned ‘canonical’ positioning patterns (YR and alternating AT- and GC-rich patterns) are sufficient to account for the 20 nucleosome positions, we developed a scheme incorporating these and other patterns (see Methods). The ‘canonical’ sequence patterns include the YR dimers at the minor- and major-groove bending sites, the WW and WWW motifs at the minor sites, and the SS and SSS motifs at the major sites. The motifs occurring at the ‘critical’ sites characterized by large absolute values of Roll and/or Slide (SHL ±5.5, ±4.5, ±3.5, ±2 and ±1.5), are assigned weights twice as high as the weights for the other sites (see Set 1 in Table SIII).
The positioning scores defined in this way are shown in Figures 4 and S2 (solid curves). These scores correctly predict about half of the nucleosome positions (9 out of 20) with the strong maxima of the score profiles occurring within 1 bp from the experimental positions (see filled circles in Figures 4 and S2; for brevity, the experimentally observed positions of nucleosomal dyads are denoted below as ‘dyad positions’). Note that the positions of nucleosomes ‘601’, ‘603’, ‘605’ and four nucleosomes mapped on 5S somatic rDNA, are among these correctly predicted. For the other nine nucleosomes (marked by open circles), the predicted scores in the vicinity of the dyad positions (±1 bp) are not higher than for their neighbors (within ±7 bp intervals). For the remaining two nucleosomes (denoted by squares in Figure S2), the ‘canonical’ patterns do not predict correctly, with the threading scores attaining their minima close to the experimental positions. These three sets of nucleosome positions are represented in Table I as Groups I, II, and III, respectively.
Figure 4.

Profiles of the positioning scores combining individual sequence patterns. Solid curves (Set 1) represent the scores based on the ‘canonical’ sequence patterns YR, WW/WWW and SS/SSS. Dotted curves (Set 2) represent the scores based on the combined patterns including several new patterns (YYRR, RYRY and GC) in addition to the ‘canonical’ patterns. Weights of the patterns were pre-determined (see Methods and Table SIII, Sets 1 and 2). The experimental dyad positions are denoted by circles and squares. The filled and open circles represent the dyad positions in Groups I and II, respectively, while the squares represent the positions in Group III (see Table I).
Group III is comprised of the two nucleosome positions, +34 in the X. borealis oocyte 5S rDNA (66) and −127 in MMTV (67), which differ from the other 18 positions in the following ways. Position +34 in the oocyte 5S rDNA (66) is separated by ∼1.5 helical turns (14 bp) from the two adjacent positions in the same sequence, +20 and +58 (Table I). Hence, the DNA in this nucleosome has a rotational setting opposite that of its neighbors, and it is not surprising that the score correctly predicts positions +20 and +58, but fails to predict position +34 (Figure S2d). Position −127 in MMTV has the lowest GC content, 35%, among all the nucleosomes studied here. Its GC content differs by more than two standard deviations from the average of the 20 positions shown in Table I (i.e., 54 ± 7 %). Since these two nucleosome positions behave so differently from the other positions in Groups I and II, we will consider them separately.
The main difference between the nucleosomes of Groups I and II is in the relative amplitude of the predicted positioning score: for Group I, the peaks near the dyad positions (i.e., within 1 bp from the dyads) are much higher than those of their neighbors, while for Group II, this is not the case. Is this difference related to the behavior of WW and SS patterns in the two groups of sequences? To check this possibility, we calculated the frequency of occurrence of the WW and SS dimers for both groups and found that the sequences of Group I are characterized by a strong periodic WW pattern, with peaks occurring every 10 bp (Figure 5a). The strongest peak corresponds to position 58 (SHL ±1.5), indicating that AT-rich fragments are most abundant here. This is consistent with the frequent occurrence of the TTAA tetramer at SHL ±1.5 in clone ‘601’ (50) and other nucleosome positioning sequences exhibiting high affinity to histone octamer (49). Thus, it is conceivable that the high occurrence of WW dimers at position 58 (SHL ±1.5) is one of the determinants guiding positioning of the Group I nucleosomes. On the other hand, the SS dimers also exhibit a strong sinusoidal pattern with pronounced peaks at positions 24, 33, 43 and 53-54, corresponding to SHL ±5, ±4, ±3 and ±2 (compare Figures 3b and 5c). Overall, our data imply that the Group I nucleosomal sequences are characterized by strong periodically oscillating ‘canonical’ WW and SS patterns and especially high occurrence of the WW dimers at position 58.
Figure 5.

Frequency of occurrence of WW (AA:TT + AT + TA) and SS (GG:CC + GC + CG) versus base-pair step position for the nucleosomal fragments in Groups I (a and c) and II (b and d). The combined frequencies are ‘symmetrized’ with respect to the dyad at base-pair step 73.5 (vertical dashed lines). The raw data are shown in thin lines and the 3-point averages are shown in thick lines. The lines are colored as in Figure 3.
Group II sequences reveal a much less pronounced periodicity of the WW pattern compared to Group I (see Figures 5a and 5b). In particular, the peak at position 58 is less than half as high as that observed for Group I, indicating that WW dimers are rare in this area. As an example, note that in nucleosome 5A, formed on the chicken βA-globin gene (which belongs to the Group II), the CGCGCG motif occurs at position 58 (61). Therefore, it is quite possible that sequence patterns other than WW are operative in positioning of this and other nucleosomes in Group II. The other distinction of the Group II sequences is that the SS dimers exhibit a more ‘noisy’ profile (compared to Group I), with the peaks separated by ∼5 bp (see Figures 3b and 5d). The distribution of these peaks for Group II sequences suggests that the SS dimers are frequently found not only at the major-groove but also at the minor-groove sites (Figure 5d).
In summary, analysis of the positioning scores based on the ‘canonical’ sequence patterns reveals heterogeneity of the in vitro nucleosomes – some positions can be easily explained (Group I) while others cannot (Groups II and III). The profiles of WW and SS shown in Figure 5 confirm the existence of this heterogeneity. This result implies that additional sequence patterns are required to account for the nucleosome positions in Group II (Table I).
Alternative sequence patterns
To improve prediction of the Group II positions, we incorporated three new motifs – GC and YYRR at the minor sites and RYRY at the major sites (see Methods and Set 2 in Table SIII). The resulting positioning scores are shown in Figures 4 and S2 (dotted curves). A comparison of the solid and dotted curves indicates whether the new patterns help or not.
Clearly, the new positioning scores are in a better agreement with experimental data, especially for positions 104 in the pGUB plasmid (Figure 4b), −281 in the chicken βA-globin gene (Figure 4d), and −24 in the somatic 5S rDNA gene (Figure S2c). For all positions in Group I, the new combined patterns also make correct predictions (note the high maxima of the dotted curves corresponding to the filled circles in Figures 4 and S2).
Overall, introduction of the new patterns improves, to some degree, prediction of the nucleosome positions in Group II. Note that the weights for all the patterns were pre-determined (see Sets 1 and 2 in Table SIII); they can be optimized not only to further improve the ‘quality’ of prediction, but also to help in understanding which sequence patterns are most critical for which group of nucleosomes (see below).
Nucleosome positioning scores with optimized weights
To optimize the weights for the sequence patterns, we developed a minimization procedure incorporating 28 patterns (see Methods and Table SIII). Since the number of patterns exceeds the number of sequences, 20, we combined some of the 28 patterns to make 18 subsets, e.g., YR together with YYRR, WW with WWW, and SS with SSS (Table II). The variable weights for the patterns from the same subsets have identical values during minimization.
We first optimized the weights for the Group I and II positions to obtain a ‘universal’ set of weights satisfying both groups (Table II). As follows from the resulting score profiles shown in Figure 6, 15 out of the 18 positions are predicted with 1-bp precision (denoted ‘+’ in Table I), two positions are predicted with 2-bp precision and one position with 3-bp precision (denoted Δ2 and Δ3 respectively in Table I). Note that for the two positions, clone ‘603’ and +70 in MMTV, which are predicted with 2-bp precision using the ‘universal’ set of weights, the prediction can be improved by using the optimized weights for Groups I and II, respectively, given in Table II (compare the solid and dotted lines in Figures 6e, k).
Figure 6.


The positioning score profiles combining sequence patterns with the optimized weights. The solid lines represent the scores based on the optimized weights for the positions of both Groups I and II. The dotted lines show the score profiles based on the weights for the Group I positions (a and e) or for the Group II positions (k); see Table II for the weight values. The experimental dyad positions are shown by circles and squares, as described in Figure 4.
The two positions in Group III were optimized individually, using the same minimization procedure (Table II). Clearly, both of them can be predicted with 1-bp precision (Figure S3). The optimized weights for Group III differ from those for Groups I and II in two respects – first, the relatively low weights (< 1) for the GC pattern at all minor-groove sites; second, the high weight (= 2) for the YR pattern at the ‘non-critical’ major-groove sites. These differences can explain why the Group III positions cannot be predicted using the optimized weights obtained for the other 18 positions of Groups I and II (Figures 6h, j).
Asymmetry of nucleosomal sequences
Both natural and artificial nucleosome positioning sequences are characterized by certain degree of asymmetry. One of the first examples of this kind came from the sequence analysis of nucleosome dimers in chicken erythrocyte chromatin (72). It showed that in at least one of the two nucleosomes, the AT-containing elements were distributed asymmetrically with respect to the dyad. Recently, it was shown that in the +1 nucleosomes in yeast (i.e., nucleosomes adjacent to transcription start sites) the AT-content gradually decreases in direction from the 5′-end to the 3′-end of the transcript (8). As to the artificially selected nucleosomal sequences such as 601 clone, the high-affinity TA and TTAA motifs occur predominantly in one half of the nucleosome (73). This makes one half of nucleosome ‘stronger’ than the other half. In turn, this asymmetry defines the strength and polarity of the barrier precluding elongation of transcription by RNA polymerase II (63). In this context, it is interesting to analyze the asymmetry level of the sequences belonging to Groups I and II.
To introduce a quantitative descriptor for the level of asymmetry of nucleosomal sequences, we performed the following procedure. We first selected ‘orientation’ of the sequences in the Groups I and II by comparing the positioning scores for both halves of the nucleosome fragments, using a ‘universal’ set of optimized weights (see Table II and Set 3 in Table SIII). The half with the higher score was considered to be ‘strong’ and the other half was denoted as ‘weak.’ All the sequences were oriented from the ‘strong’ to ‘weak’ direction, and threaded on the nucleosomal templates using the same set of weights. This time, the positioning scores were calculated separately for two halves of nucleosomes (Figure S4).
As expected, the ‘strong’ halves of nucleosomes have higher positioning score compared to the ‘weak’ halves, but the ratio of the two scores does not exceed 1.2 on average, both for the Groups I and II. (The ratio is calculated for the ‘strong’ and ‘weak’ threading scores at the experimental position 0, see Figure S4.) This result indicates that the asymmetry of the nucleosomal sequences analyzed here is relatively insignificant. Thus, our main conclusions derived from threading the sequences on the symmetric nucleosomal templates would still hold even if the asymmetry of nucleosomes were taken into account. Another interesting point is that the overall score for the Group I sequences is higher and demonstrates a stronger periodicity, compared to the Group II. Based on this observation, we suggest that the Group I nucleosomes (i.e., 601) may be positioned stronger than the Group II nucleosomes (i.e., chicken β-globin).
Structural interpretation of individual sequence patterns
Next, we optimized the weights for Groups I and II separately to understand which patterns are the most critical for these nucleosome positions (Table II). Our data show that the two groups differ drastically in the weights for the YR/YYRR patterns at the ‘critical’ minor-groove sites. The best fit of the Group I positions is achieved when these weights are as high as possible (weights = 2) for the sites SHL ±1.5 and ±4.5, and as low as possible (weights = 0.5) for SHL ±3.5 and ±5.5. For Group II, however, the tendency is the reverse (Table II).
Group II positions
Using a DNA deformation energy function based on the high resolution crystal structure of a nucleosome (54), Tolstorukov et al. (35) precisely predicted five nucleosome positions including the chicken βA-globin nucleosome (also see ref. 74), two pGUB nucleosomes and two sea urchin 5S nucleosomes (Table I). Four of these five positions belong to Group II (Table I). Moreover, these authors showed that the computed energy cost of deforming DNA in a nucleosome is greatly reduced if the YR base-pair steps (in particular, CA:TG and TA) occur at the sites with large positive Slide and negative Roll, SHL ±3.5 and ±5.5. Thus, the fact that the YR/YYRR patterns at these sites have high weights according to our data (Table II) is entirely consistent with the results of Tolstorukov et al. (35). This indicates that the DNA trajectories in nucleosomes of Group II are likely to agree with the X-ray structure (with the strongest DNA deformations at SHL ±3.5 and ±5.5, caused by interactions with H2A and H2B histones).
Group I positions
On the other hand, the ‘601’ nucleosome position that was poorly predicted by Tolstorukov et al. (35), belongs to Group I, which is characterized by high weights (= 2) for the YR/YYRR patterns at the minor-groove sites SHL ±1.5 and ±4.5 (Table II). Note, however, that the crystallized nucleosomal DNA (54) is distorted at these sites less severely than at the sites SHL ±3.5 and ±5.5. Therefore, interpretation of the ‘601’ position should not be based solely on the crystal structure of nucleosome 1KX5 (54).
Furthermore, in the Group I sequences, the WW/WWW patterns at the sites SHL ±1.5 are assigned high weights = 2 (Table II), in accord with the frequent occurrence of the WW dimers at these locations (Figure 5a). Thus, the strong coupling of the YR/YYRR and WW/WWW motifs at SHL ±1.5 suggests that these may be key patterns that guide the positioning of Group I nucleosomes. (Importantly, the sites SHL ±1.5 are GC-rich in crystallized nucleosomal DNA (54) – there are GGC:GCC trimers at positions 58-60 and 88-90. This is yet another argument against using the crystallized nucleosome 1KX5 as a structural basis for interpretation of Group I nucleosome positions, including ‘601’.)
In contrast to SHL ±1.5, the sites SHL ±4.5 are enriched by GC dimers, as shown by the high weights (= 1.7) obtained in the course of optimization (Group I in Table II). As mentioned in the Introduction, the GC dimers typically have a negative Roll (26, 27) that facilitates bending of DNA into the minor groove. As to the unfavorable interactions between the GC pairs and the histone arginines in the minor groove, the arginine residues from histone H2B, R27 and R30, are among the most flexible in the histone core (56) – instead of penetrating deep into the minor groove, these arginines can interact with phosphate groups (if the DNA sequence is GC-rich at these sites).
Finally, the major sites SHL ±2 are critical for the nucleosome positions of Group I, as the YR, RYRY and SS/SSS patterns have high weights (Table II). These patterns facilitate DNA bending into the major groove at these sites.
Overall, our data suggest that the DNA trajectories in nucleosomes of Group I are probably different from those of the crystallized nucleosome 1KX5. Most likely, the DNA deformations predominantly occur around the sites SHL ±1.5 and ±2 (in the central part of nucleosomal DNA interacting with the H3/H4 tetramer), and at the sites SHL ±4.5 (interacting with the H2B histones). According to a recent single-molecule study (75) of the histone-DNA contacts in the ‘601’ nucleosome, the strongest interactions occur in three regions, one around the dyad (between SHL −1.5 and SHL +1.5) and the other two at the sites SHL ±4.5, thereby supporting our interpretation.
Additional evidence in favor of our hypothesis follows from ‘threading’ the 147-bp long α-satellite sequence (54) on a shortened nucleosomal template (Figure S5). The positioning profile computed with the weights optimized for Group II sequences has the highest score at the experimental dyad. If, however, the Group I weights are used, the dyad position corresponds to a minimum of the computed profile. This result indicates that the sequence patterns associated with Group II are consistent with positioning of crystallized nucleosome formed on the α-satellite sequence, which in turn supports the notion that the nucleosomal DNA of Group II (but not of Group I) follows an X-ray-like trajectory, with the strongest DNA deformations at the sites SHL ±3.5 and ±5.5.
Conclusion
We analyzed 20 nucleosome positions mapped in vitro with high resolution and found that overall, the underlying DNA sequences contain regularly spaced ‘canonical’ patterns associated with anisotropic DNA bending and nucleosome positioning, such as YR dimers and alternating AT-rich/GC-rich motifs. We therefore developed positioning score functions implementing these patterns, with the aim of predicting the positions of these nucleosomes, and found that about half of them could be predicted with 1-bp accuracy, including the well-known ‘601’ nucleosome. Predictions for the remaining positions were improved by incorporation of new ‘alternative’ patterns (GC and YYRR/RYRY motifs) and subsequent optimization of the weights of sequence patterns. As a result, 17 of the 20 positions were predicted with 2-bp precision, and, 15 of the 17 were predicted with 1-bp precision.
From these data, we conclude that most of the in vitro nucleosomes can be divided into two Groups (I and II) according to the positioning ‘rules’ they follow. The nucleosome positions in Group II, for nucleosomes such as the chicken β-globin nucleosome, are characterized by the frequent occurrence of minor-groove bending sequence patterns such as YYRR (e.g., TTAA and CTAG) at the sites SHL ±3.5 and ±5.5, where the DNA minor groove interacts with the H2A and H2B histones. Group II nucleosome positions have been correctly predicted based on DNA deformation energy function (35). We therefore assume that these nucleosomes follow an X-ray like pattern, with the strongest DNA deformations occuring at the sites SHL ±3.5 and ±5.5.
By contrast, the nucleosomes of Group I (including the ‘601’ clone) have a quite different sequence pattern, in which sites SHL ±1.5 and ±4.5 play important roles in positioning. The importance of SHL ±1.5 (sites of DNA interactions with the H3/H4 tetramer) has been addressed in earlier studies (35, 49, 50, 55, 62). The sites SHL ±4.5, however, have been largely ignored until now. Based on our results, we suggest that nucleosomes like ‘601’ may differ from the crystal structures published to date, with strong DNA deformations occurring at the sites SHL ±1.5 and ±4.5. This is in line with a recent study presenting a detailed map of histone-DNA interactions in the ‘601’ nucleosome showing that the strongest interactions occur in three regions, one around the dyad (between SHL −1.5 and SHL +1.5) and the other two at the sites SHL ±4.5 (75).
In summary, our analysis reveals a clear heterogeneity of the in vitro nucleosomes at the sequence level, which we correlate with the structural features of nucleosomal DNA (see also (35, 55)). We believe that this heterogeneity may be biologically important. In particular, nucleosomes in the promoter regions may follow different positioning ‘rules’ compared to ‘bulk’ nucleosomes in other genomic regions (e.g., because of drastically increased GC content in promoters of higher eukaryotes). However, the relatively small set of 20 nucleosome positions studied here was not sufficient to explore this issue further. Millions of nucleosome positions mapped genome-wide are better suited to answer this and other questions on the sequence-structure relationship in nucleosomes.
Supplementary Material
Figure S1: The Roll values for nucleosomal DNA versus base-pair step positions (54). The core DNA fragments in the three nucleosomal structures, 1KX5 (147 bp, black), 1KX4 (146 bp, red) and 1KX3 (146 bp, green) were used to calculate the Roll angles with CompDNA/3DNA software (26, 59). The values obtained for the three structures were averaged for each base-pair step and shown as a thick line. The peak and ‘dip’ positions for the averaged profile are indicated; these positions define the centers of the major and minor sites presented in Figure 2.
Figure S2: Profiles of the positioning scores combining individual sequence patterns. Notations are the same as in Figure 4.
Figure S3: Positioning score profiles combining sequence patterns with the weights optimized for the two positions in Group III (see Table SIII for the weight values). Squares represent the dyad positions given in Table I.
Figure S4. Positioning score profiles for the two halves of the oriented nucleosome sequences with the optimized weights for Groups I and II combined (Table II and Set 3 in Table SIII). The extended nucleosomal sequences in Groups I (a) and II (b) are oriented from the ‘strong’ to ‘weak’ direction, with the experimental dyads placed at position 0. For each position of the 147-bp fragment, the scores for the ‘strong’ half (blue) and the ‘weak’ half (red) are averaged across the Groups I and II.
Figure S5. The positioning score profiles for the 147-bp long α-satellite sequence (54) with the weights optimized for Group I sequences (Set 3-I), for Group II (Set 3-II), and for Groups I and II combined (Set 3; see Table SIII for the weight values). The nucleosomal template is shortened by removing 9 bp at both ends. (The sites SHL ±6.5 are removed from the minor site list (Figure 2); all the major sites are kept intact.) The experimental dyad is denoted as position 0.
Acknowledgments
We are grateful to W. Olson, M. Tolstorukov, E. Trifonov and D. Wang for valuable discussions and to G. Leiman for text editing. This research was supported by the Intramural Research Program of the NIH, National Cancer Institute, Center for Cancer Research.
Footnotes
Supplementary Material: Supplementary data and figures are available at http://go.cancer.gov/patterns; they can also be purchased from Adenine Press for US $50.00.
References and Footnotes
- 1.Kornberg RD, Lorch Y. Cell. 1999;98:285–294. doi: 10.1016/s0092-8674(00)81958-3. [DOI] [PubMed] [Google Scholar]
- 2.Yuan GC, Liu YJ, Dion MF, Slack MD, Wu LF, Altschuler SJ, Rando OJ. Science. 2005;309:626–630. doi: 10.1126/science.1112178. [DOI] [PubMed] [Google Scholar]
- 3.Segal E, Fondufe-Mittendorf Y, Chen L, Thåström A, Field Y, Moore IK, Wang JP, Widom J. Nature. 2006;442:772–778. doi: 10.1038/nature04979. [DOI] [PMC free article] [PubMed] [Google Scholar]
- 4.Johnson SM, Tan FJ, McCullough HL, Riordan DP, Fire AZ. Genome Res. 2006;16:1505–1516. doi: 10.1101/gr.5560806. [DOI] [PMC free article] [PubMed] [Google Scholar]
- 5.Lee W, Tillo D, Bray N, Morse RH, Davis RW, Hughes TR, Nislow C. Nat Genet. 2007;39:1235–1244. doi: 10.1038/ng2117. [DOI] [PubMed] [Google Scholar]
- 6.Ozsolak F, Song JS, Liu XS, Fisher DE. Nat Biotechnol. 2007;25:244–248. doi: 10.1038/nbt1279. [DOI] [PubMed] [Google Scholar]
- 7.Albert I, Mavrich TN, Tomsho LP, Qi J, Santon SJ, Schuster SC, Pugh BF. Nature. 2007;446:572–576. doi: 10.1038/nature05632. [DOI] [PubMed] [Google Scholar]
- 8.Mavrich TN, Ioshikhes IP, Venters BJ, Jiang C, Tomsho LP, Qi J, Schuster SC, Albert I, Pugh BF. Genome Res. 2008;18:1073–1083. doi: 10.1101/gr.078261.108. [DOI] [PMC free article] [PubMed] [Google Scholar]
- 9.Mavrich TN, Jiang C, Ioshikhes IP, Li X, Venters BJ, Zanton SJ, Tomsho LP, Qi J, Glaser RL, Schuster SC, Gilmour DS, Albert I, Pugh BF. Nature. 2008;453:358–362. doi: 10.1038/nature06929. [DOI] [PMC free article] [PubMed] [Google Scholar]
- 10.Kaplan N, Moore IK, Fondufe-Mittendorf Y, Gossett AJ, Tillo D, Field Y, LeProust EM, Hughes TR, Lieb JD, Widom J, Segal E. Nature. 2009;458:362–366. doi: 10.1038/nature07667. [DOI] [PMC free article] [PubMed] [Google Scholar]
- 11.Zhang Y, Zarmik M, Rattner BP, Euskirchen G, Snyder M, Kadonaga JT, Liu XS, Struhl K. Nat Struct Mol Biol. 2009;16:847–852. doi: 10.1038/nsmb.1636. [DOI] [PMC free article] [PubMed] [Google Scholar]
- 12.Kiyama R, Trifonov EN. FEBS Lett. 2002;523:7–11. doi: 10.1016/s0014-5793(02)02937-x. [DOI] [PubMed] [Google Scholar]
- 13.Trifonov EN, Sussman JL. Proc Natl Acad Sci USA. 1980;77:3816–3820. doi: 10.1073/pnas.77.7.3816. [DOI] [PMC free article] [PubMed] [Google Scholar]
- 14.Uberbacher EC, Wilkinson-Singley E, Harp JM, Bunick GJ. In: Structure and Expression. Olson WK, Sarma MH, Sarma RH, Sundaralingam M, editors. Vol. 3. Adenine Press; Guilderland. NY: 1988. pp. 139–158. [Google Scholar]
- 15.Zhurkin VB, Ulyanov NB, Ivanov VI. In: Structure and Expression. Olson WK, Sarma MH, Sarma RH, Sundaralingam M, editors. Vol. 3. Adenine Press; Guilderland. NY: 1988. pp. 169–190. [Google Scholar]
- 16.Chung HR, Vingron M. J Mol Biol. 2009;386:1411–1422. doi: 10.1016/j.jmb.2008.11.049. [DOI] [PubMed] [Google Scholar]
- 17.Fraser RM, Keszenman-Pereyra D, Simmen MW, Allan J. J Mol Biol. 2009;390:292–305. doi: 10.1016/j.jmb.2009.04.079. [DOI] [PubMed] [Google Scholar]
- 18.Kogan SB, Kato M, Kiyama R, Trifonov EN. J Biomol Struct Dyn. 2006;24:43–48. doi: 10.1080/07391102.2006.10507097. [DOI] [PubMed] [Google Scholar]
- 19.Schellman JA. Biopolymers. 1974;13:217–226. doi: 10.1002/bip.1974.360130115. [DOI] [PubMed] [Google Scholar]
- 20.Crick FH, Klug A. Nature. 1975;255:530–533. doi: 10.1038/255530a0. [DOI] [PubMed] [Google Scholar]
- 21.Sobell HM, Tsai CC, Gilbert SG, Jain SC, Sakore TD. Proc Natl Acad Sci USA. 1976;73:3068–3072. doi: 10.1073/pnas.73.9.3068. [DOI] [PMC free article] [PubMed] [Google Scholar]
- 22.Zhurkin VB, Lysov YP, Ivanov VI. Nucleic Acids Res. 1979;6:1081–1096. doi: 10.1093/nar/6.3.1081. [DOI] [PMC free article] [PubMed] [Google Scholar]
- 23.Dickerson RE, Kopka ML, Pjura P. Proc Natl Acad Sci USA. 1983;80:7099–7103. doi: 10.1073/pnas.80.23.7099. [DOI] [PMC free article] [PubMed] [Google Scholar]
- 24.Suzuki M, Yagi N. Nucleic Acids Res. 1995;23:2083–2091. doi: 10.1093/nar/23.12.2083. [DOI] [PMC free article] [PubMed] [Google Scholar]
- 25.Dickerson RE. Nucleic Acids Res. 1998;26:1906–1926. doi: 10.1093/nar/26.8.1906. [DOI] [PMC free article] [PubMed] [Google Scholar]
- 26.Gorin AA, Zhurkin VB, Olson WK. J Mol Biol. 1995;247:34–48. doi: 10.1006/jmbi.1994.0120. [DOI] [PubMed] [Google Scholar]
- 27.Olson WK, Gorin AA, Lu XJ, Hock LM, Zhurkin VB. Proc Natl Acad Sci USA. 1998;95:11163–11168. doi: 10.1073/pnas.95.19.11163. [DOI] [PMC free article] [PubMed] [Google Scholar]
- 28.Calladine CR. J Mol Biol. 1982;161:343–352. doi: 10.1016/0022-2836(82)90157-7. [DOI] [PubMed] [Google Scholar]; Dickerson RE, Drew HR. J Mol Biol. 1981;149:761–786. doi: 10.1016/0022-2836(81)90357-0. [DOI] [PubMed] [Google Scholar]
- 29.Dickerson RE, Drew HR. J Mol Biol. 1981;149:761–786. doi: 10.1016/0022-2836(81)90357-0. [DOI] [PubMed] [Google Scholar]
- 30.Zhurkin VB, Tolstorukov MY, Xu F, Colasanti AV, Olson WK. In: DNA Conformation and Transcription. Ohyama T, editor. LANDES Bioscience; 2005. pp. 18–34. [Google Scholar]
- 31.Zhurkin VB. Studia Biophys. 1982;87:151–152. [Google Scholar]
- 32.Zhurkin VB. FEBS Lett. 1983;158:293–297. doi: 10.1016/0014-5793(83)80598-5. [DOI] [PubMed] [Google Scholar]
- 33.Zhurkin VB. J Biomol Struct Dyn. 1985;2:785–804. doi: 10.1080/07391102.1985.10506324. [DOI] [PubMed] [Google Scholar]
- 34.Satchwell SC, Drew HR, Travers AA. J Mol Biol. 1986;191:659–675. doi: 10.1016/0022-2836(86)90452-3. [DOI] [PubMed] [Google Scholar]
- 35.Tolstorukov MY, Colasanti AV, McCandlish DM, Olson WK, Zhurkin VB. J Mol Biol. 2007;371:725–738. doi: 10.1016/j.jmb.2007.05.048. [DOI] [PMC free article] [PubMed] [Google Scholar]
- 36.Rohs R, West SM, Sosinsky A, Liu P, Mann RS, Honig B. Nature. 2009;461:1248–1253. doi: 10.1038/nature08473. [DOI] [PMC free article] [PubMed] [Google Scholar]
- 37.Harp JM, Hanson BL, Timm DE, Bunick GJ. Acta Crystallogr D. 2000;389:251–260. doi: 10.1107/s0907444900011847. [DOI] [PubMed] [Google Scholar]
- 38.Ulyanov NB, Zhurkin VB. J Biomol Struct Dyn. 1984;2:361–385. doi: 10.1080/07391102.1984.10507573. [DOI] [PubMed] [Google Scholar]
- 39.Zhurkin VB, Ulyanov NB, Gorin AA, Jernigan RL. Proc Natl Acad Sci USA. 1991;88:7046–7050. doi: 10.1073/pnas.88.16.7046. [DOI] [PMC free article] [PubMed] [Google Scholar]
- 40.Olson WK, Zhurkin VB. Curr Opin Struct Biol. 2000;10:286–297. doi: 10.1016/s0959-440x(00)00086-5. [DOI] [PubMed] [Google Scholar]
- 41.Yanagi K, Prive GG, Dickerson RE. J Mol Biol. 1991;217:204–214. doi: 10.1016/0022-2836(91)90619-h. [DOI] [PubMed] [Google Scholar]
- 42.Mack DR, Chiu TK, Dickerson RE. J Mol Biol. 2001;312:1037–1049. doi: 10.1006/jmbi.2001.4994. [DOI] [PubMed] [Google Scholar]
- 43.Goodsell DS, Kaczor-Grzeskowiak M, Dickerson RE. J Mol Biol. 1994;239:79–96. doi: 10.1006/jmbi.1994.1352. [DOI] [PubMed] [Google Scholar]
- 44.Salih F, Salih B, Trifonov EN. J Biomol Struct Dyn. 2008;26:273–282. doi: 10.1080/07391102.2008.10531241. [DOI] [PubMed] [Google Scholar]
- 45.Gabdank I, Barash D, Trifonov EN. J Biomol Struct Dyn. 2009;26:403–411. doi: 10.1080/07391102.2009.10507255. [DOI] [PubMed] [Google Scholar]
- 46.Caserta, Agricola E, Churcher M, Hiriart E, Verdone L, Di Mauro E, Travers A. Nucleic Acids Res. 2009;37:5309–5321. doi: 10.1093/nar/gkp574. [DOI] [PMC free article] [PubMed] [Google Scholar]
- 47.Koo HS, Crothers DM. Proc Natl Acad Sci USA. 1988;85:1763–1767. doi: 10.1073/pnas.85.6.1763. [DOI] [PMC free article] [PubMed] [Google Scholar]
- 48.Shrader TE, Crothers DM. J Mol Biol. 1990;216:69–84. doi: 10.1016/S0022-2836(05)80061-0. [DOI] [PubMed] [Google Scholar]
- 49.Thåström A, Bingham LM, Widom J. J Mol Biol. 2004;338:695–709. doi: 10.1016/j.jmb.2004.03.032. [DOI] [PubMed] [Google Scholar]
- 50.Lowary PT, Widom J. J Mol Biol. 1998;276:19–42. doi: 10.1006/jmbi.1997.1494. [DOI] [PubMed] [Google Scholar]
- 51.Kim Y, Geiger JH, Hahn S, Sigler PB. Nature. 1993;365:512–20. doi: 10.1038/365512a0. [DOI] [PubMed] [Google Scholar]
- 52.Heinemann U, Alings C. J Mol Biol. 1989;210:369–381. doi: 10.1016/0022-2836(89)90337-9. [DOI] [PubMed] [Google Scholar]
- 53.Luger K, Mäder AW, Richmond RK, Sargent DF, Richmond TJ. Nature. 1997;389:251–260. doi: 10.1038/38444. [DOI] [PubMed] [Google Scholar]
- 54.Davey CA, Sargent DF, Luger K, Maeder AW, Richmond TJ. J Mol Biol. 2002;319:1097–1113. doi: 10.1016/S0022-2836(02)00386-8. [DOI] [PubMed] [Google Scholar]
- 55.Balasubramanian S, Xu F, Olson WK. Biophys J. 2009;96:2245–2260. doi: 10.1016/j.bpj.2008.11.040. [DOI] [PMC free article] [PubMed] [Google Scholar]
- 56.Wang DF, Ulyanov NB, Zhurkin VB. J Biomol Struct Dyn. 2010;27:XXX–XXX. [Google Scholar]
- 57.Fratini AV, Kopka ML, Drew HR, Dickerson RE. J Biol Chem. 1982;257:14686–14707. [PubMed] [Google Scholar]
- 58.Goodsell DS, Kopka ML, Cascio D, Dickerson RE. Proc Natl Acad Sci USA. 1993;90:2930–2934. doi: 10.1073/pnas.90.7.2930. [DOI] [PMC free article] [PubMed] [Google Scholar]
- 59.Lu XJ, Olson WK. Nucleic Acids Res. 2003;31:5108–5121. doi: 10.1093/nar/gkg680. [DOI] [PMC free article] [PubMed] [Google Scholar]
- 60.Morozov AV, Fortney K, Gaykalova DA, Studitsky VM, Widom J, Siggia ED. Nucleic Acids Res. 2009;37:4707–4722. doi: 10.1093/nar/gkp475. [DOI] [PMC free article] [PubMed] [Google Scholar]
- 61.Davey CS, Pennings S, Reilly C, Meehan RR, Allan J. Nucleic Acids Res. 2004;32:4322–4331. doi: 10.1093/nar/gkh749. [DOI] [PMC free article] [PubMed] [Google Scholar]
- 62.Fernandez AG, Anderson JN. J Mol Biol. 2007;371:649–668. doi: 10.1016/j.jmb.2007.05.090. [DOI] [PubMed] [Google Scholar]
- 63.Bondarenko VA, Steele LM, Ujvari A, Gaykalova DA, Kulaeva OI, Polikanov YS, Luse DS, Studitsky VM. Mol Cell. 2006;24:469–479. doi: 10.1016/j.molcel.2006.09.009. [DOI] [PubMed] [Google Scholar]
- 64.Fitzgerald DJ, Anderson JN. Nucleic Acids Res. 1998;26:2526–2535. doi: 10.1093/nar/26.11.2526. [DOI] [PMC free article] [PubMed] [Google Scholar]
- 65.Flaus A, Luger K, Tan S, Richmond TJ. Proc Natl Acad Sci USA. 1996;93:1370–1375. doi: 10.1073/pnas.93.4.1370. [DOI] [PMC free article] [PubMed] [Google Scholar]
- 66.Panetta G, Buttinelli M, Flaus A, Richmond TJ, Rhodes D. J Mol Biol. 1998;282:683–697. doi: 10.1006/jmbi.1998.2087. [DOI] [PubMed] [Google Scholar]
- 67.Flaus A, Richmond TJ. J Mol Biol. 1998;275:427–441. doi: 10.1006/jmbi.1997.1464. [DOI] [PubMed] [Google Scholar]
- 68.Kassabov SR, Henry NM, Zofall M, Tsukiyama T, Bartholomew B. Mol Cell Biol. 2002;22:7524–7534. doi: 10.1128/MCB.22.21.7524-7534.2002. [DOI] [PMC free article] [PubMed] [Google Scholar]
- 69.Tolstorukov MY, Choudhary V, Olson WK, Zhurkin VB, Park PJ. Bioinformatics. 2008;24:1456–1458. doi: 10.1093/bioinformatics/btn212. [DOI] [PMC free article] [PubMed] [Google Scholar]
- 70.Zhurkin VB. Nucleic Acids Res. 1981;9:1963–1971. doi: 10.1093/nar/9.8.1963. [DOI] [PMC free article] [PubMed] [Google Scholar]
- 71.Cui F, Zhurkin VB. Nucleic Acids Res. 2009;37:2818–2829. doi: 10.1093/nar/gkp113. [DOI] [PMC free article] [PubMed] [Google Scholar]
- 72.Satchwell SC, Travers AA. EMBO J. 1989;8:229–238. doi: 10.1002/j.1460-2075.1989.tb03368.x. [DOI] [PMC free article] [PubMed] [Google Scholar]
- 73.Kulaeva OI, Gaykalova DA, Pestov NA, Golovastov VV, Vassylyev DG, Artsimovitch I, Studitsky VM. Nat Mol Struct Biol. 2009;16:1272–1278. doi: 10.1038/nsmb.1689. [DOI] [PMC free article] [PubMed] [Google Scholar]
- 74.Salih F, Salih B, Trifonov EN. J Biomol Struct Dyn. 2008;26:9–16. doi: 10.1080/07391102.2008.10507219. [DOI] [PubMed] [Google Scholar]
- 75.Hall MA, Shundrovsky A, Bai L, Fulbright RM, Lis JT, Wang MD. Nat Struct Mol Biol. 2009;16:124–129. doi: 10.1038/nsmb.1526. [DOI] [PMC free article] [PubMed] [Google Scholar]
Associated Data
This section collects any data citations, data availability statements, or supplementary materials included in this article.
Supplementary Materials
Figure S1: The Roll values for nucleosomal DNA versus base-pair step positions (54). The core DNA fragments in the three nucleosomal structures, 1KX5 (147 bp, black), 1KX4 (146 bp, red) and 1KX3 (146 bp, green) were used to calculate the Roll angles with CompDNA/3DNA software (26, 59). The values obtained for the three structures were averaged for each base-pair step and shown as a thick line. The peak and ‘dip’ positions for the averaged profile are indicated; these positions define the centers of the major and minor sites presented in Figure 2.
Figure S2: Profiles of the positioning scores combining individual sequence patterns. Notations are the same as in Figure 4.
Figure S3: Positioning score profiles combining sequence patterns with the weights optimized for the two positions in Group III (see Table SIII for the weight values). Squares represent the dyad positions given in Table I.
Figure S4. Positioning score profiles for the two halves of the oriented nucleosome sequences with the optimized weights for Groups I and II combined (Table II and Set 3 in Table SIII). The extended nucleosomal sequences in Groups I (a) and II (b) are oriented from the ‘strong’ to ‘weak’ direction, with the experimental dyads placed at position 0. For each position of the 147-bp fragment, the scores for the ‘strong’ half (blue) and the ‘weak’ half (red) are averaged across the Groups I and II.
Figure S5. The positioning score profiles for the 147-bp long α-satellite sequence (54) with the weights optimized for Group I sequences (Set 3-I), for Group II (Set 3-II), and for Groups I and II combined (Set 3; see Table SIII for the weight values). The nucleosomal template is shortened by removing 9 bp at both ends. (The sites SHL ±6.5 are removed from the minor site list (Figure 2); all the major sites are kept intact.) The experimental dyad is denoted as position 0.