Abstract
The kinetics of lipofuscin growth in diseased retinal pigment epithelium cells is investigated using Monte Carlo simulations and scaling theory on a cluster aggregation model. The model captures the essential physics of lipofuscin growth in the cells. A remarkable feature is that small particles may be removed from the cells while the larger ones become fixed and grow by aggregation. Model simulations are compared to the number of lipofuscin granules in eyes with early age-related degeneration.
I. INTRODUCTION
Choroidal neovascularization (CNV) in age-related macular degeneration (ARMD) [1–4] is the most common pathogenic mechanism that leads to irreversible severe visual loss in older people in the United States. CNV is produced by accumulation of residual material caused by aging of retinal pigment epithelium cells. The retinal pigment epithelium (RPE) is the pigmented cell layer just outside the retina that nourishes retinal visual cells and it is firmly attached to the underlying choroid and overlying retina. The RPE is a phagocytic system that is essential for renewal of photoreceptors (rods and cones). Each photoreceptor has an inner and outer segment (OS) with disks stacked like a roll of coins. The disks are necessary for the conversion of light into electrical potentials and the spent disks are shed from their outer segments and degraded within the RPE. Most of these disks appear to be degraded quickly in RPE cells of young healthy individuals. However, with time, incompletely degraded membrane material builds up in the form of lipofuscin. Lipofuscin is a yellowish pigment made of free-radical-damaged protein and fat. It builds up normally with age or pathologically in certain conditions such as ARMD, Alzheimer disease, and Parkinson disease. As cellular aging is associated with the presence of lipofuscin [5–7], then the study of their formation and growth becomes important. The residual material in lipofuscin can be deposited in Bruch’s membrane contributing to drusen formation and Bruch’s membrane thickening [8,9]. Moreover, RPE containing lipofuscin associated with drusen have been observed within a small drusen providing evidence that they probably contribute to drusen volume and formation [10]. In this work we consider lipofuscin accumulation in diseased RPE cells and the contribution of spent OS membranes to formation of drusen as an aggregation-deposition process.
The formation of clusters by nonequilibrium growth processes is present in a wide variety of systems of interest in science and technology such as colloids and aerosols [11,12], gels [12,13], inorganic thin films [14–16], organic thin films [17–19], growing crystals [20], galactic structures [21], granular flow [22], and cell colonies [23–25]. The pattern forming dynamical processes can vary substantially from system to system. The richness of clustering phenomena has resulted in the development of many models describing different growth dynamics. Moreover, the nontraditional application of growth dynamical models to problems of interdisciplinary nature has been growing steadily in recent years. Here the kinetics of lipofuscin growth in diseased RPE cells and their contribution to the drusen formation is investigated as a cluster aggregation process.
The outline of this paper is as follows. We provide a short description of CNV in Sec. II. The relationship between the aggregation of lipofuscin and drusen formation is presented in Sec. III. The model of lipofuscin accumulation and deposition is presented in Sec. IV. The scaling description for the aggregation process is given in Sec. V. In Sec. VI we present extensive simulation results for lipofuscin aggregation. Finally, in Sec. VII we give a brief discussion of our results and compare them with experimental data.
II. CHOROIDAL NEOVASCULARIZATION
The RPE serves the photoreceptors (rods and cones) in several distinct ways: acts in the absorption of light passing through the retina, regeneration of visual pigments, formation of the outer blood-ocular barrier, upkeep of subretinal space including fluid and electrolyte balance, maintenance of the choriocapillaris, scar tissue formation, and phagocytosis of spent outer segment disks [26]. It is estimated that during a 70-year lifetime each RPE cell will phagocytize 3 billion outer segment disks [27,28].
Lipofuscin is not an inert filler material; its components are photoreactives and can induce apoptosis of the RPE [29–31]. In older individuals, up to 25% of the free cytoplasmic space of RPE cells may be occupied by lipofuscin [32]. Excessive accumulation of lipofuscin leads to cell loss and there is an age-related loss in RPE cells particularly in the fovea and midperiphery. Aging of Bruch’s membrane and the RPE, i.e., the accumulation of waste material, is thought to lead to decreased metabolic function, altered passage of growth factors through the membrane, and increased fragmentation of Bruch’s membrane, all leading to the possibility of the growth of new blood vessels from preexisting vessels that originate from the choroid through breaks in Bruch’s membrane [33]. This disorder is known as CNV. The mechanisms of CNV are not completely understood. Virtually any pathologic process that involves the RPE and damages the Bruch’s membrane may be complicated by CNV.
III. AGGREGATION OF LIPOFUSCIN AND DEPOSITION OF RESIDUAL MATERIAL IN BRUCH’S MEMBRANE
The retina is the most oxygen-consuming tissue in the body with a consumption level ~50% higher than the brain or kidneys [34]. Most of this oxygen consumption occurs in photoreceptors and this vascular arrangement exposes, at least on a time scale of decades, the RPE and the outer segments to an oxygen concentration roughly equivalent to that found in arterial blood [35]. This results in the accumulation of oxidative and photo-oxidative damage. As discussed in the introduction, photoreceptors continuously renew their OS by shedding disks in RPE. Daily phagocytosis and processing of shed photoreceptor OS places a heavy metabolic burden on the underlying RPE cells. The disks fuse with lysosomes of RPE cells forming phagolysosomes. Over time, the contents of phagolysosomes are incompletely degraded and form autofluorescent lipid-protein aggregates called lipofuscin [36]. A major fluorophore of RPE lipofuscin is a hydrophobic quaternary amine called A2E [29]. Lipofuscin contains a significant quantity of retinoids including the fluorophore A2E, a pyridinium bisretinoid, which likely leads to photoxidation, RPE cell damage, and inflammation [37]. When A2E reaches a critical concentration it delays the metabolism of phagocytosed OS lipids by the RPE [38]. Phagocytosed and oxidized OS membranes are extruded by the RPE into Bruch’s membrane contributing to drusen formation and membrane thickening [8,9]. This progressive lipid and cholesterol accumulation in Bruch’s membrane beneath the RPE has been identified as a contributing factor to ARMD.
We studied the lipofuscin formation in diseased RPE cells and the deposition of phagocytosed and oxidized OS membranes in Bruch’s membrane. As we shall see in more detail in the next section, a remarkable feature of the aggregation of residual material is that clusters larger than a certain size do not diffuse in the cytoplasm [39,40], while the smaller clusters diffuse with a size-dependent diffusion constant associated with diffusion in a non-Newtonian fluid such as the cytoplasm. Stationary clusters grow by aggregation.
IV. MODEL
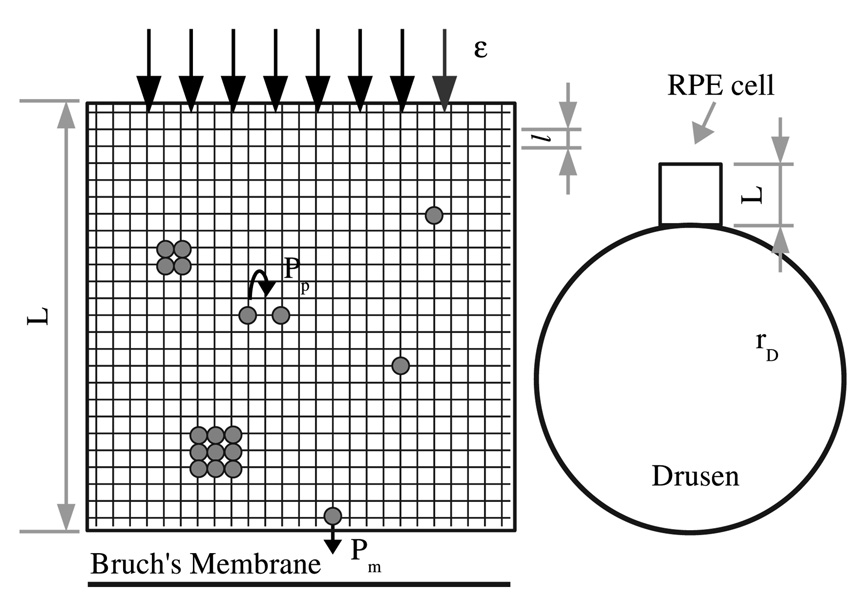
In our model we consider a cross section of an RPE cell (see Fig. 1) on a square lattice of L × L sites. The cell nucleus has not been considered because in mammalian cells it occupies around 10% of the total volume [41]. Particles representing lipoproteins, lipids peroxides, and their metabolites enter from the top edge of the cell into the cytoplasm and move along Brownian trajectories, and either contribute to the formation and growth of lipofuscin or leave the cell and are deposited in the Bruch’s membrane (at the bottom of the cell). The geometry of our model is shown in Fig. 1. Simulations start with an empty lattice and the following processes take place:
A particle enters from the top edge of the lattice occupying an empty upper site chosen at random with probability ε per unit of time t.
A particle in the lattice can move in a random direction by one diameter, which is defined as one lattice spacing , where s0 is the area of the particle. The characteristic time between diffusion steps is equal to 2s0/Dcyto, where Dcyto is the diffusion coefficient of the particle in the cytoplasm. The diameter of the lipoproteinlike particles that accumulate with age in Bruch’s membrane in the normal eye is between 23 and 150 nm approximately [42]. We choose s0=402 nm2 and the diffusion coefficient Dcyto=1.13 × 10⁶ nm2/s [40]. Given that the medium characteristic length of a human RPE cell is 20 µm, then the size of the lattice is L × L=500 × 500 sites.
When two particles touch, they stick with probability Pa to form a new compact particle with mass conservation. The size of the new particle will be s=s0i, where i is the number of particles of size s0 forming it (in the lattice, the new particle will occupy a square of side equal to integer part of ).
If, as a consequence of diffusion a particle arrives at the bottom of the cell, it can go through the cell membrane with probability Pm. Thus, the particles can be deposited in the Bruch’s membrane and contribute to the formation of drusen [8,9].
FIG. 1.
The RPE cell and the growth of lipofuscin are shown in the left part of the figure: outer segment disks enter the cell with probability ε per unit of time t. The smallest clusters diffuse and can go through the cell membrane with probability Pm or stick to a cluster with probability Pa. A drusen of radius rD=50 µm on the right part of the figure is drawn to scale with respect to an RPE cell.
As we mentioned above a distinguishing feature of lipofuscin formation is that when an aggregate reaches a critical size, it becomes fixed [39,40]. Thus, in our model the particles that diffuse and can therefore be removed from the cell by passing through the cell membrane are those with size s0. Lipofuscin formation, of typical length 0.2–1 µm [43], can be achieved through attachment of moving particles to fixed aggregates.
Usually in modified cluster-cluster aggregation models [44–46] a far-from-equilibrium steady state is reached because larger clusters are removed. In our model, larger clusters continue to grow while small particles are removed causing the number and size of clusters to change gradually with time, and therefore a steady distribution of clusters is never reached.
According to the above described processes, the model has three parameters: the quantity of spent outer segment disks of size s0 entering the cell per unit of time ε, the sticking or aggregation probability Pa of residual material, and the probability Pm of the smallest particles crossing the cell membrane. The values of these parameters are unknown. Nevertheless, it is possible to calculate roughly a value of ε because it is estimated that during a 70-year lifetime each RPE cell will phagocytize 3 billion outer segment disks [27,28]. Thereby, the frequency with which disks enter the cell would be of the order of 10−3–10−2 s−1. The contribution to drusen formation due to spent OS disks is unknown. If only 10% of a typical drusen of rD=50 µm is considered as the contribution due to spent OS disks (see Fig. 1), then the ratio of deposited material and the quantity of lipofuscin formed in the cell is approximately 4:1, if we assume that half the area of the diseased RPE cell is occupied by lipofuscin. The deposition probability Pm is expected to be greater than the sticking probability Pa in all cases. We will describe the processes of lipofuscin growth and residual material deposition by varying the model parameters within the range of biological interest.
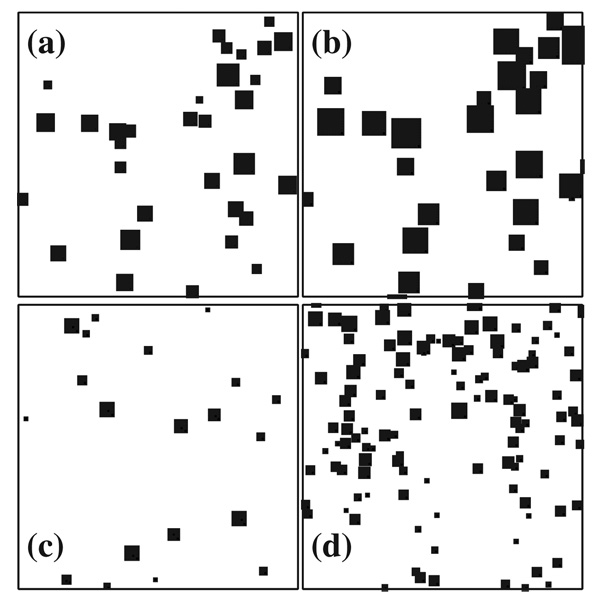
Figures 2(a) and 2(b) show two stages of cluster growth in the cell obtained from a simulation with ε=10−2 s−1, Pa=10−4, and Pm=10−3. The average number and size of clusters increase with time and the clusters grow forming compact squares [see item (c) above]. The quantity of deposited material is not shown in these snapshots.
FIG. 2.
Sample cluster size distribution at two different times, for ε=10−2 s−1, Pa=10−4 and Pm=10−3. (a) and (b) show 200 × 200 sites taken from simulations carried out on a 500 × 500 substrate at the instant at which the mean cluster size S(t) has reached values of 50.8 and 220, respectively. The average number and size of clusters increase with time. The snapshots (a) and (b) are rescaled to (c) and (d), respectively, such that the system size is equal to 30S1/2.
V. SCALING THEORY
In analogy with the scaling approach for aggregation processes [47–50], the number of clusters of size s at time t, ns(t), changes with time, in a way which can be described in the dynamic scaling form given by
| (1) |
where S=Σs2ns/Σsns is the mean cluster size that diverges as S~(εt)z and the form of the scaling function depends on the details of the process. We find that f(x)~xθ, for x ≪ 1 and f(x)→0, for x ≫ 1. Regarding the use of the weighted average size, S=Σs2ns/Σsns rather than the ratio Σsns/Σns, we would like to point out that the two quantities scale exactly the same way due to the scaling form of the cluster size distribution. But this is the more prevalent form used in the study of aggregation and clustering phenomena, because the most important clusters are the larger ones and this weighting gives them slightly more weight in the scaling regime.
The total number of clusters in a cell, N, which is given by N=Σns, is expected to increase due to the fact that the system is far from the coalescence regime, with an exponent z′ which is defined by N~tz′. The size distribution exponent θ and the dynamic exponents ξ, z, and z′ may depend on the probabilities of aggregation Pa and of passing through the cell membrane Pm.
The total mass ρ of particles entering and remaining inside a cell forming lipofuscin is equal to Σsns. Using the scaling form Eq. (1) in the definition of ρ, we can write
| (2) |
If Pm=0, all particles entering remain inside the cell and the total mass ρ grows as εt, where ε is a constant parameter, otherwise, if Pm≠0 and there are nucleations inside the cell, then ρ~tα, where the new dynamic exponent α depends on probabilities Pm and Pa. Using Eq. (2) we can write
| (3) |
While in many aggregation processes [44,46,47] the total mass remains constant and θ has the universal value of 2, in the RPE cell deposition model the total mass ρ increases with time whenever lipofuscin are formed. Therefore, α>0 and θ<2. When Pm≠0 and nucleations are present in the cell, the number and size of clusters grow with time and thus their probabilities of capturing diffusing particles increase. Then, dρ/dt increases with time and using the scaling expression of ρ [see paragraph before Eq. (3)], we find that α>1 for Pm≠0.
VI. RESULTS
A qualitative illustration of the dynamic scaling concept is provided by Figs. 2(c) and 2(d) in which the lengths have been rescaled in a such way that the system size in both figures is equal to 30S1/2, where S is the mean cluster size. The rescaled figures show that while the total number of clusters in each figure is very different, the cluster size distribution is self-similar if the system is scaled properly. As demonstrated by the data in the subsequent figures, the scaling form proposed in Sec. V is only reached at long times in the model of lipofuscin growth.
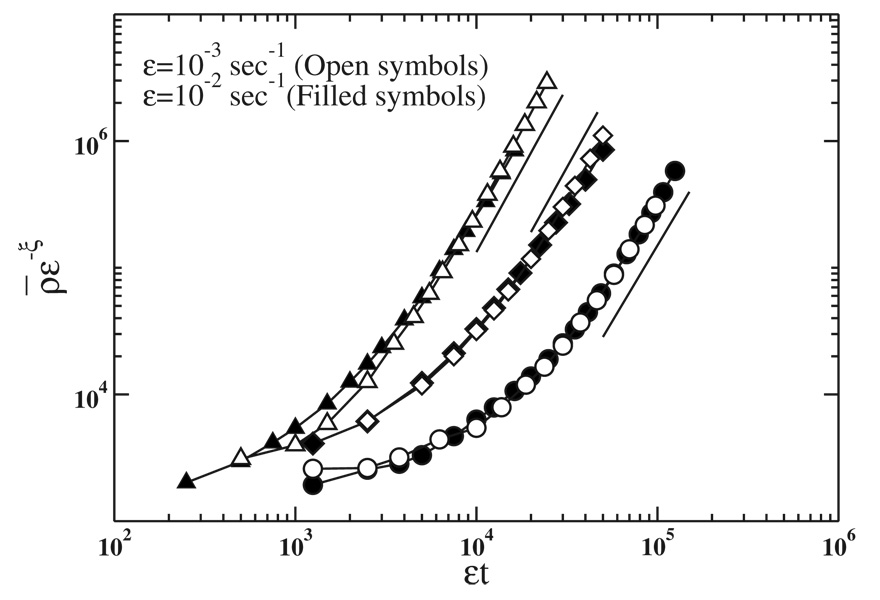
Figure 3 shows results obtained for the scaling of the growth of the total number of particles of size s0=160 nm2 (isolated and forming clusters) in a diseased RPE cell ρ̄=ρs0, for different values of Pm and Pa, where s0 is the smallest size of particles occupying a site at the lattice and ρ is the total mass of clusters. The scaling of ρ is observed for large enough εt where ρ behaves as (εt)α [Eq. (2)] and also in the transitory regime for small εt. The x axis in Fig. 3 corresponds to the total number of particles entering the cell at rate ε. The material deposited under the cell forming the drusen is the difference between the total mass entering and ρ. When ρ̄~SN/s0~1/Pa, all diffusing particles are captured and α=1 (this regime is not shown in Fig. 3 because of finite-size effects). The above argument connects the exponent α associated with ρ with the quantity of material deposited in the cell: if α>1 the drusen size grows with time, whereas if α=1 there is no deposition. In Table I we list the numerical estimates of exponent α obtained from the simulations.
FIG. 3.
Scaling of the total number of particles of size s0=160 nm2 (isolated and forming clusters) in a diseased RPE cell ρ̄ as a function of εt for two values of ε and different values of Pm and Pa: Pm=10−3 and Pa=10−5 (diamonds) Pm=10−2 and Pa=10−5 (circles), and Pm=10−2 and Pa=10−4 (triangles). The exponent ξ=1, for Pm=10−3 and Pa=10−5, and ξ=1.2 for the others probabilities. The value of α is obtained from the slopes of solid straight lines for each value of Pm and Pa (see Table I).
TABLE I.
Values obtained for the exponents α, z, and z′ from the simulations for different values of Pm and Pa (third, fourth, and sixth columns, respectively). They are independent of the quantity of spent outer segment disks entering the cell per unit of time, ε. The fifth column is the value of z′ given by the difference of α and z [Eq. (5)] and shows a good agreement with the numerical estimates of the exponent (sixth column). In all cases a convincing data collapse of the cluster size distributions could be obtained using the values for θ=2−α/z (last column).
| Pm | Pa | α | z | z′=α − z | z′ | ||
|---|---|---|---|---|---|---|---|
| 10−2 | 10−4 | 2.59 | 1.78 | 0.81 | 0.88 | 0.55 | |
| 10−2 | 10−5 | 2.40 | 1.60 | 0.80 | 0.82 | 0.50 | |
| 10−3 | 10−5 | 2.57 | 1.70 | 0.87 | 0.90 | 0.49 |
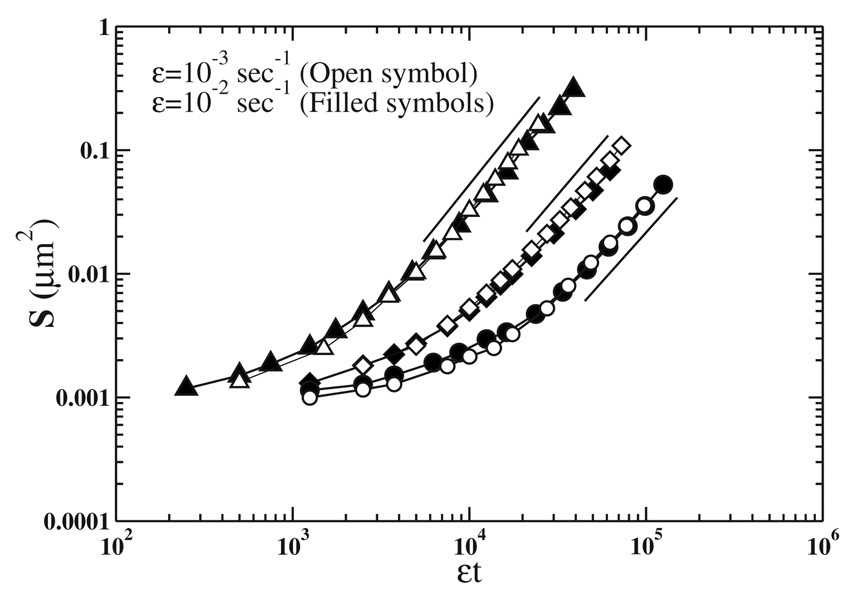
Figure 4 shows the growth of the mean cluster size S with εt obtained from the simulations used to generate Fig. 3. This figure indicates that the mean cluster size grows as (εt)z for large enough εt after a transitory regime. We calculate z from the figure for different values of probabilities Pm and Pa (see Table I).
FIG. 4.
Mean cluster size S versus εt using the same parameter values Pm, Pa, and ε as in Fig. 3 (see caption). The exponent z is obtained from the slopes of solid straight lines for each value of Pm and Pa (see Table I).
Once z and α are estimated from simulations, the exponent z′ can be obtained directly from the definition of N and the scaling form given by Eq. (1). Thus, we find
| (4) |
Substituting the value of θ from Eq. (3) we obtain
| (5) |
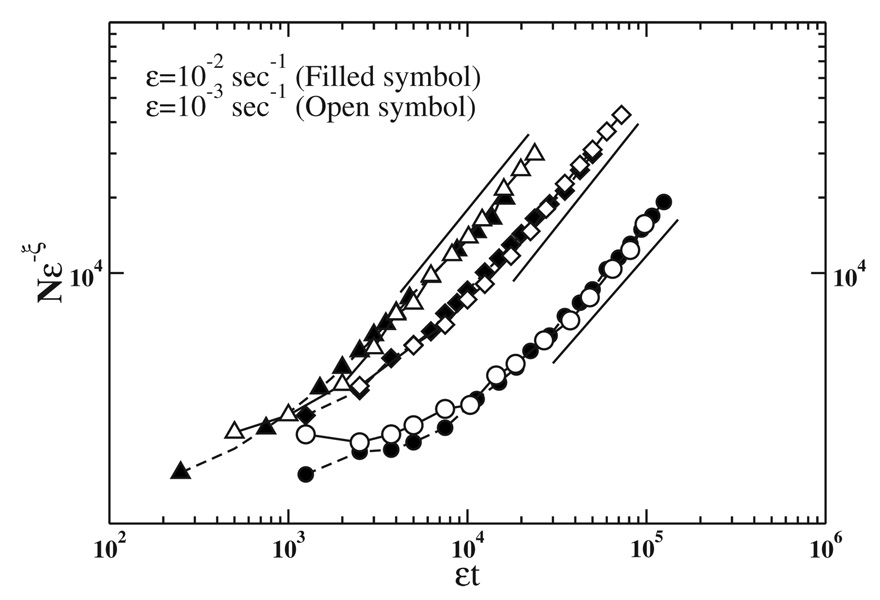
The scaling of the total number of clusters N is shown in Fig. 5 obtained from the simulations used to generate Figs. 3 and 4. The simulation results for z′, calculated from slopes of solid lines in Fig. 5, for various values of Pm and Pa are listed in Table I (sixth column). These results are in good agreement with the difference of the exponents α and z given by Eq. (5) (see fifth column in Table I).
FIG. 5.
The scaling of the total number of clusters N as a function of εt using the same parameter values Pm, Pa, and ε as in Fig. 3 (see caption). The exponents z′ obtained from the slopes of solid straight lines are compared with the exponents obtained from Eq. (5) in Table I.
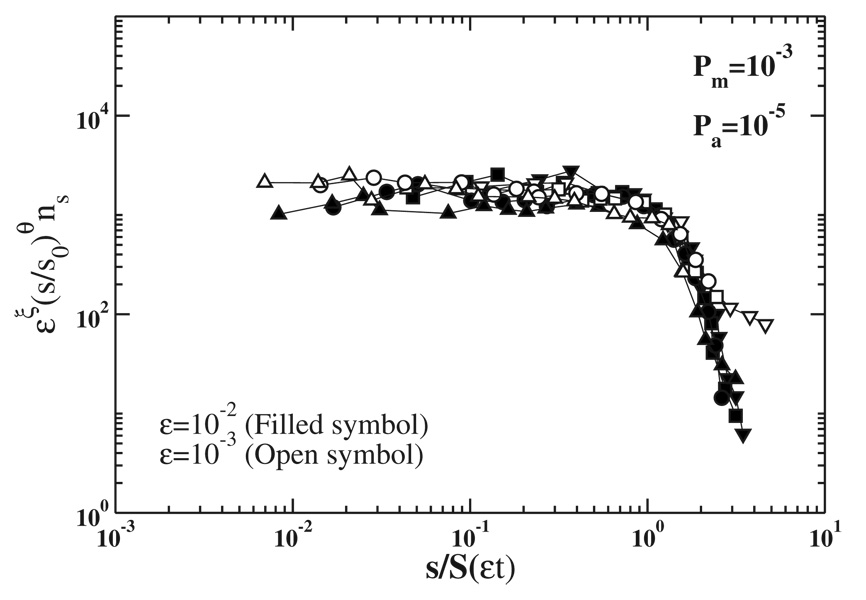
The size distribution exponent θ can be calculated from Eq. (3) and from the numerical estimates of the exponents α and z (see last column in Table I). Figure 6 shows how data of the number of clusters of size s, ns(t), for various times can be scaled into a single scaling curve using Eq. (1). We have obtained equally excellent scaling plots for other values of Pa, Pm, and ε. Scaling function (1) is expected to be valid in the aggregation regime for a low enough total mass ρ of particles forming lipofuscin.
FIG. 6.
Scaling of the number of clusters of size s, ns(t), for fixed probabilities of aggregation and deposition Pa=10−5 and Pm=10−3, two different values of entrance rate ε: 10−2 s−1 and 10−3 s−1, and various values of εt: 1.25 × 10⁴ (down triangles), 2.5 × 10⁴ (circles), 5 × 10⁴ (squares), and 7.5 × 10⁴ (up triangles). These results were obtained by averaging over 100 samples. The exponent ξ=1 (see caption of Fig. 3) and θ=0.49.
Detection of lipofuscin is facilitated by its autofluorescent properties. Spatial distributions along different zones of eye’s fundus and accumulation of lipofuscin were obtained by means of spectrophotometry [28,51–56]. These topographical distributions of autofluorescence are used as indicators of lipofuscin content in different regions of the RPE epithelium [57,58]. Single cells with lipofuscin granules are not visualized by means of spectrophotometry. With the advent of confocal scanning laser ophthalmoscopy it is possible to view the lipofuscin content of RPE cells [43]. This imaging method is noninvasive and is a tool to evaluate dynamic age and disease-associated alterations in cytoplasmic lipofuscin granule accumulation and distribution [59]. However, lipofuscin distributions inside the RPE cells have not been measured up to the present. It could be useful to compare experimental results of the lipofuscin distribution in an RPE cell and the results of the aggregation model for testing the kinetics of growth of lipofuscin clusters.
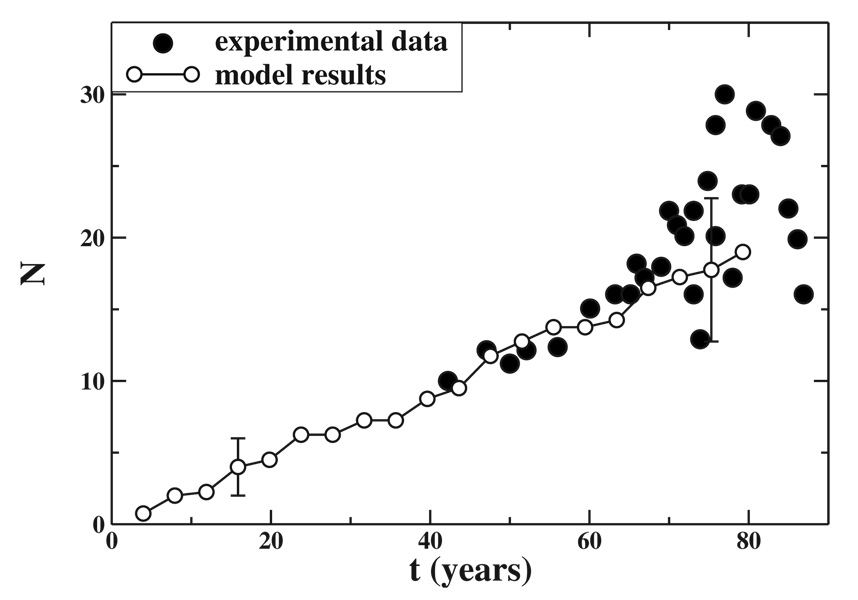
The number of lipofuscin granules in aging eyes (with early ARMD) has been obtained using electron microscopy [60]. In order to show the plausibility of our model, we compare the total number of clusters N with these experimental data. A good agreement between trends of measured data and model results can be achieved, with parameter values ε=10−3, Pa=10−6, and Pm=4 × 10⁻³ as shown in Fig. 7. In fact, the comparison shown in Fig. 7 is between experimental data and the two-dimensional model results. Nevertheless, since the growth law depends on the parameters, we expect that the simulation results of the model in three dimensions to behave similarly. On the other hand, it is particularly interesting that a linear behavior of both measured data and model results is obtained for t<70 years. Moreover, the mean diameters obtained using these parameter values are S1/2(t)≈0.7–0.8 µm for ages around 80 years. This estimate agrees well with the mean diameters of lipofuscin granules distributed in cytoplasm of the RPE cells in aged adults [60]. The faster increase observed experimentally at t>70 years may be explained by a notorious lessening of outer segments degradation within the RPE and, the final decreasing may take place as a consequence the death of many RPE cells, those with larger N. This effect of N decreasing may also be associated to the lipofuscin extrusion by the RPE into Bruch’s membrane. Our model may be modified in order to reproduce these experimental results using an ε(t)and letting the coalescence take place. Nevertheless, this is beyond the scope of our paper.
FIG. 7.
Comparison of model predictions (open symbols) to experimental data (solid symbols) measuring the total number of granules of lipofuscin N in eyes with early ARMD [60]. The model results were obtained using ε=10−3, Pa=10−6, and Pm=4 × 10⁻³ and averaging over four samples.
VII. DISCUSSION
In summary, we have introduced a simple model of cluster aggregation and deposition for describing lipofuscin growth in diseased RPE cells and the contribution of spent OS membranes to formation of drusen. We have shown that the scaling description is an effective method for describing the kinetics of lipofuscin growth. The growth dynamic exponents of the scaling description are independent of the entrance rate of spent outer segment disks into the cell. The contribution to drusen formation by deposition of spent OS membranes is linked to growth of total mass of lipofuscin where a saturation regime can be reached depending on quantity of residual material entering into the diseased RPE cell per unit of time and the probabilities of cluster-cluster aggregation and deposition of spent OS disks. The model captures the essential physics of lipofuscin growth and deposition of phagocytosed and oxidized OS disks into Bruch’s membrane. An unusual property of the model is that small particles may be removed while the larger ones become fixed and grow by aggregation. We compare the predictions of this model to electron microscopic studies measuring changes in number of lipofuscin granules in eyes with aging. A good agreement is found between model results and the experimental data for suitable values of the parameters. This comparison shows that the number of lipofuscin granules appears to grow linearly with time up to an age of 70 years.
Although in this work we studied the dynamics of cluster aggregation in two dimensions, we would like to point out that the comparison between our results and the experimental data in Fig. 7 indicates that a similar type of dynamics is expected in three dimensions.
ACKNOWLEDGMENTS
This research was partially supported by a grant from the CONICET (Grant No. PIP 5569), Universidad Nacional de Mar del Plata and ANPCyT (Grants No. PICT 11-21409 and No. PICTO 11-495), Argentina, and by a Seed Grant from Emory College of Arts and Sciences. K.M. would like to thank the Department of Physics of Emory University, where part of this work was carried out, for their support and hospitality.
References
- 1.Hollyfield JG, Anderson RE, LaVail MM, editors. Retinal Degenerative Diseases. Vol. 572. New York: Springer; 2006. [Google Scholar]
- 2.Lim JI, editor. Age-Related Macular Degeneration. Chicago: CRC Press; 2007. [Google Scholar]
- 3.Cavallotti CAP, Cerulli L, editors. Age-Related Changes of the Human Eye. Vol. 2008. New York: Humana Press Inc.; [Google Scholar]
- 4.Spaide RF, Armstrong D, Browne R. Retina. 2003;23:595. doi: 10.1097/00006982-200310000-00001. [DOI] [PubMed] [Google Scholar]
- 5.Boulton M, Marshall J. Br. J. Ophthalmol. 1986;70:808. doi: 10.1136/bjo.70.11.808. [DOI] [PMC free article] [PubMed] [Google Scholar]
- 6.Feeney-Burns L, Berman ER, Rothman H. Am. J. Ophthalmol. 1980;90:783. doi: 10.1016/s0002-9394(14)75193-1. [DOI] [PubMed] [Google Scholar]
- 7.Wing GL, Blanchard GC, Weiter JJ. Invest. Ophthalmol. Visual Sci. 1978;17:601. [PubMed] [Google Scholar]
- 8.Lakkaraju A, Finnemann SC, Rodriguez-Boulan E. Proc. Natl. Acad. Sci. U.S.A. 2007;104:11026. doi: 10.1073/pnas.0702504104. [DOI] [PMC free article] [PubMed] [Google Scholar]
- 9.Rattner A, Nathans J. Nat. Rev. Neurosci. 2006;7:860. doi: 10.1038/nrn2007. [DOI] [PubMed] [Google Scholar]
- 10.Hageman GS, Luthert PJ, Chong NHV, Johnson LV, Anderson DH, Mullins RF. Prog. Retin. Eye Res. 2001;20:705. doi: 10.1016/s1350-9462(01)00010-6. [DOI] [PubMed] [Google Scholar]
- 11.Friedlander SK. Smoke, Haze and Dust: Fundamentals of Aerosol Behavior. New York: Wiley; 1977. [Google Scholar]
- 12.Family F, Landau DP, editors. Kinetics of Aggregation and Gelation. North-Holland: Amsterdam; 1984. [Google Scholar]
- 13.Stanley HE, Family F, Gould H. J. Polymer Sci. 1985;73:19. [Google Scholar]
- 14.Family F, Vicsek T. Dynamics of Fractal Surfaces. Singapore: World Scientific; 1991. [Google Scholar]
- 15.Barabási A-L, Stanley HE. Fractal Concepts in Surface Growth. Cambridge: Cambridge University Press; 1995. [Google Scholar]
- 16.Zhang ZY, Lagally MG. Science. 1997;276:377. doi: 10.1126/science.276.5311.377. [DOI] [PubMed] [Google Scholar]
- 17.Biscarini F, Zamboni R, Samori P, Ostoja P, Taliani C. Phys. Rev. B. 1995;52:14868. doi: 10.1103/physrevb.52.14868. [DOI] [PubMed] [Google Scholar]
- 18.Brinkmann M, Biscarini F, Taliani C, Aiello I, Ghedini M. Phys. Rev. B. 2000;61:R16339. [Google Scholar]
- 19.Meyer zu Heringdorf F-J, Reuter MC, Tromp RM. Nature (London) 2001;412:517. doi: 10.1038/35087532. [DOI] [PubMed] [Google Scholar]
- 20.Pimpenelli A, Villain J, editors. Physics of Crystal Growth. Cambridge: Cambridge University Press; 1999. [Google Scholar]
- 21.Seiden PE, Schulman LS. Adv. Phys. 1990;39:1. [Google Scholar]
- 22.Herrmann HJ, Helbing D, Schreckenberg M, Wolf DE, editors. Traffic and Granular Flow. Berlin: Springer; 2000. [Google Scholar]
- 23.Viscsek T, editor. Fluctuations and Scaling in Biology. Oxford: Oxford University Press; 2001. [Google Scholar]
- 24.Berg HC. Phys. Today. 2000;53:24. [Google Scholar]
- 25.Ben-Jacob E. In: Systems Biology: The Challenge of Complexity. Nakanishi S, Kageyama R, Watanabe D, editors. Berlin: Springer-Verlag; 2009. pp. 25–35. [Google Scholar]
- 26.Young RW, Bok D. J. Cell Biol. 1969;42:392. doi: 10.1083/jcb.42.2.392. [DOI] [PMC free article] [PubMed] [Google Scholar]
- 27.Marshall J. Eye-Transactions of the Ophthalmological Societies of the United Kingdom. 1987;1:282. [Google Scholar]
- 28.Schmitz-Valckenberg S, Holz FG, Bird AC, Spaide RF. J. Ret. & Vit. Dis. 2008;28:385. doi: 10.1097/IAE.0b013e318164a907. [DOI] [PubMed] [Google Scholar]
- 29.Eldred G. Gerontology. 1995;41:15. doi: 10.1159/000213722. [DOI] [PubMed] [Google Scholar]
- 30.Wihlmark U, Wrigstad A, Roberg K, Nilsson SE, Brunk UT. Free Radic Biol. Med. 1997;22:1229. doi: 10.1016/s0891-5849(96)00555-2. [DOI] [PubMed] [Google Scholar]
- 31.Suter M, Remé C, Grimm C, Wenzel A, Jäattela M, Esser P, Kociok N, Leist M, Richter C. J. Biol. Chem. 2000;275:39625. doi: 10.1074/jbc.M007049200. [DOI] [PubMed] [Google Scholar]
- 32.Feeney-Burns L, Hilderbrand ES, Eldridge S. Invest. Ophthalmol. Visual Sci. 1984;25:195. [PubMed] [Google Scholar]
- 33.Merks RMH, Perryn ED, Glazier JA. PLOS Comput. Biol. 2008;4:e1000163. doi: 10.1371/journal.pcbi.1000163. [DOI] [PMC free article] [PubMed] [Google Scholar]
- 34.Warburg O. Biochem. Z. 1927;184:484. [Google Scholar]
- 35.Linsenmeier RA. J. Gen. Physiol. 1986;88:521. doi: 10.1085/jgp.88.4.521. [DOI] [PMC free article] [PubMed] [Google Scholar]
- 36.de Jong PTVM. N. Engl. J. Med. 2006;355:1474. doi: 10.1056/NEJMra062326. [DOI] [PubMed] [Google Scholar]
- 37.Sparrow JR, Vollmer-Snarr HR, Zhou JL, Jang YP, Jockusch S, Itagaki Y, Nakanishi K. J. Biol. Chem. 2003;278:18207. doi: 10.1074/jbc.M300457200. [DOI] [PubMed] [Google Scholar]
- 38.Finnemann SC, Leung LW, Rodriguez-Boulan E. Proc. Natl. Acad. Sci. U.S.A. 2002;99:3842. doi: 10.1073/pnas.052025899. [DOI] [PMC free article] [PubMed] [Google Scholar]
- 39.Howard J. Mechanics of Motor Proteins and the Cytoskeleton. Sunderland, MA: Sinauer Associates Inc., Publishers; 2001. [Google Scholar]
- 40.Luby-Phelps K, Castle PE, Taylor DL, Lanni F. Proc. Natl. Acad. Sci. U.S.A. 1987;84:4910. doi: 10.1073/pnas.84.14.4910. [DOI] [PMC free article] [PubMed] [Google Scholar]
- 41.Alberts B, Johnson A, Lewis J, Raff M, Roberts K, Walter P, editors. Molecular Biology of the Cell. New York: Garland Science; 2002. [Google Scholar]
- 42.Huang JD, Curcio CA, Johnson M. Invest. Ophthalmol. Visual Sci. 2008;49:2721. doi: 10.1167/iovs.07-1196. [DOI] [PMC free article] [PubMed] [Google Scholar]
- 43.Bindewald-Wittich A, Han M, Schmitz-Valckenberg S, Snyder SR, Giese G, Bille JF, Holz FG. Invest. Ophthalmol. Visual Sci. 2006;47:4553. doi: 10.1167/iovs.05-1562. [DOI] [PubMed] [Google Scholar]
- 44.Vicsek T. Fractal Growth Phenomena. Singapore: World Scientific Publishing Co. Pte. Ltd.; 1992. [Google Scholar]
- 45.Vicsek T, Meakin P, Family F. Phys. Rev. A. 1985;32:1122. doi: 10.1103/physreva.32.1122. [DOI] [PubMed] [Google Scholar]
- 46.Meakin P. Fractal, Scaling and Growth Far from Equilibrium. Cambridge: Cambridge University Press; 1998. [Google Scholar]
- 47.Vicsek T, Family F. Phys. Rev. Lett. 1984;52:1669. [Google Scholar]
- 48.Amar JG, Family F, Lam PM. Phys. Rev. B. 1994;50:8781. doi: 10.1103/physrevb.50.8781. [DOI] [PubMed] [Google Scholar]
- 49.Family F, Meakin P. Phys. Rev. Lett. 1988;61:428. doi: 10.1103/PhysRevLett.61.428. [DOI] [PubMed] [Google Scholar]
- 50.Zinke-Allmang M, Feldman LC, Grabow MH. Surf. Sci. Rep. 1992;16:377. [Google Scholar]
- 51.Bindewald A, et al. Invest. Ophthalmol. Visual Sci. 2005;46:3309. doi: 10.1167/iovs.04-0430. [DOI] [PubMed] [Google Scholar]
- 52.Schmitz-Valckenberg S, Bindewald-Wittich A, Dolar-Szczasny J, Dreyhaupt J, Wolf S, Scholl HPN, Holz FG. Invest. Ophthalmol. Visual Sci. 2006;47:2648. doi: 10.1167/iovs.05-0892. [DOI] [PubMed] [Google Scholar]
- 53.Schweitzer D, Schenke S, Hammer M, Schweitzer F, Jentsch S, Birckner E, Becker W, Bergmann A. Microsc. Res. Tech. 2007;70:410. doi: 10.1002/jemt.20427. [DOI] [PubMed] [Google Scholar]
- 54.Gunduz K, Pulido JS, Ezzat K, Salomao D, Hann C. Eye. 2009;23:497. doi: 10.1038/eye.2008.244. [DOI] [PubMed] [Google Scholar]
- 55.Klein ML, Ferris FL, Armstrong J, Hwang TS, Chew EY, Bressler SB, Chandra SR. Ophthalmology. 2008;115:1026. doi: 10.1016/j.ophtha.2007.08.030. [DOI] [PubMed] [Google Scholar]
- 56.Vaclavik V, Vujosevic S, Dandekar SS, Bunce C, Peto T, Bird AC. Ophthalmology. 2008;115:342. doi: 10.1016/j.ophtha.2007.04.023. [DOI] [PubMed] [Google Scholar]
- 57.Delori FC, Goger DG, Dorey CK. Invest. Ophthalmol. Visual Sci. 2001;42:1855. [PubMed] [Google Scholar]
- 58.Delori FC, Dorey CK, Staurenghi G, Arent O, Goger DG, Weiter JJ. Invest. Ophthalmol. Visual Sci. 1995;36:718. [PubMed] [Google Scholar]
- 59.Schmitz-Valckenberg S, Fleckenstein M, Scholl H, Holz F. Surv. Ophthalmol. 2009;54:96. doi: 10.1016/j.survophthal.2008.10.004. [DOI] [PubMed] [Google Scholar]
- 60.Feher J, Kovacs I, Artico M, Cavallotti C, Papale A, Gabrieli CB. Neurobiol. Aging. 2006;27:983. doi: 10.1016/j.neurobiolaging.2005.05.012. [DOI] [PubMed] [Google Scholar]


