

Abstract
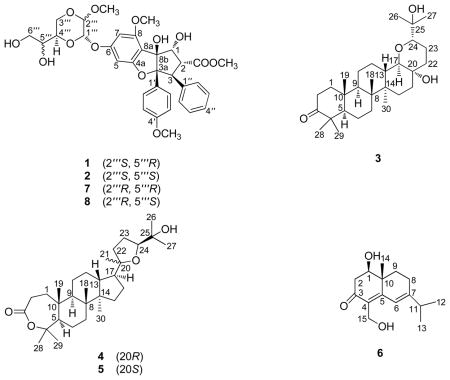
Two new minor silvestrol analogues [2‴-epi-silvestrol (1) and 2‴,5‴-diepi-silvestrol (2)], together with a new 21-norbaccharane-type triterpene (3), two new 3,4-seco-dammarane triterpenes (4 and 5), and a new eudesmane sesquiterpene (6), as well as nine known compounds, were isolated from a large-scale recollection of the CHCl3-soluble extract of the stem bark of Aglaia foveolata obtained in Kalimantan, Indonesia. The structures of the new compounds were established by interpretation of their spectroscopic data. All of the isolates were tested for cytotoxicity against HT-29 cells. The new silvestrol analogues, 1 and 2, were considerably less active as cytotoxic agents than silvestrol (7) and episilvestrol (5‴-epi-silvestrol) (8), against this cell line, showing the importance of the configuration at C-2‴ in mediating such activity within this compound class. Several of the compounds isolated were also evaluated in a NF-κB (p65) inhibition assay.
Silvestrol, a rocaglate derivative possessing a dioxanyloxy unit affixed to a cyclopenta[b]benzofuran skeleton, and its 5‴S epimer, episilvestrol, were isolated from the tropical tree Aglaia foveolata Pannell (Meliaceae) and fully characterized by Hwang et al. in 2004. The structure and absolute configuration of silvestrol were confirmed by single-crystal X-ray crystallography.1 Silvestrol was found to possess comparable cytotoxic potencies for a small panel of human cancer cell lines to those of the well-known anticancer compounds, paclitaxel (Taxol) and camptothecin, and was further demonstrated as being active in the in vivo hollow fiber assay. This compound also showed activity in the P-388 lymphocytic leukemia test system in vivo, when administered both ip and iv.1 In addition, silvestrol has been documented as an antineoplastic constituent of Aglaia leptantha, using human PC-3 prostate cancer cells in a murine xenograft experiment, but with only the planar structure of the dioxanyl ring moiety reported.2
In preliminary mechanistic studies, Swanson and associates demonstrated that silvestrol produces a p53-independent cell-cycle blockage at the G2/M check-point, using LNCaP human prostate cells.3 In a follow-up investigation, silvestrol was shown to induce apoptosis in LNCaP cells via the involvement of caspases 2, 9 and 10, but not caspases 3 and 7.4 More recently, silvestrol was found to exhibit B-cell selectivity in both chronic lymphocytic leukemia and acute lymphocytic leukemia models.5 Silvestrol was observed to cause an early reduction in Mcl-1 expression in chronic lymphocytic leukemia cells from patients.5 Additional mechanistic investigation has indicated that silvestrol causes increased apoptosis, decreased proliferation, and inhibition of angiogenesis, and it inhibits the translation of malignancy-related mRNA by regulating the activity of initiation factor elF4A.6,7 The total synthesis of silvestrol has been accomplished independently by two different groups.8–10
The presence of the substituted 1,4-dioxanyloxy moiety in the silvestrol structure appears to be unique in nature, and has been found essential for the exhibition of potent biological activity when compared with rocaglate derivatives lacking this functionality.1,11 Thus far, only silvestrol and episilvestrol (5‴-epi-silvestrol) have been isolated with this structural feature among the cyclopenta[b]benzofuran derivatives from species in the genus Aglaia.1,2,11
Previous phytochemical work on the different plant parts of A. foveolata, collected in Kalimantan, Indonesia, has demonstrated that silvestrol occurs in the fruits, leaves, stem bark, and twigs of this species, with the highest yield (0.02% w/w) occurring in the stem bark.1,12 In the present study, a large-scale recollection of the stem bark of A. foveolata from Kalimanatan, Indonesia was conducted to afford the scale up isolation of silvestrol at the gram level, in order for more extensive biological testing to be performed. While this re-isolation work was underway, an opportunity was taken to search for the presence of minor new analogues of silvestrol.
Cytotoxicity assay-guided fractionation of the CHCl3-soluble extract of the stem bark of A. foveolata led to the isolation of two new minor silvestrol analogues (1 and 2), three new triterpenoids (3–5), and a new sesquiterpene (6), as well as nine known compounds. The structures of compounds 1–6 were established by spectroscopic data interpretation. Besides silvestrol and episilvestrol, the other known compounds were identified as 17,24-epoxy-25-hydroxybaccharan-3-one,1 17,24-epoxy-25-hydroxy-21-methoxy-3,4-seco-baccharane,12 eichlerianic acid,13 cabraleone,13 foveolin A,13 methyl foveolate A (dymalol),14 (−)-dehydrodiconiferyl alcohol,15 and 3-oxo-15-hydroxy-T-muurolol,16 by comparison of their spectroscopic data with published values. All of the isolates were tested for cytotoxicity against the human colon cancer cell line (HT-29). The new compounds 3–6, together with silvestrol and episilvestrol, were also evaluated in a NF-κB (p65) inhibition assay.
Results and Discussion
Compound 1 was obtained as a colorless gum with a negative specific rotation ([α]20D −33.5, c 0.05, MeOH), and afforded a sodiated molecular ion peak at m/z 677.2233 [M + Na]+ in the HRESIMS, corresponding to a molecular formula of C34H38O13, the same as silvestrol. The 1H and 13C NMR spectra of compound 1 were observed to be very similar to those of silvestrol and episilvestrol.1 In the 1H NMR spectrum, 11 proton signals were detected in the low-field range from δH 6.30 to 7.20 ppm, and were recognized as belonging to three aromatic rings, including two meta-coupled aromatic signals at δH 6.40 (1H, d, J = 1.8 Hz, H-7) and 6.48 (1H, d, J = 1.8 Hz, H-5), four AA′BB′-coupled proton signals of a 1,4-disubstituted phenyl group at δH 6.69 (2H, d, J = 9.0 Hz, H-3′ and H-5′) and 7.07 (2H, d, J = 9.0 Hz, H-2′ and H-6′), and proton signals of a monosubstituted phenyl ring at δH 6.84 (2H, m, H-2″ and H-6″) and 7.07 (3H, m, H-3″, 4″ and H-5″). The chemical shifts at δH 5.04 (1H, d, J = 7.2 Hz, H-1), 3.90 (1H, dd, J = 14.4, 6.6 Hz, H-2), and 4.27 (1H, d, J = 14.4 Hz, H-3) are typical signals of H-1, H-2 and H-3 of the five-membered carbocyclic ring of a cyclopenta[b]benzofuran unit (Table 1).1 The above analysis of the 1H NMR spectrum suggested the presence of a rocaglate unit in the molecule of 1.1 In the 13C NMR spectrum of this compound, which was sorted using its DEPT and HSQC spectra, seven quaternary carbons at δC 160.4 (C-4a), 160.0 (C-6), 157.1 (C-8), 109.6 (C-8a), 126.6 (C-1′), 158.8 (C-4′), and 136.7 (C-1″) were found to be consistent with the occurrence of the three substituted benzene rings indicated above. The observed resonances of two oxygenated quaternary carbons at δC 101.9 (C-3a) and 93.4 (C-8b), two oxymethine groups at δC 79.7 (C-1) and 50.2 (C-2), as well as an alkyl methine group at δC 55.0 (C-3), are characteristic for a cyclopenta[b]benzofuran moiety.1 Besides the rocaglate feature, the presence in 1 of an unusual [6-(1,2-dihydroxyethyl)-3-methoxy-1,4-dioxan-2yl]oxy feature was also recognized, based on the observation of oxygenated proton signals at δH 5.40 (1H, brs, H-1‴), 4.65 (1H, d, J = 1.2 Hz, H-2‴), 4.04 (1H, dd, J = 12.6, 3.0, H-3α‴), 4.01 (1H, t, J = 11.0, H-3β‴), 4.18 (1H, brd, J = 10.2 Hz, H-4‴), 3.70 (1H, brs, H-5‴), 3.66 (1H, d, J = 10.8 Hz, Ha-6‴), and 3.68 (1H, d, J = 10.8 Hz, Hb-6‴) in the 1H NMR spectrum, as well as signals of four oxymethine carbons at δC 93.5 (C-1‴), 98.8 (C-2‴), 68.3 (C-4‴) and 70.2 (C-5‴), and two oxymethylenes at δC 66.5 (C-3‴) and 63.7 (C-6‴) in the 13C NMR spectrum (Table 1). All of this information suggested that compound 1 is an isomer of silvestrol. By comparison of the 1H NMR data of these two compounds, the major differences were evident in the 1,4-dioxanyloxy ring. A downfield shift of the methoxy group at C-2‴ from δH 3.48 to δH 3.63 was clearly discernible for 1. Moreover, downfield shifts of 0.18 ppm for H-1‴, 0.09 ppm for H-2‴, and 0.51 ppm for H-3α‴, as well as an upfield shift of 0.10 ppm for H-3β‴, were also observed. For the rocaglate moiety of 1, most proton signals were found to be almost identical to those of silvestrol, except for H-7 and H-5, two aromatic protons spatially close to the 1,4-dioxanyloxy ring, for which slight downfield shifts of 0.13 ppm and 0.08 ppm, respectively, were observed. These subtle differences supported the inference to be made that the methoxy group at C-2‴ on the 1,4-dioxanyloxy ring in 1 adopts an α-equatorial orientation rather than a β-axial orientation as in silvestrol. This presumption was consistent with the downfield shift of approximately 7.5 ppm for the carbon signal of C-3‴ (δC 66.5) in the 13C NMR spectrum, due to the absence of the cis-γ substitution effect of the methoxy group on C-2‴ to H-3β‴. Furthermore, the α position of the methoxy group on C-2‴ was confirmed by the key NOE effects between H-2‴ with H-3β‴. Additional perusal of the 1H NMR spectrum indicated that the proton signals of H-3α‴ (δH 4.04, 1H, dd, J = 12.0, 3.0 Hz), H-3β‴ (δH 4.01, 1H, t, J = 11.0 Hz), H-4‴ (δH 4.18, brd, J = 10.2 Hz), and H-5‴ (3.70, brs) adopted comparable splitting patterns and exhibited similar coupling constants as for silvestrol (7), suggesting the configurations of C-4‴ and C-5‴ to be the same for both substances. This deduction was consistent with the analysis of the NOESY spectrum (Figure 1). Thus, the structure of compound 1 was determined to be 2‴-epi-silvestrol.
Table 1.
1H and 13C NMR Spectroscopic Data of Compounds 1 and 2a
| position | 1 |
2 |
||
|---|---|---|---|---|
| δH, (J in Hz) | δC | δH, (J in Hz) | δC | |
| 1 | 5.04, d (7.2) | 79.7 | 5.04, d (7.2) | 79.7 |
| 2 | 3.90, dd (14.4, 6.6) | 50.4 | 3.90, dd (14.4, 6.6) | 50.2 |
| 3 | 4.27, d (14.4) | 55.0 | 4.28, d (14.4) | 55.0 |
| 3a | 101.9 | 101.9 | ||
| 4a | 160.4 | 160.6 | ||
| 5 | 6.48, d (1.8) | 92.7 | 6.48, d (1.8) | 92.9 |
| 6 | 160.0 | 160.0 | ||
| 7 | 6.40, d (1.8) | 95.2 | 6.40, d (1.8) | 95.4 |
| 8 | 157.1 | 157.1 | ||
| 8a | 109.6 | 109.6 | ||
| 8b | 93.3 | 93.4 | ||
| 1′ | 126.6 | 126.6 | ||
| 2′,6′ | 7.09, d (9.0) | 129.0 | 7.09, d (9.0) | 129.0 |
| 3′,5′ | 6.69, d (9.0) | 112.8 | 6.69, d (9.0) | 112.8 |
| 4′ | 158.8 | 158.8 | ||
| 1″ | 136.7 | 136.7 | ||
| 2″,6″ | 6.84, m | 127.8 | 6.85, m | 127.8 |
| 3″,5″ | 7.05, m | 127.8 | 7.05, m | 127.8 |
| 4″ | 7.05, m | 126.6 | 7.06, m | 126.6 |
| 1‴ | 5.40, brs | 93.5 | 5.36, brs | 92.7 |
| 2‴ | 4.65, d (1.2) | 98.8 | 4.63, d (1.2) | 98.9 |
| 3‴α | 4.04, brd (12.0, 3.0) | 66.5 | 4.24, dd (11.4, 1.8) | 67.2 |
| 3‴β | 4.01, t (11.0) | 3.82, t (11.4) | ||
| 4‴ | 4.18, brd (10.2) | 68.3 | 4.05, ddd (9.6, 7.8, 1.8) | 67.4 |
| 5‴ | 3.70, brs | 70.2 | 3.58, dd (10.8, 6.0) | 71.2 |
| 6‴ | 3.66, d (10.8) | 63.7 | 3.59–3.61, m | 62.7 |
| 3.68, d (10.8) | 3.74, brd (10.8) | |||
| COOCH3-2 | 170.6 | 170.6 | ||
| 3.65, s | 52.1 | 3.65, s | 52.1 | |
| OCH3-8 | 3.87, s | 56.0 | 3.87, s | 56.0 |
| OCH3-4′ | 3.72, s | 55.1 | 3.72, s | 55.1 |
| OCH3-2‴ | 3.63, s | 57.4 | 3.63, s | 57.3 |
1H NMR spectrum measured at 600 MHz, 13C NMR spectrum measured at 150 MHz; obtained in CDCl3 with TMS as internal standard. Assignments supported with HSQC and HMBC NMR spectra.
Figure 1.
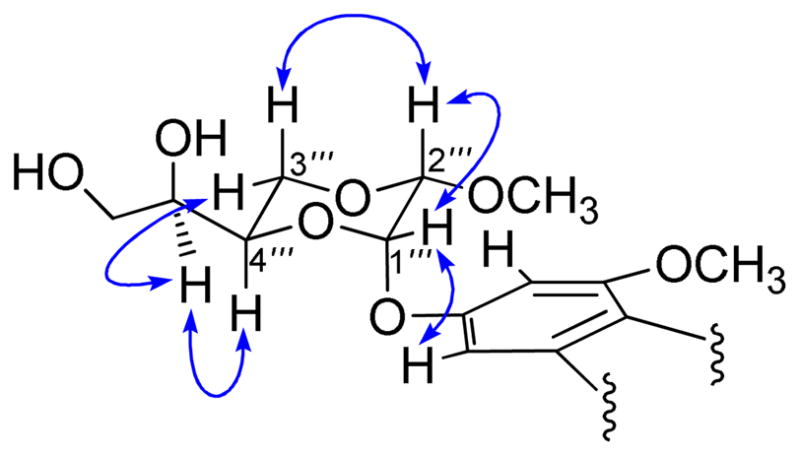
Selected NOESY ( ) correlations
observed for 1.
) correlations
observed for 1.
The HRESIMS of compound 2 showed a sodiated molecular ion peak at m/z 677.2212, corresponding to a molecular formula of C34H38O13Na, the same as that of compound 1. The NMR spectrum of compound 2 exhibited a very close resemblance to that of compound 1, and could be recognized as a second new silvestrol isomer (Table 1). The same α-orientation of the methoxy group on the 1,4-dioxane ring of 2 was deduced by the analysis of its 1D and 2D NMR spectroscopic data and by comparison with those of compound 1. The major differences between compounds 1 and 2 were evident in the ethane 1,2-diol functionality on the 1,4-dioxanyloxy moiety. In the 1H NMR spectrum of compound 2, the proton signals of H-3α‴ (δH 4.24, 1H, dd, J = 11.4, 1.8 Hz) and H-3β‴ (δH 3.82, 1H, t, J = 11.4 Hz) adopted a similar coupling pattern as in compound 1 and silvestrol, while the splitting patterns of H-4‴ (δH 4.05, ddd, J = 9.6, 7.8, 1.8) and H-5‴ (δH 3.58, 1H, dd, J = 10.8, 6.0 Hz), were comparable with those of the known 5‴-epimer of silvestrol (episilvestrol).1 Thus, compound 2 was determined to be 2‴,5‴-diepi-silvestrol. This structural proposal was confirmed by analysis of its HSQC, HMBC and NOESY 2D-NMR spectra.
Compound 3 was obtained as a white amorphous powder with a molecular formula of C29H48O4, as determined from the sodiated molecular ion peak at m/z 483.3431 [M + Na]+ in the HRESIMS. The 1H NMR spectrum of 3 exhibited signals for seven tertiary methyl groups at δH 0.96 (3H, s, H-19), 0.98 (3H, s, H-30), 1.03 (3H, s, H-29), 1.07 (3H, s, H-18), 1.08 (3H, s, H-28), 1.16 (3H, s, H-26), and 1.20 (3H, s, H-27), two typical methine protons at δH 3.26 (1H, d, J = 12.0 Hz) and 3.48 (1H, d, J = 11.4 Hz), and a group of highly overlapped alkyl protons in the high field that occurred in the range from δH 1.20 to δH 2.60 (Table 2). Altogether, 29 carbon signals in the 13C NMR spectrum were sorted by DEPT and HSQC into seven methyls, ten methylenes, three methines, four quaternary carbons, two oxygenated methines (δC 73.8, C-17 and 81.9, C-24), two quaternary oxygenated carbons (δC 69.2, C-20 and 71.9, C-25), and a ketone group (δC 217.7, C-3) (Table 3). These characteristic signals as observed in the 1H NMR and 13C NMR spectra were comparable with those of 17,24-epoxy-25-hydroxybaccharan-3-one, which is a baccharane-type triterpene first isolated from A. foveolata in an earlier study, and structurally confirmed by X-ray crystallographic analysis.1 Comparison of the 1H NMR and 13C NMR spectroscopic data of 3 with those of this known compound revealed that the only difference was the absence of a tertiary methyl group (C-21) at C-20, and the presence of an oxygenated quaternary carbon (δC 69.2) instead of an alkyl quaternary carbon. The above observations, together with the molecular formula discerned from the HRESIMS, suggested that compound 3 is a baccharane-type nor-triterpene, with the C-21 methyl group having been replaced by a hydroxy group. In order to obtain further information on the free hydroxy groups attached at the quaternary carbons, CDCl3 and DMSO-d6 were both used as NMR solvent. In the 1H NMR spectrum with DMSO-d6 as solvent, the hydroxy proton signals at C-20 and C-24 appeared at δH 4.17 and 3.97, respectively. HMBC correlations were observed between the signal for OH-20 and C-20, C-17, C-16 and C-22, and between OH-24 with C-25, C-26 and C-27, and confirmed the locations of these two hydroxy groups (Figure 2). In the NOESY spectrum, enhancements between OH-20 with H-17, H-22α and H-23α suggested an α-orientation of OH-20. In addition, NOE effects were also observed between CH3-19 and CH3-18, CH3-18 and H-13, H-17 and CH3-30, as well as H-24 and H-22β, which were consistent with the relative configuration of the known baccharane-type triterpenes (Figure 2).1 In the CD spectrum of 3, a positive n-π* Cotton effect was found around 289 nm, suggesting that this compound adopts the same absolute configuration as found in structurally closely related 3-oxotriterpenoids.17,18 Accordingly, the structure of compound 3 was elucidated as 17,24-epoxy-20α,25-dihydroxy-21-norbaccharan-3-one.
Table 2.
1H NMR Chemical Shifts of Compounds 3–6a
| position | 3 | 4 | 5 | 6 |
|---|---|---|---|---|
| 1 | 1.48b | 1.62b | 1.63b | 3.88, m |
| 1.95, m | 1.82b | 1.82b | ||
| 2 | 2.46b | 2.65, td (14.0, 4.6) | 2.67, td (14.0, 4.5) | Hα, 2.72, dd (6.1, 17.3) |
| 2.50, ddd (14.2, 5.7, 3.5) | 2.52, ddd (14.2, 5.7, 3.5) | Hβ, 2.72, dd (12.1, 17.3) | ||
| 5 | 1.35b | 1.78b | 1.80b | |
| 6 | 1.50b | 1.43b | 1.44b | 6.46, s |
| 1.77b | 1.77b | |||
| 7 | 1.42b | 1.30b | 1.31b | |
| 8 | 2.30, m | |||
| 9 | 1.43b | 1.42b | 1.42b | Hα, 1.43,ddd (6.0, 5.7, 12.5) |
| Hβ, 2.16, ddd (2.0, 5.0, 12.8) | ||||
| 11 | 1.35b | 1.55b | 1.55b | 2.46, hep (6.6) |
| 1.55b | 1.26b | 1.26b | ||
| 12 | 1.19b | 1.10b | 1.12, d (6.8) | |
| 2.03, brd (10.0) | 1.86b | 1.12, d (6.8) | ||
| 13 | 2.07, td (12.0, 3.0) | 1.75b | 1.70b | |
| 14 | 1.09, s | |||
| 15 | 1.58b | 1.10b | 1.10b | 4.45, brs |
| 1.20b | 1.45b | 1.45b | ||
| 16 | 1.60b | 1.30b | 1.30b | |
| 1.75b | 1.78b | 1.78b | ||
| 17 | 3.48, d (11.4) | 1.79b | 1.91b | |
| 18 | 1.07, s | 1.02, s | 1.05, s | |
| 19 | 0.96, s | 1.08, s | 1.10, s | |
| 21 | 1.15, s | 1.17, s | ||
| 22 | Hα1.48b | 1.71b | 1.71b | |
| Hβ2.03, td (13.2, 4.8) | ||||
| 23 | Hβ 1.56b | 1.80b | 1.88b | |
| Hα 1.73b | 1.82b | |||
| 24 | 3.26, d (12.0) | 3.77, t (7.2) | 3.65, dd (9.9, 5.6) | |
| 26 | 1.16, s | 1.20, s | 1.21, s | |
| 27 | 1.20, s | 1.10, s | 1.13, s | |
| 28 | 1.08, s | 1.48, s | 1.50, s | |
| 29 | 1.03, s | 1.40, s | 1.42, s | |
| 30 | 0.98, s | 0.86, s | 0.88, s |
Measured at 600 MHz and obtained in CDCl3 with TMS as internal standard; J values (Hz) are given in parentheses. Assignments supported with 1H-1H COSY, HSQC, and HMBC spectra.
Multiplicity patterns unclear due to signal overlapping.
Table 3.
13C NMR Chemical Shifts of Compounds 3–6a
| position | 3 | 4 | 5 | 6 |
|---|---|---|---|---|
| 1 | 39.7 | 40.7 | 40.3 | 71.8 |
| 2 | 34.0 | 32.8 | 32.4 | 42.4 |
| 3 | 217.7 | 175.5 | 175.0 | 198.7 |
| 4 | 47.3 | 86.4 | 86.0 | 129.4 |
| 5 | 54.9 | 53.5 | 53.1 | 157.9 |
| 6 | 19.6 | 23.9 | 23.6 | 116.9 |
| 7 | 33.0 | 34.6 | 34.2 | 160.3 |
| 8 | 42.4 | 40.5 | 40.2 | 23.7 |
| 9 | 50.0 | 51.7 | 51.4 | 32.0 |
| 10 | 36.9 | 39.7 | 39.3 | 38.7 |
| 11 | 21.2 | 23.1 | 23.0 | 36.4 |
| 12 | 23.7 | 27.3 | 27.2 | 21.4 |
| 13 | 35.2 | 43.5 | 43.1 | 20.8 |
| 14 | 40.8 | 50.2 | 49.9 | 56.2 |
| 15 | 27.5 | 31.4 | 30.9 | 15.0 |
| 16 | 33.8 | 26.1 | 25.7 | |
| 17 | 81.9 | 50.3 | 49.6 | |
| 18 | 15.6 | 15.3 | 14.9 | |
| 19 | 16.2 | 18.8 | 18.4 | |
| 20 | 69.2 | 86.8 | 86.5 | |
| 21 | - | 22.1 | 27.2 | |
| 22 | 29.1 | 37.8 | 34.8 | |
| 23 | 20.1 | 26.2 | 26.3 | |
| 24 | 73.8 | 84.9 | 86.4 | |
| 25 | 71.9 | 71.5 | 70.2 | |
| 26 | 24.0 | 27.6 | 27.8 | |
| 27 | 26.3 | 24.4 | 24.0 | |
| 28 | 26.8 | 31.3 | 30.9 | |
| 29 | 21.0 | 26.7 | 26.9 | |
| 30 | 14.4 | 16.2 | 16.1 |
Measured at 150 MHz and obtained in CDCl3 with TMS as internal standard. Assignments supported with HSQC and HMBC NMR spectra.
Figure 2.
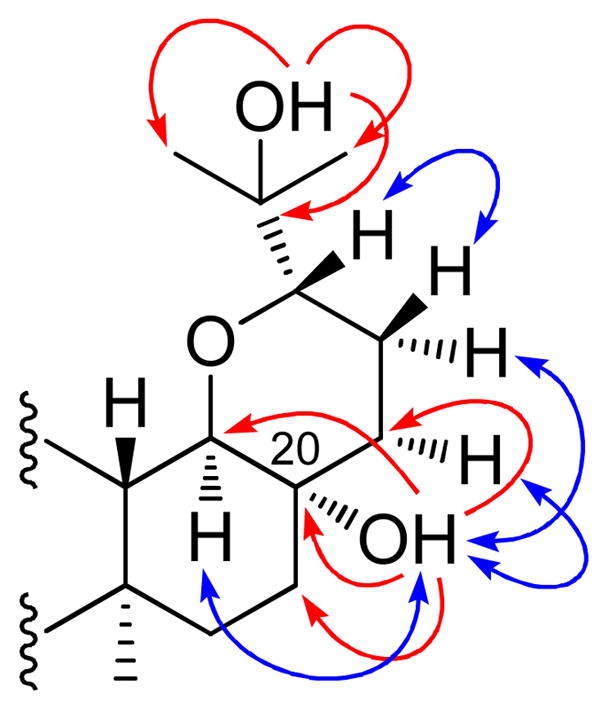
Selected HMBC ( ) and NOESY
() correlations observed
for 3.
) and NOESY
() correlations observed
for 3.
Compound 4 was obtained as a white amorphous resin. The molecular formula was determined to be C30H50O4, based on the sodiated molecular ion peak at m/z 497.3651 [M + Na]+ in the HRESIMS. Its 1H NMR spectrum exhibited signals for eight tertiary methyl groups at δH 0.86 (3H, s, H-30), 1.02 (3H, s, H-18), 1.08 (3H, s, H-19), 1.10 (3H, s, H-27), 1.15 (3H, s, H-21), 1.20 (3H, s, H-26), 1.40 (3H, s, H-29), and 1.48 (3H, s, H-28), an oxygen-bearing methine group at δH 3.77 (1H, t, J = 6.9 Hz, H-24), a methylene vicinal to a carbonyl group at δH 2.65 (1H, td, J = 14.0, 4.6, H-2α) and 2.50 (1H, ddd, J = 14.2, 5.7, 3.5, H-2β), and a number of alkyl protons in the high-field region at δH 1.0-2.2 ppm (Table 2). The 30 carbon signals in the 13C NMR spectrum were classified by DEPT and HSQC NMR experiments into eight methyls, ten methylenes, four methines, three quaternary carbons, four-oxygen bearing carbons (including one secondary and three tertiary), and a carbonyl group. The NMR data of compound 4 were characteristic of the resonances of a 3,4-secodammarane derivative with a tetrahydrofuran (20,24-epoxy) ring formed by the closure of a side chain attached to the D ring.11,17 Compounds based on this triterpenoid skeleton have been obtained previously from certain species belonging to the genera Aglaia and Cabralea of the plant family Meliaceae.11,17 On comparing the NMR data of 4 with those of the structurally closely related known compound foveolin B, a known constituent of A. foveolata, it was revealed that the major differences were evident in the A ring.11 In the 13C NMR spectrum, the signals of the methylene groups at C-1 and C-2 were shifted downfield by 5.8 and 5.0 ppm, respectively, while the C-3 carbonyl group resonance was shifted upfield by 4.2 ppm. In turn, the signal of the quaternary oxygenated C-4 carbon was also shifted downfield by nearly 10 ppm. These differences, together with the molecular formula of compound 4, suggested the possibility of an ester bond between the carbonyl group of C-3 and the quaternary oxygenated carbon of C-4, resulting in the closure of the 3,4-seco ring to form a seven-membered lactone. In the HMBC spectrum, correlations were observed between H-1, H-2, CH3-28 and CH3-29 with the carbonyl group (δC 175.5, C-3), between CH3-28 and CH3-29 with C-4 and C-5, between CH3-19 with C-1, C-10 and C-9, and provided confirmatory evidence for this proposal (Figure 3). According to the previous literature, 13C NMR chemical shifts of the carbons of the epoxide ring, as well as the coupling pattern of H-24, have been used to determine the absolute configuration of the 20,14-epoxy group of 3,4-secodammarane derivatives.13 In the 13C NMR spectrum of 4, the signals of C-20, C-21, C-22, C-23, and C-24 appeared at δC 86.8, 22.1, 37.8, 26.2, and 84.9, respectively (Table 3). In turn, in the 1H NMR spectrum, the H-24 signal was exhibited as a triplet with a J value of 6.8 Hz. This information was supportive of a 20R, 24S configuration of the epoxy group, as described previously.13 These assignments were supported by the key NOESY correlations between CH3-21 and H-17, and H-24, respectively. Additional NOE cross peaks of H-5 and H-9, H-9 and CH3-30, CH3-18 and CH3-19, H-13 and CH3-19, and H-17 and CH3-30 were used to establish the relative configuration of the remaining stereocenters of compound 4 (Figure 3), which were identical to those of known derivatives.13,19 Thus, the structure of compound 4 was determined to be 20R,24S-epoxy-25-hydroxy-A-homo-4-oxadammaran-3-one.
Figure 3.

Selected HMBC () and NOESY
() correlations observed
for 4 and 5.
The molecular formula of compound 5 was determined to be C30H50O4, the same as that of compound 4, from the sodiated molecular ion peak at m/z 497.3639 in the HRESIMS. The 1H and 13C NMR spectra of 5 were almost identical to those of 4 except for some slight but distinctive differences in the epoxide ring signals, which suggested that compound 5 is a stereoisomer of 4 (Tables 2 and 3). The 13C NMR resonances of C-20, C-21, C-22, C-23, C-24, and C-25 were assigned with chemical shift values of δC 86.5, 27.2, 34.8, 26.3, and 86.4, respectively, and the proton signal for H-24 appeared as a double doublet with coupling constants of 9.9 and 5.6 Hz (Tables 2 and 3). The typical NMR parameters of the epoxy ring corresponded to the 20S, 24S configurations, as described in the literature.13 In the NOESY spectrum, correlations between CH3-21 and H-24 as well as H-17 as in compound 4 were absent, while an enhancement between CH3-21 and H-13 was observed, consistent with a configurational change (Figure 3). Other important NOE effects observed for 5 were similar with those observed for 4. Consequently, compound 5 was designated as 20S,24S-epoxy-25-hydroxy-A-homo-4-oxadammaran-3-one, the 20S epimer of compound 4.
Compound 6 was obtained as a colorless resin. The HRESIMS of 6 afforded a sodiated molecular ion peak at m/z 273.1441, corresponding to an elemental formula of C15H22O3Na. In the 1H NMR spectrum, the resonance at δH 6.46 (1H, s, H-6) was ascribed as a signal from an endocyclic double bond, and the proton signals at δH 3.88 (1H, m, H-2) and δH 4.45 (2H, br s, H-15) suggested the presence of an oxymethine and an oxymethylene, respectively. Besides a tertiary methyl group signal at δH 1.09 (3H, s, H-14), an isopropyl group could be recognized based on the proton signals of two secondary methyl groups at δH 1.09 (2 × 3H, d, J = 6.8 Hz) and a heptet at δH 1.09 (1H, J = 6.6 Hz). The 15 carbon signals observed in the 13C NMR spectrum were sorted by DEPT and HSQC into three methyls, three methylenes, a methine, a quaternary carbon, two oxygenated carbons (including one primary and one secondary), a conjugated ketone group, a trisubstituted double bond, and a tetrasubstituted double bond. These NMR spectroscopic observations suggested that compound 6 is a sesquiterpenoid. In its 1H-1H COSY spectrum, the H-1 signal coupled with the geminal protons of H-2α (δH 2.72, 1H, dd, J = 6.1, 17.3) and H-2β (δH 2.16, 1H, J = 12.1, 17.3), which were located next to the ketone group (δC 198.7, C-3). The geminal protons of H-9α (δH 1.43, 1H, ddd, J = 5.7, 6.0, 12.5) and H-9β (δH 2.16, 1H, J = 2.0, 5.0, 12.5) showed coupling to the allylic methylene protons at δH 2.30 (2H, m, H-8). The partial structures were further connected by HMBC correlations from CH3-14 to C-5, C-2 and C-9, H-13 and H-12 to C-7, H-6 to C-4 and C-5, as well as H-15 to C-5, C-4, and C-3 (Figure 4). Compound 6 was therefore elucidated as a 4,6-diene eudesmane derivative, with C-3 substituted by a ketone group, and hydroxy groups present at C-1 and C-15, respectively. The β orientation of the hydroxy group located at C-1 was deduced by the observed NOE effects between H-1 with H-2α and H-9α (Figure 4). A positive Cotton effect was observed in the range 250 nm to 375 nm in the CD spectrum of 6, consistent with that of β-cyperone, a known 4,6-diene-3-one eudesmane.20 Accordingly, the absolute configuration of 6 was established as 1R, 10R, as shown. Therefore, the structure of compound 6 was determined to be 4,6-diene-1,15-dihydroxyeudesma-3-one.
Figure 4.
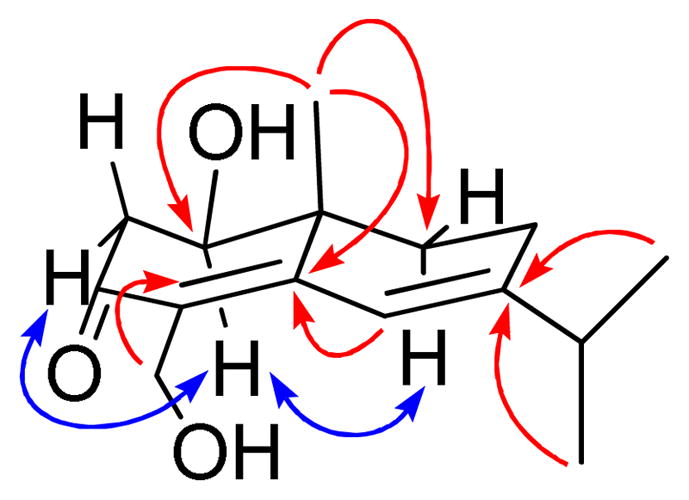
Selected HMBC () and NOESY
() correlations observed
for 6.
All pure compounds obtained in the present investigation were evaluated for their cytotoxic activity against the HT-29 human colon cancer cell line (Table 4). Among these compounds, the highly active agents, silvestrol (7) and 5‴-episilvestrol (8) exhibited potent cytotoxicity, with ED50 values 0.0007 μM and 0.001 μM, respectively. The minor new compounds, 1 and 2, the C-2‴ epimers of silvestrol and 5‴-episilvestrol, were found to be much less active, with ED50 values of 2.3 and 1.1 μM, respectively. Accordingly, it is noted that when the axial methoxy group on the 1,4-dioxanyloxy ring at C-2‴ in silvestrol and 5‴-episilvestrol was changed to an equatorial orientation, as in compounds 1 and 2, the resultant cytotoxicity decreased dramatically. This investigation has thus demonstrated that the configuration of the chiral carbon C-2‴ in the 1,4-dioxanyloxy unit of silvestrol derivatives plays an important role in mediating biological activity among these plant secondary metabolites. An enzyme-based ELISA NF-κB assay was also employed to test the p65 (RelA) inhibitory activity of the new compounds 3–6, in addition to silvestrol, and 5‴-episilvestrol. All of these substances exhibited IC50 values of >20 μM, and were considered inactive. Compounds 1 and 2 were not tested in the NF-κB assay due to the very small amounts isolated.
Table 4.
Cytotoxicity of Compounds Isolated from the Stem Bark of Aglaia foveolata.a
| Compound | HT-29b |
|---|---|
| 5‴-epi-silvestrol (1) | 2.29 |
| 2‴,5‴-diepi-silvestrol (2) | 1.07 |
| silvestrol (7) | 0.0007 |
| 2‴-epi-silvestrol (8) | 0.001 |
| paclitaxelc | 0.0006 |
| camptothecinc | 0.06 |
Compounds 3–6, and all other known compounds obtained in this investigation were inactive against HT-29 cells (ED50 >10 μM).
Results are expressed as ED50 values (μM).
Used as a positive control substance.
Experimental Section
General Experimental Procedures
Optical rotations were obtained on a Perkin-Elmer 343 automatic polarimeter. UV spectra were recorded with a Perkin-Elmer Lambda 10 UV/vis spectrometer. CD spectra were run on a JASCO J-810 spectrometer. NMR spectroscopic data were obtained on a Bruker Avance DRX-400 or 600 MHz spectrometer. IR spectra were measured on a Thermo Scientific Nicolet 6700 FT-IR spectrometer. Column chromatography was performed with 65–250 or 230–400 mesh silica gel (Sorbent Technologies, Atlanta, GA). Analytical thin-layer chromatography was conducted on precoated 250 μm thickness silica gel plates (UV254, glass backed, Sorbent Technologies, Atlanta, GA). Analytical HPLC was conducted on a 150 mm × 4.6 mm i.d. Sunfire PrepC18 column (Waters, Milford, MA), and semi-preparative HPLC was conducted on a 150 mm × 19 mm i.d., 5 μm Sunfire PrepC18 column (Waters, Milford, MA), along with a Waters system equipped with a 600 controller, a 717 Plus autosampler, and a 2487 dual wavelength absorbance detector.
Plant Material
A recollection of A. foveolata stem bark was collected in the autumn of 2007, in Kalimantan, Indonesia, by S. R. (Herbarium Bogoriense, Bogor, Indonesia), through the cooperation of L. B. S. K (LIPI, Tangerang, Indonesia). A voucher specimen (AA6126) has been deposited at the Herbarium of the Field Museum of National History, Chicago, IL.
Extraction and Isolation
The dried stem bark of A. foveolata (40–45 kg) was ground at the University of Illinois Pharmacognosy Field Station, Downers Grove, IL, where it was also bulk extracted with MeOH. The MeOH extract was reduced in volume, and 20% (4 L) was dispatched for isolation work at the Ohio State University. This MeOH extract (4 L) of stem bark of A. foveolata was concentrated under reduced pressure to yield 2 kg of thick dark brown syrup. A part of the extract (500 g) was partitioned sequentially with hexane (3 × 1 L) and CHCl3 (3 × 1 L). The CHCl3 partition was washed with 1% saline solution to yield 200 g of a partially detannified CHCl3-soluble extract, which was found to be active against the HT-29 cell line (ED50 0.4 μg/mL). Accordingly, part of this fraction (180 g) was subjected to separation over a silica gel column (11 × 100 cm, CH2Cl2–acetone, 20:1 to 100% acetone) to yield eight fractions (F01–F08). Fraction F07 (HT-29 cell line, ED50 < 0.16 μg/mL, 7 g) was chromatographed over a LH-20 gel column (5 × 50 cm; eluted with 100% MeOH), to furnish three pooled subfractions (F701– F703). Subfraction F703 was demonstrated by TLC as a silvestrol-rich subfraction, and was subjected to separation over a preparative RP-18 column (150 mm × 19 mm i.d.), using MeOH-H2O (55:45, 8 mL/min) as solvent, to afford compounds 1 (0.8 mg; tR = 20.5 min), 2 (0.9 mg; tR = 26.0 min), silvestrol (7, 100 mg; tR = 36.5 min), and episilvestrol (8, 4.0 mg; tR = 42.5 min). Subfraction F702 was chromatographed on an open ODS column (2 × 15 cm) with a MeOH-H2O gradient solvent system (50:50 to 90:10), to yield compounds 3 (5.0 mg) and 17,24-epoxy-25-hydroxybaccharan-3-one (4.0 mg).
The bulk of the MeOH extract prepared at the University of Illinois at Chigaco (ca. 80%) was transferred to SAIC-Frederick, Inc. Thus, an 11 kg MeOH extract of A. foveolata was subjected to separation on a silica gel column to yield 154 fractions, from which nine silvestrol-enriched subfractions were retained for the purification of gram quantities of silvestrol. Follow-up isolation work on the remaining 145 side-cut fractions was conducted at The Ohio State University. The active fraction F112 (HT-29 cell line, ED50 1.1 μg/ml, 110 g) was chromatographed on a silica gel column, using CH2Cl2-acetone mixtures for elution, to yield eight subfractions (F11201–F11208). The presence of silvestrol and episilvestrol was detected by HPLC analysis in subfractions F11206 and F11207, respectively [(C18 column, 150 mm × 4.6 mm i.d.; MeOH-H2O 60:40; flow rate 1.5 mL/min; tR (silvestrol) = 6.0 min; tR (episilvestrol) = 6.7 min)]. Subfraction F11203 was chromatographed on a silica gel column, using CHCl3-acetone mixtures for elution, to give 17,24-epoxy-25-hydroxy-21-methoxy-3,4-seco-baccharane (50 mg), eichlerianic acid (20 mg), and cabraleone (3.5 mg).
In an attempt to find additional new compounds, two side-cut subfractions, F115-38-21 and F115-38-26 (1.0 g), were also investigated. These were prepared at SAIC-Frederick, Inc, from a silvestrol-containing fraction, F115, by passage over a RP-8 column using a CH3CN-H2O gradient eluent. Subfraction F115-38-21 (500 mg) was chromatographed on a semi-preparative RP-18 column by HPLC, using MeOH-H2O (50:50, 5 mL/min) as solvent system, to give (−)-dehydrodiconiferyl alcohol (3.5 mg, tR = 12.5 min), 6 (1.2 mg, tR = 15.5 min), and 3-oxo-15-hydroxy-T-muurolol (1.0 mg, tR = 19.4 min). Subfraction F115-38-26 (1.0 g) was subjected repeatedly over silica gel columns, using a CH2Cl2-acetone gradient solvent systems (20:1 to 1:1) for elution, to afford compounds 4 (4.0 mg), 5 (3.8 mg), foveolin A (15 mg), and methyl foveolate A (dymalol, 6 mg).
2‴-epi-Silvestrol (1): colorless gum; [α]20D −33.5 (c 0.05, MeOH); UV (MeOH) λmax (log ε) 211 (4.54), 233 (4.07), 278 (3.19) nm; CD (c 3.06×10⁻⁵ M, MeOH) λmax (Δε) 217 (−6.05), 250 (+1.86), 294 (+2.40) nm; IR (film) νmax 3460, 2919, 2850, 1733, 1717, 1683, 1616, 1558, 1540, 1507, 1457, 1251, 1217, 1119, 1057, 1031, 753 cm−1; 1H NMR (600 MHz, CDCl3) and 13C NMR (150 MHz, CDCl3) data, see Table 1; HRESIMS m/z 677.2233 [M + H]+ (calcd for C34H38O13Na, 677.2210).
2‴,5‴-diepi-Silvestrol (2): colorless gum; [α]20D −53.0 (c 0.05, MeOH); UV (MeOH) λmax (log ε) 211 (4.51), 232 (4.04), 278 (3.23) nm; CD (c 3.06×10⁻⁵ M, MeOH) λmax (Δε) 215 (−7.85), 251 (+1.20), 292 (+1.72) nm; IR (film) νmax 3461, 2926, 2850, 1734, 1717, 1683, 1653, 1616, 1558, 1540, 1507, 1457, 1250, 1118, 1043, 753 cm−1; 1H NMR (600 MHz, CDCl3) and 13C NMR (150 MHz, CDCl3) data, see Table 1; HRESIMS m/z 677.2212 [M + H]+ (calcd for C34H38O13Na, 677.2210).
17,24-Epoxy-20α,25-dihydroxy-21-norbaccharan-3-one (3): colorless gum; [α]20D +77.0 (c 0.2, MeOH); UV (MeOH) λmax (log ε) 208 (3.10) nm; CD (c 1.09×10⁻⁴ M, MeOH) λmax (Δε) 289 (+1.31) nm; IR (film) νmax 3395, 2948, 2868, 1701, 1456, 1384, 1161, 1067, 991, 946, 753 cm−1; 1H NMR (600 MHz, CDCl3) and 13C NMR (150 MHz, CDCl3) data, see Tables 2 and 3; HRESIMS m/z 483.3431 [M + Na]+ (calcd for C29H48O4Na, 483.3450).
20S,24S-Epoxy-25-hydroxy-A-homo-4-oxadammaran-3-one (4): colorless gum; [α]20D +77.0 (c 0.1, MeOH); UV (MeOH) λmax (log ε) 206 (3.19) nm; CD (c 2.09×10⁻³ M, MeOH) λmax (Δε) 210 (+0.52), 283 (+0.03) nm; IR (film) νmax 3420, 2939, 2870, 1717, 1457, 1387, 1374, 1286, 1139, 1111, 1027, 755 cm−1; 1H NMR (600 MHz, CDCl3) and 13C NMR (150 MHz, CDCl3) data, see Tables 2 and 3; HRESIMS m/z 497.3651 [M + Na]+ (calcd for C30H50O4Na, 497.3607).
20S,24S-Epoxy-25-hydroxy-A-homo-4-oxadammaran-3-one (5): colorless gum; [α]20D +111.0 (c 0.04, MeOH); UV (MeOH) λmax (log ε) 205 (3.16) nm; CD (c 2.09×10⁻⁴ M, MeOH) λmax (Δε) 214 (+0.28), 288 (+0.12) nm; IR (film) νmax 3423, 2967, 2933, 2865, 1718, 1457, 1387, 1374, 1288, 1143, 1111, 1058, 755 cm−1; 1H NMR (600 MHz, CDCl3) and 13C NMR (150 MHz, CDCl3) data, see Tables 2 and 3; HRESIMS m/z 497.3639 [M + Na]+ (calcd for C30H50O4Na, 497.3607).
4,6-Diene-1β,15-dihydroxyeudesma-3-one (6): colorless gum; [α]20D +217.0 (c 0.04, MeOH); UV (MeOH) λmax (log ε) 204 (3.65), 302 (4.42) nm; CD (c 1.00×10⁻⁴ M, MeOH) λmax (Δε) 295 (+4.3) nm; IR (film) νmax 3406, 2962, 2917, 2873, 1645, 1613, 1569, 1465, 1423, 1362, 1328, 1295, 1220, 1035, 997, 755 cm−1; 1H NMR (600 MHz, CDCl3) and 13C NMR (150 MHz, CDCl3) data, see Tables 2 and 3; HRESIMS m/z 273.1441 [M + Na]+ (calcd for C15H22O3Na, 273.1467).
Cell Culture and Cytotoxicity Assay
Human colon cancer cells (HT-29) were obtained from American Type Collection (ATCC catalog no. HTB-38). Cells were cultured in MEME medium (Hyclone, Logan, UT) supplemented with streptomycin (100 μg/mL), penicillin (100 units/mL), amphotericin B (Fungizone, 0.25 μg/mL) and 10% fetal bovine serum (FBS), and incubated in a humidified incubator with an atmosphere of 95% air and 5% CO2 at 37 °C. Cells were trypsinized and split for subculture when they reached near-confluent state (five days or later). Upon reaching about 60%–70% confluence, the medium was changed and the cells were used for test procedures one day later.
The harvested cells, after appropriate dilutions, were seeded in 96-well (9500 cells/190 μL) plates using complete medium, and treated with the test compounds (10 μL/well in triplicate) at various concentrations. Test samples were initially dissolved in DMSO and then diluted 10-fold with H2O2. Serial dilutions were performed using 10% DMSO as the solvent. For the control groups, 10 μL of 10% DMSO were also added to each well. The plates were incubated for three days at 37 °C in 5% CO2. On the third day, the cells were fixed to the plates by the addition 100 μL of cold 20% trichloroacetic acid (TCA) and incubated at 4 °C for 30 min. The plates were washed three times with tap water and dried overnight. The fixed cells were dyed with sulforhodamine B (SRB, an anionic protein stain) solution at 0.4% (w/v) in 1% acetic acid, and incubated at room temperature for 30 min. The plates were washed three times with 1% acetic acid and allowed to air dry. The bound SRB stain was then solubilized with 10 mM unbuffered Tris base, (pH 10, 200 μL/well). The plates were placed on a shaker for 5 min, and the absorbance was read at 515 nm using a Bio-Tek μQuant microplate reader. The ED50 values of test samples with serial dilutions were calculated using non-liner regression analysis (Table curve2Dv4; AISN Software, Inc., Mapleton, OR).
Enzyme-based ELISA NF-κB Assay
The NF-κB p65 subunit inhibitory activity of five major compounds (3–8) was tested in an enzyme-based ELISA NF-κB assay, which was carried out according to a published protocol.22,23 Rocaglamide was used as a positive control, with an ED50 value of 0.08 μM in this assay.
Supplementary Material
Acknowledgments
This study was supported, in part by grants U19 CA52956 and P01 CA125066 (awarded to A.D. Kinghorn) from NCI, NIH. We are grateful to Dr. Jimmy Orjala and Mr. Michael Totura of the University of Illinois at Chicago for performing an initial large-scale extraction of the plant material. Mr. Matt Harris, SAIC-Frederick, Inc., is acknowledged for assistance with plant fractionation studies. We thank Mr. John Fowble, College of Pharmacy, The Ohio State University, and Dr. Chun-Hua Yuan, OSU Campus Chemical Instrument Center, for facilitating the acquisition of the 400 and 600 MHz NMR spectra. We acknowledge Dr. Mark Apsega, Campus Chemical Instrument Center, The Ohio State University, for the mass spectrometric data.
Footnotes
Supporting Information Available: Comparison of 1H NMR spectra of four silvestrol derivatives (1, 2, 7 and 8); 1H-, 13C-NMR and selected 2D NMR spectra of new compounds 1–6. These materials are available free-of-charge view the Internet at http://pubs.acs.org.
References and Notes
- 1.Hwang BY, Su BN, Chai H-B, Mi Q, Kardono LBS, Afriastini JJ, Riswan S, Santarsiero BD, Mesecar AD, Wild R, Fairchild CR, Vite GD, Rose WC, Farnsworth NR, Cordell GA, Pezzuto JM, Swanson SM, Kinghorn AD. J Org Chem. 2004;69:3350–3358. doi: 10.1021/jo040120f. ibid. 6156. [DOI] [PubMed] [Google Scholar]
- 2.Meurer-Grimes BM, Yu J, Vairo GL. 6710075. US patent. 2004:B2.
- 3.Mi Q, Kim S, Hwang BY, Su B-N, Chai H-B, Arbieva ZH, Kinghorn AD, Swanson SM. Anticancer Res. 2006;26:3349–3356. [PubMed] [Google Scholar]
- 4.Kim S, Hwang BY, Su BN, Chai HB, Mi Q, Kinghorn AD, Wild R, Swanson SM. Anticancer Res. 2007;27:2175–2183. [PMC free article] [PubMed] [Google Scholar]
- 5.Lucas DM, Edwards RB, Lozanski G, West DA, Shin JD, Vargo MA, Davis ME, Rozewski DM, Johnson AJ, Su BN, Goettl VM, Heerema NA, Lin TS, Lehman A, Zhang XL, Jarjoura D, Newman DJ, Byrd JC, Kinghorn AD, Grever MR. Blood. 2009;113:4656–4666. doi: 10.1182/blood-2008-09-175430. [DOI] [PMC free article] [PubMed] [Google Scholar]
- 6.Bordeleau ME, Robert F, Gerard B, Lindqvist L, Chen SMH, Wendel HG, Brem B, Greger H, Lowe SW, Porco JA, Jr, Pelletier J. J Clin Inv. 2008;118:1–11. doi: 10.1172/JCI34753. [DOI] [PMC free article] [PubMed] [Google Scholar]
- 7.Cencic R, Carrier M, Galicia-Vázquez G, Bordeleau ME, Sukarieh R, Bourdeau A, Brem B, Teodoro JG, Greger H, Tremblay ML, Porco JA, Jr, Pelletier J. PLoS ONE. 2009;4:e5223. doi: 10.1371/journal.pone.0005223. [DOI] [PMC free article] [PubMed] [Google Scholar]
- 8.Gerard B, Cencic R, Pelletier J, Porco JA. Angew Chem Int Ed. 2007;46:7831–7834. doi: 10.1002/anie.200702707. [DOI] [PubMed] [Google Scholar]
- 9.El Sous M, Khoo ML, Holloway G, Owen D, Scammells PJ, Rizzacasa MA. Angew Chem Int Ed. 2007;46:7835–7838. doi: 10.1002/anie.200702700. [DOI] [PubMed] [Google Scholar]
- 10.Adams TE, El Sous M, Hawkins BC, Hirner S, Holloway G, Khoo ML, Owen DJ, Savage GP, Scammells PJ, Rizzacasa MA. J Am Chem Soc. 2009;131:1607–1616. doi: 10.1021/ja808402e. [DOI] [PubMed] [Google Scholar]
- 11.Kim S, Salim A, Swanson SM, Kinghorn AD. Anti-Cancer Agents Med Chem. 2006;6:319–345. doi: 10.2174/187152006777698123. [DOI] [PubMed] [Google Scholar]
- 12.Salim AA, Chai HB, Richman I, Riswan S, Kardono LBS, Farnsworth NR, Carcache-Blanco EJ, Kinghorn AD. Tetrahedron. 2007;63:7926–7934. doi: 10.1016/j.tet.2007.05.074. [DOI] [PMC free article] [PubMed] [Google Scholar]
- 13.Seger C, Pointinger S, Greger H, Hofer O. Tetrahedron Lett. 2008;49:4313–4315. [Google Scholar]
- 14.Govindachari TR, Suresh G, Kumari GNK. Phytochemistry. 1994;37:1127–1129. [Google Scholar]
- 15.Tokunaga N, Sakakibara N, Umezawa T, Ito Y, Fukuda H, Sato Y. Plant Cell Physiol. 2005;46:224–232. doi: 10.1093/pcp/pci017. [DOI] [PubMed] [Google Scholar]
- 16.Ding L, Pfoh R, Ruehl S, Qin S, Laatsch H. J Nat Prod. 2009;72:99–101. doi: 10.1021/np8006843. [DOI] [PubMed] [Google Scholar]
- 17.Witz P, Herrmann H, Lehn JM, Ourisson G. Bull Soc Chim Fr. 1963:1101–1112. [Google Scholar]
- 18.Klinot J, Vsetecka V, Klinotova E, Vystrcil A. Coll Czech Chem Commun. 1986;51:611–620. [Google Scholar]
- 19.Pointinger S, Promdang S, Vajrodaya S, Pannell CM, Hofer O, Mereiter K, Greger H. Phytochemistry. 2008;69:2696–2703. doi: 10.1016/j.phytochem.2008.08.025. [DOI] [PubMed] [Google Scholar]
- 20.Djerassi C, Riniker R, Riniker B. J Am Chem Soc. 1956;78:6362–6377. [Google Scholar]
- 21.Skehan P, Storeng R, Scudiero D, Monks A, McMahon J, Vistica D, Warren JT, Bokesch H, Kenney S, Boyd MR. J Natl Cancer Inst. 1990;82:1107–1112. doi: 10.1093/jnci/82.13.1107. [DOI] [PubMed] [Google Scholar]
- 22.Renard P, Ernest I, Houbion A, Art M, Le Calvez H, Raes M, Remacle J. Nucleic Acids Res. 2001;29:e21. doi: 10.1093/nar/29.4.e21. [DOI] [PMC free article] [PubMed] [Google Scholar]
- 23.Deng Y, Balunas MJ, Kim JA, Lantvit DD, Chin YW, Chai HB, Sugiarso S, Kardono LBS, Fong HHS, Pezzuto JM, Swanson SM, Carcache-Blanco EJ, Kinghorn AD. J Nat Prod. 2009;72:1165–1169. doi: 10.1021/np9001724. [DOI] [PMC free article] [PubMed] [Google Scholar]
Associated Data
This section collects any data citations, data availability statements, or supplementary materials included in this article.