Abstract
The damped-oscillator pseudo-wavelet is presented as a method of time-frequency analysis along with a new spectral density measure, the data power. An instantaneous phase can be defined for this pseudo-wavelet, and it is easily inverted. The data power measure is tested on both computer generated data and in vivo intrahippocampal electrophysiological recordings from a rat. The data power spectral density is found to give better time and frequency resolution than the more conventional total energy measure, and additionally shows intricate time-frequency structure in the rat that is altered in association with the emergence of epilepsy. With epileptogenesis, the baseline theta oscillation is severely degraded and is absorbed into a broader gamma band. There are also broad 600 Hz and 2000 Hz bands which localize to hippocampal layers that are distinct from those of the theta and gamma bands. The 600 Hz band decreases in prominence with epileptogenesis while the 2000 Hz band increases in prominence. The origins of these high frequency bands await further study. In general, we find that the damped-oscillator pseudo-wavelet is easy to use and is particularly suitable for problems where a wide range of oscillator frequencies is expected.
Keywords: time-frequency analysis, wavelet analysis, high frequency oscillations, epileptogenesis
1. Introduction
Time-frequency analysis involves monitoring the changes in the frequency spectrum of a system over time. It is of importance in nearly every field of science and engineering. The old work-horse of frequency analysis, the fast Fourier transform (FFT), can be applied to this problem by segmenting data into shorter time windows. By monitoring changes in the power spectrum in each time window, one can determine the presence or absence of activity at certain frequencies within that time window. The segmentation, however, introduces artifact and precludes finer time resolution within time windows. There have been many discussions of these issues and many refinements of the FFT approach (Thomson 1982; Mitra and Pesaran 1999; Groechenig 2001). These refinements are all somewhat labor intensive, requiring judgments to be made about window sizes and windowing functions, which may be different for different frequency ranges. Mathematical generalization of time windowed FFT power spectra to a wide range of time-frequency distribution functions has been accomplished (Cohen 1989; Oonincx 2000). At least one of these time-frequency distribution functions has found application to the study of electroencephalograms (EEG) (Zaveri, Williams et al. 1992). Each of these time-frequency distribution functions has its own strengths and weaknesses.
Over the last 20 years, wavelet transforms have also become an important new way of doing time-frequency analysis (Daubechies 1990; Farge 1992; Graps 1995; Cohen and Kovacevic 1996). A wavelet consists of an oscillatory waveform that has a fairly well-defined frequency and which exists only for a brief period of time. By convolving time series data with a suitably chosen wavelet, one can determine whether an oscillation of a certain frequency is present at a certain interval in time, in a way that is more convenient and less susceptible to artifact than time windowed FFT. There are many kinds of wavelets, and many applications of wavelet transforms to EEG analysis (Le Van Quyen, Foucher et al. 2001; Senhadji and Wendling 2002; Le Van Quyen and Bragin 2007; Allen and MacKinnon 2009; Storti, Formaggio et al. 2009).
A defining property of wavelets is the admissibility criterion, a consequence of which is that the mean of the wavelet when averaged over all time must equal zero. This criterion insures that a stable inverse transform exists (Farge 1992; Cohen and Kovacevic 1996). A stable inverse transform is critical for reliable signal transmission and reconstruction. However, in many fields of science and engineering, one is not interested in signal reconstruction. Rather, one may only wish to detect whether oscillations of certain frequencies appear, at what times and for what duration of time. For example, in the brain, it is known that oscillations in the theta (4–8 Hz) and gamma ranges (30–100 Hz) are associated with cognitive activity. Oscillations from these two frequency ranges are sometimes phase-coupled, such that the faster gamma frequencies ride entirely on the crests (or troughs) of slower theta rhythms (Lisman 2005; Canolty, Edwards et al. 2006; Axmacher, Henseler et al. 2010). Of increasing clinical interest are high frequency oscillations (HFO’s) in the range of 200–500 Hz. These oscillations tend to occur more frequently in brain regions that are epileptogenic, and so may be useful as a marker for tissue that should be surgically resected in people with refractory epilepsy (Worrell, Gardner et al. 2008; Zijlmans, Jacobs et al. 2009; Bragin, Engel et al. 2010). For these applications, one might consider relaxing the admissibility criterion.
Relaxing the admissibility criterion results in a wide class of waveforms called pseudo-wavelets (or quasi-wavelets), which have found application in the study of turbulence and other complex phenomena (Qiu, Pawu et al. 1995; Wilson, Ostashev et al. 2009). Here we describe a particularly simple pseudo-wavelet that has a uniquely simple physical interpretation. Our pseudo-wavelet corresponds to using a mathematical model of a frictionally damped harmonic oscillator to detect data oscillations of the same frequency. We have previously referred to this pseudo-wavelet as the damped-oscillator oscillator detector (DOOD) (Hsu, Hsu et al. 2007). Here we develop the damped oscillator pseudo-wavelet in more detail and apply it to time series analysis of the EEG. We illustrate our approach with computer generated oscillations as well as data from in vivo rat hippocampal recordings. The rat recordings show a richness in time-frequency dynamics which invites further exploration.
2. Theory
The motivation for the DOOD pseudo-wavelet comes from considering how one might construct a mathematical oscillator detector based on analogy to mechanical oscillators. One first constructs a set of mathematical harmonic oscillators each of which has its own natural frequency of oscillation. Next, consider the time series data as a driving force that acts upon each mathematical harmonic oscillator. Start with the mathematical oscillators all at rest, and then let the data drive activity in the mathematical oscillators. If there is an oscillation in the data (a “data oscillator”) that is nearly resonant with one of the mathematical oscillators, then that mathematical oscillator will steadily gain in energy. That mathematical oscillator will continue to gain in energy as long as the data oscillator remains on. If the data oscillator is turned off, the energy of the mathematical oscillator will plateau. If the data oscillator is turned back on again, the mathematical oscillator will either gain or lose energy, depending on whether the data oscillator is in-phase or out-of-phase with the mathematical oscillator. Sudden increases or decreases in energy are both markers of a resonant oscillation in the data. Therefore, we will choose to monitor the time rate of change of the energy of each mathematical oscillator, i.e., its power.
Time resolution can be improved in this scheme by allowing friction to act on the mathematical oscillators. Friction induces the mathematical oscillators to approach a steady state. The steady state will be different depending on whether or not there is resonant driving by data oscillators. The higher the friction, the faster the mathematical oscillator approaches steady state, and the better the time resolution of when data oscillators turn on and off. The cost of better time resolution, of course, is poorer frequency resolution. This counterbalance between time and frequency resolution is a manifestation of the uncertainty principle.
To begin, let xdata (t) represent the voltage recorded by a given electrode at time t, and let ẋdata (t) denote its first time derivative. For ease of notation, we will only consider time series data from one electrode, but generalization to many electrodes is straightforward. Let h(t) denote either xdata (t) or ẋdata (t). If we use h(t) = xdata (t), we will refer to this algorithm as X-DOOD. If we use h(t) = ẋdata (t), we will refer to this algorithm as V-DOOD. Here “X” is meant to suggest a coordinate, and “V” suggests a velocity.
Next let x(n, t) represent the coordinate of the nth mathematical oscillator, ẋ(n, t) its velocity, M(n) its mass, g(n) its friction constant, and ω0(n) its radial frequency, with n = 1 to Nf, where Nf is the total number of mathematical oscillators. For convenience, we take all the masses to be equal to one, M(n)=1 for all n. If we took the mass to be anything other than 1, then the net effect would be to scale h(n) by the inverse of the mass, which in turn would be equivalent to changing the units of measurement for h(n). Since we are interested in the relative response of one mathematical oscillator vs another mathematical oscillator to the same data driving force h(n), the masses of the mathematical oscillators do not matter as long as they are all the same. The equation of motion for the nth mathematical oscillator is then
| Eq (1) |
The simplest non-transient solution for Eq (1) can be written in terms of a complex wavefunction ψ(n, t):
| Eq (2) |
with . Taking ψR(n, t) and ψI(n, t) to be the real and imaginary parts of ψ(n, t), we have
| Eq (3) |
| Eq (4) |
This solution can be verified by taking the first time derivative of Eq (2) and expressing ψ(n, t) in terms of ψR (n, t) and ψI (n, t). The real part of this equation should then read: ψ̇R (n, t) = h(t) − g(n)ψR (n, t) − ω(n)ψI (n, t). Using Eqs (3) and (4) to eliminate ψR (n, t) and ψI (n, t) then yields Eq (1).
The wavefunction ψ(n, t) can be calculated easily using a recursion relationship. To derive this relationship, take one incremental time step δt:
| Eq (5) |
For very small time steps δt, Eq (5) can be rewritten
| Eq (6) |
Equation (6) allows us to calculate ψ(n, t+δt) rapidly given h(t+δt) and ψ(n, t) without ever having to recalculate ψ(n, t) or to keep track of h(t) from prior time steps. Note that the exponential factor only has to be calculated once, before taking the first time step. Once we know ψ(n, t+δt), we can calculate x(n, t+δt) and ẋ(n, t+δt) using Eqs (3) and (4).
The instantaneous energy of the nth mathematical oscillator has terms that involve the friction and terms that are independent of the friction. Since we are interested only in changes in the energy due to coupling to h(t), we shall drop terms that depend on the friction wherever they arise. The instantaneous energy of the nth frictionless harmonic oscillator is given by:
| Eq (7) |
The first term is the kinetic energy term, and the second term is the potential energy term. Taking the time derivative of Eq (7) and inserting Eq (1), we find the time rate of change of the instantaneous energy, i.e., the instantaneous power:
| Eq (8) |
The term in Eq (8) containing g(n) is a term due to friction; we shall ignore it. The term in h(t) is the power due to the data driving force. We take this term to be our measure of spectral density. To emphasize that this measure is that part of the total power due only to the data driving force, we refer to it as the data power. The data power is then written as:
| Eq (9) |
In comparison, the more traditional wavelet and pseudo-wavelet approaches identify the total energy of the wavefunction ψ(n, t) as the spectral density, which is given as:
| Eq (10) |
In the absence of friction, the total energy E(n, t) plateaus when there are no active data oscillators. In the presence of friction, the total energy will decay back to baseline when data oscillators are turned off with a rate given by the friction constant g(n). One might also imagine looking at the total power, given by Ė(n, t). This quantity drops back to baseline faster than the total energy, but it contains a term that depends only on the friction and not on the data oscillator, i.e., the second term in Eq (8). Therefore, neither E(n, t) nor Ė(n, t) is as sensitive to state changes in the data oscillator as is S(n, t). In the first example below, we will see that S(n, t) can show a sudden drop almost immediately after a data oscillator is turned off, within one period of the resonant frequency. Although S(n, t) is still subject to the uncertainty principle, time resolution is typically much better with S(n, t) than with E(n, t).
In summary, the DOOD algorithm consists of the following steps. First, start with all the mathematical oscillators at rest, ψ(n, t)= 0 at t= 0, with the frequency of each mathematical oscillator being f(n)=ω(n)/2π. Second, use Eq (6) to calculate ψ(n, t) at the next instant in time. Third, calculate ẋ(n, t) using Eq (4). Fourth, calculate the data power spectral density using Eq (9). Fifth, one may not wish to save the data power spectral density at every instant in time. For instance, one may wish to know the data power spectral density only at time intervals given by tdump. In this case, one can average S(n, t) over consecutive time intervals, each of duration tdump, and then save only these averages for graphing.
2.1 Friction and the uncertainty principle
The friction constant g(n) can be used to sharpen the time resolution of the data power spectral density S(n, t). If a data oscillator turns on, drives up the spectral power to a new level, and then turns off, the friction will bring the data power spectral density back down to baseline on a time scale of 1/g(n). Larger friction will bring down the spectral power faster, thus giving better time resolution as to when the data oscillator turned off. Larger friction will also cause broadening of the spectral peak, however. This manifestation of the uncertainty principle is expected and unavoidable. It can be demonstrated by inspecting Eq (2). If one inserts a pure sinusoid for h(t) in Eq (2), one finds a Lorentzian line shape with a peak at the frequency of the sinusoid of h(t) and a half-width-at-half-maximum given by g(n). The larger is g(n), the wider is this Lorentzian peak. That is, the spectral bandwidth of the nth mathematical oscillator is g(n). Larger values of g(n) gives better time resolution but a broader spectral bandwidth for the nth mathematical oscillator.
What is the best way to choose the g(n)’s?
There is no single right answer to this question. In choosing the g(n)’s, we have to decide whether we wish to have better time resolution or better frequency resolution. One way to choose the g(n)’s is to consider how one distributes the frequencies of the mathematical oscillators, i.e., how one chooses the f(n)’s. If one chooses the f(n)’s on a conventional linear grid, with f(n +1)= f(n)+ δf, then it is most reasonable to choose g(n)/2π=δ f, so that the spectral bandwidths of neighboring mathematical oscillators overlap, leaving no gap between. Here the absolute frequency resolution is given by δ f, while the relative frequency resolution is given by g(n)/ω(n)=δ f/f(n). Note that in this case, the relative frequency resolution goes like ~1/n, i.e., the relative spectral bandwidth of each mathematical oscillator decreases for higher frequency oscillators.
One might reasonably argue that, rather than setting the absolute frequency resolution constant for every mathematical oscillator, one should set the relative frequency resolution constant, e.g., by taking [f(n +1) − f(n)]/f(n)= g0, where g0 is a small positive number, the same for every mathematical oscillator. Such a choice then implies that the frequency grid is geometric, f(n +1) = f(n)[1+ g0].
When the frequency range that needs to be spanned for a given problem is small, say, of 1 to 2 orders of magnitude, then it does not matter much whether one chooses a linear or geometric frequency grid. However, when the frequency range that needs to be spanned is 3–4 orders of magnitude, or even larger, then computational economy suggests that one should adopt a geometric frequency grid. In this way, one can span the greatest frequency range with the smallest number of mathematical oscillators, while yet maintaining the same relative spectral resolution of each mathematical oscillator.
2.2 Computational cost
Here we consider computational cost and compare with the cost of traditional time-windowed fast Fourier transform (FFT). Let Ntot be the total number of time steps in the entire time series, and let Nwin be the number of time steps in a given FFT time window. The number of FFT time windows is then NS= Ntot/Nwin. In FFT, Nwin and Nf are constrained to be related: Nwin= 2Nf. If one constructs NS spectra at equal non-overlapping time intervals, then the computational cost of FFT goes like:
| Eq (11) |
The DOOD algorithm Eq (6) yields a power spectrum at every single time step. Its cost therefore goes like
| Eq (12) |
Comparing Eqs (11) and (12), one sees that FFT is much faster than DOOD for large Nf. Of course, it is not entirely fair to compare C(FFT) and C(DOOD) in Eqs (11) and (12) directly, because the DOOD algorithm yields a spectrum at every single time step, while the FFT algorithm only yields one spectrum for every Nwin time steps. A fairer comparison might be to use overlapping FFT time windows, such that each time window advances by only one time point. In this case, the FFT computational cost goes like:
| Eq (11′) |
Comparing Eq (12) to Eq (11′), one sees that the DOOD algorithm is computationally less expensive than FFT, when time resolution at the level of the sampling rate is desired.
Another situation where the DOOD algorithm will be faster than FFT is where one wishes to monitor a single well defined frequency fdata with spectral width δ fdata such that δ fdata/fdata ≤ 1. In this case, one can choose a single mathematical oscillator with frequency f(1) = fdata and friction g(1)/2π=δ fdata. The computational cost of the DOOD algorithm then goes like Ntot. In comparison, using FFT, if one wishes a spectral resolution of δ fdata/fdata ≤ 1, then one needs to monitor at least Nf points in the frequency domain where Nf ~ fdata/δfdata ≥ 1. In this case, the computational cost of FFT goes like Ntot Nf log(Nf ), which is much greater than that for the DOOD algorithm.
It is also possible to implement the DOOD algorithm using Eq (2) directly. In this approach, one segments the total data time series into time windows, as one would for conventional FFT. Within each time window, one can calculate Eq (2) rapidly by taking the FFT of both sides of Eq (2), evaluating Eq (2) in Fourier space, then back transforming to recover Eq (2) in the time domain. The computational cost in this case is of the same order as that of straight FFT. In practice, we find DOOD fast enough using Eq (6) that we do not resort to this hybrid DOOD-FFT algorithm. It is conceivable that for situations where time resolution is not a high priority, that one may adopt a hybrid DOOD-FFT approach.
2.3 Nyquist theorem
The sampling rate fS of the raw data places an upper limit on the highest frequency oscillator that can be calculated reliably, because if there is an oscillation in the data that is of the same frequency or higher, then it will be artifactually “folded” into the dynamics of oscillators of somewhat lower frequency. This well-known phenomenon applies equally to FFT and to the DOOD pseudo-wavelet. It is advisable to take mathematical oscillators of frequency no higher than fS/2 for this reason.
2.4 Comparison with the wavelet transform and derivation of formal inverse
A wavelet transform has the form:
| Eq (13) |
Here φw (n, t) is the wavelet kernel. It has a peak amplitude at frequency f(n) with a certain scaled width. The asterisk denotes a complex conjugate. A defining feature of wavelet transforms is that each wavelet kernel φw (n, t) must satisfy the admissibility criterion, which states:
| Eq (14) |
Here φ̂w(n,ω) is the Fourier transform of φw(n, t). A consequence of the admissibility criterion is that the average of the wavelet kernel over all time must equal zero. A wavelet kernel that satisfies the admissibility criterion results in a wavelet transform that can be inverted to recover h(t) from ψw (n, t) through use of a general inversion formula that guarantees inversion without loss of information (Farge 1992; Cohen and Kovacevic 1996). This property is very useful in applications for information transmission: one can code information in terms of wavelets, compress the code by throwing out those wavelets that are of very low amplitude, transmit the remaining significant wavelets, and then reconstruct the original signal by use of the inversion formula.
However, violation of the admissibility criterion does not necessarily preclude an inverse; it merely means that the general inversion formula discovered for admissible wavelets is not applicable. We will come back to this point shortly.
Comparing Eqs (14) with (2), one sees that the DOOD transform is reminiscent of a wavelet transform, if one identifies the pseudo-wavelet kernel as
| Eq (15) |
Because φpw (n, t)= 0 for t < 0, this pseudo-wavelet kernel is said to be causal, because the DOOD transform ψ(n, t) depends only on the current and past values of the signal h(t), and not on any future values of h(t). This property is desirable for time-frequency transforms. However, the time average of φpw (n, t) does not equal zero, and so φpw (n, t) is not an admissible wavelet kernel. This means that the general inversion formula derived for wavelets cannot be used for the DOOD transform.
Nonetheless, for every DOOD pseudo-wavelet n, an inverse does exist. For formal completeness, we show how to calculate this inverse. We shall first find h(n, t), which represents the reconstruction of the total signal h(t) using only the nth damped oscillator. The best reconstruction of the total signal will then be h(n, t) averaged over all DOOD pseudo-wavelets.
To proceed, define the one-sided Fourier transform of ψ(n, t) as usual:
| Eq (16) |
Taking the one-sided Fourier transform of both sides of Eq (2) then yields:
| Eq (17) |
| Eq (18) |
where h̃(n, s) ≡ h̃R (n,s) + ih̃I (n,s). One next takes the inverse Fourier transform of h̃(n, s) to obtain h(n, t). If the DOOD kernels φpw (n, t) do not overlap too much, i.e., if g(n) is small compared to the difference between neighboring oscillator frequencies, then the total original signal may be approximated by:
| Eq (19) |
2.5 Definition of instantaneous phase
For every pair of values for x(n, t) and ẋ(n, t), calculated via Eqs (3)–(4), we can define an instantaneous phase, θ(n, t)=ω(n)t+δ(n), via:
| Eq (20) |
| Eq (21) |
| Eq (22) |
2.6 Definition of pair correlation functions
Since the spectral density of interest is the data power, we construct a variety of correlation functions from the data power spectral density. The pair correlation function is defined:
| Eq (23) |
If we wish to extract phase information, we have to be careful not to introduce phase shifts through the sign of the data power. This kind of artifact is most easily prevented by squaring the data power before taking the time average:
| Eq (24) |
| Eq (25) |
| Eq (26) |
| Eq (27) |
Equations (24)–(27) can be used to check whether the phase of oscillator n modifies the data power amplitude of oscillator m. If oscillator m tends to be more activated at a particular phase of oscillator n, then σ0(m, n) will be relatively larger for that pair of (m,n) and θ0(m, n) will give the relative phase of n during which the square magnitude of the data power of m is largest.
2.7 Advantages of X-DOOD vs V-DOOD
Recall that xdata (t) represents the voltage recorded by a given electrode at time t, and ẋdata (t) denotes its first time derivative. The time series in xdata (t) will be more sensitive to low frequency activity, while that in ẋdata (t) is more sensitive to higher frequency activity. The reason that ẋdata (t) is more sensitive to higher frequency activity is because the instantaneous time derivative of a sinusoid is equal to the frequency of oscillation of the sinusoid times the amplitude of the sinusoid. For example, if xdata (t) = A sin(ω t), then ẋdata (t) = A ωcos(ω t). The extra factor of ω in ẋdata (t) magnifies the effect of high frequency oscillations in ẋdata (t) relative to that of low frequency oscillations. Conversely, for very small ω, the extra factor of ω in ẋdata (t) reduces the effect of low frequency oscillations in ẋdata (t) relative to that of high frequency oscillations. Thus we expect V-DOOD to be more sensitive to high frequency oscillations while X-DOOD should be more sensitive to low frequency oscillations.
In general, as we shall see in the examples, one should perform both X-DOOD and V-DOOD when performing time-frequency analysis, in order to explore both low frequency and high frequency structure. However, because V-DOOD requires taking a numerical derivative of the data, there is the potential problem that this numerical derivative may magnify the effects of noise. We shall see that, in practice, the noise magnification introduced by V-DOOD is quite tolerable. In fact, in our examples, V-DOOD does a better job of detecting low frequency oscillations than X-DOOD does of detecting high frequency oscillations, and so V-DOOD may be preferable to X-DOOD as an initial screening tool.
Finally, on the subject of taking time derivatives and magnifying noise, it is noteworthy that the velocity of the nth mathematical oscillator, ẋ(n, t), is calculated directly from ψ(n, t) using Eq. (4), without having to take a numerical derivative. Since numerical derivatives tend to magnify noise, it is advantageous whenever possible to avoid having to do that.
3. Illustrative examples
Here we explore the DOOD algorithm with both computer generated data and real data from rats. We will use both X-DOOD and V-DOOD, anticipating that X-DOOD will be more sensitive to low frequency activity and V-DOOD will be more sensitive to high frequency activity.
3.1 Computer generated data
Consider computer generated data given by the equation:
| Eq (28) |
Equation (28) describes the dynamics of two sinusoidal oscillators with frequencies of f(1)= 7 Hz and f(2)= 60 Hz oscillators. The frequencies are chosen to model a single theta (7 Hz) and a single gamma (60 Hz) oscillator. These oscillators are coupled so that the 60 Hz oscillator is more activated on the crests of the 7 Hz oscillator, and less activated in the troughs. Here R(t) represents a Gaussian random number with root mean square deviation of one. Both the 7 Hz and 60 Hz data oscillators are turned on at time t=12 s and off at time t=14 s. The sampling rate is taken to be fS= 400 Hz which corresponds to time steps of δt= 2.5 ms. Total simulation time is 20 s, which means that the oscillators are on for 10% of the total time.
The X-DOOD and V-DOOD oscillators are chosen with frequencies given by f(n)= n Hz, with n=1 to 100. Recall that taking h(t) = xdata (t) corresponds to using the X-DOOD algorithm. Using h(t) = ẋdata (t) corresponds to using the V-DOOD algorithm. We will show results from the X-DOOD algorithm first.
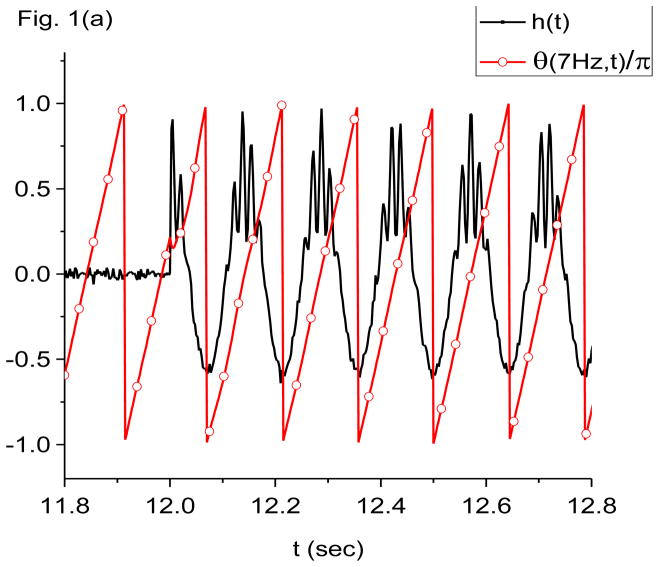
In Fig. 1(a), we plot h(t) = xdata (t) from Eq (28) along with the instantaneous phase θ(7 Hz, t) of the 7 Hz oscillator from Eq (22) using the X-DOOD algorithm. The instantaneous phase appears to be a stable and reliable quantity. Note the shift in phase within the first cycle when the 7 Hz and 60 Hz data oscillators are turned on. It is seen that the crests of the 7 Hz oscillation are associated with θ(7 Hz, t)≈ 0.
Figure 1.
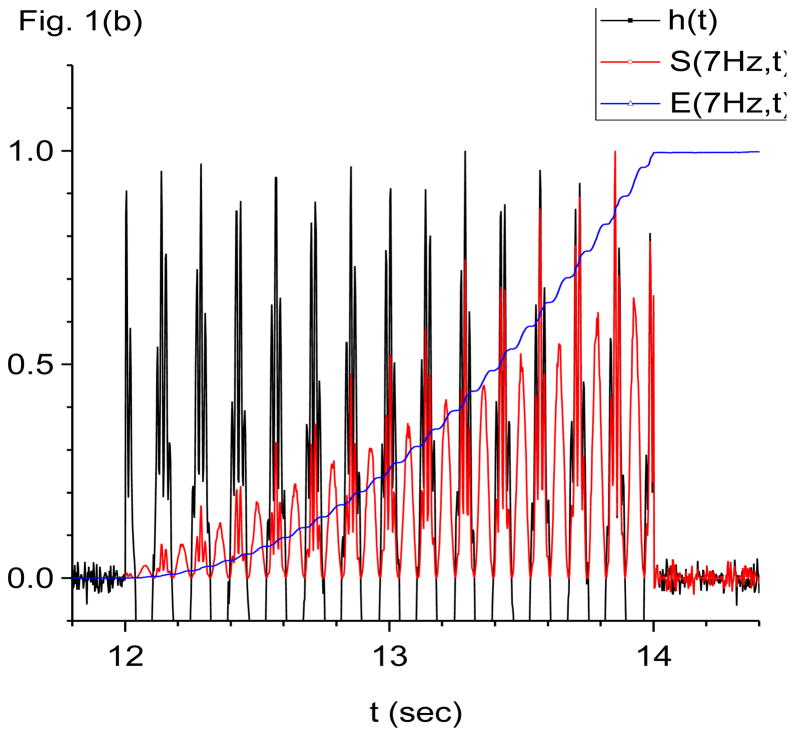
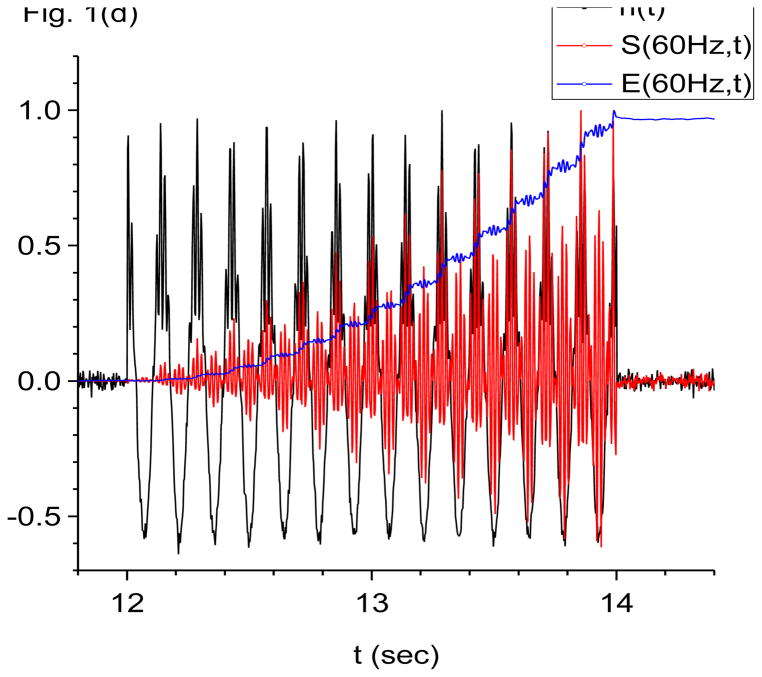
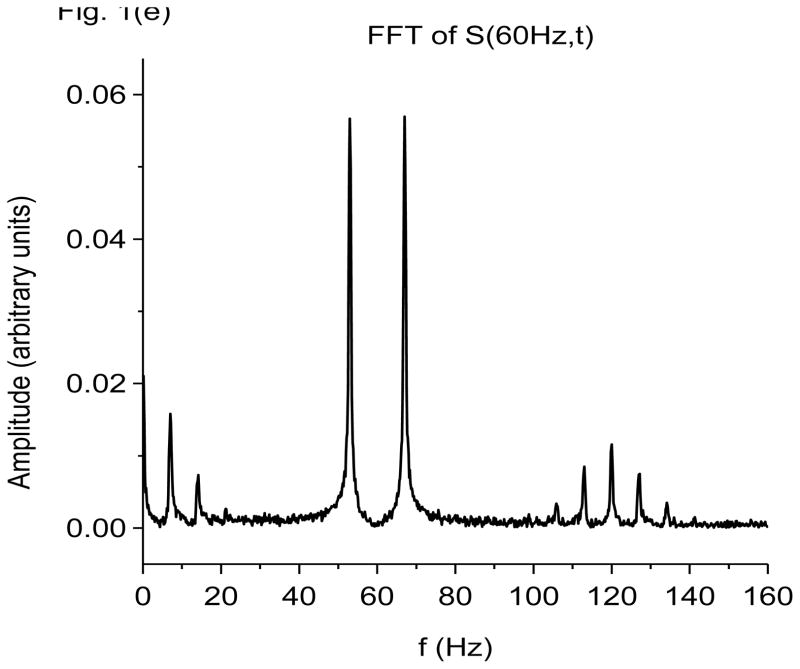
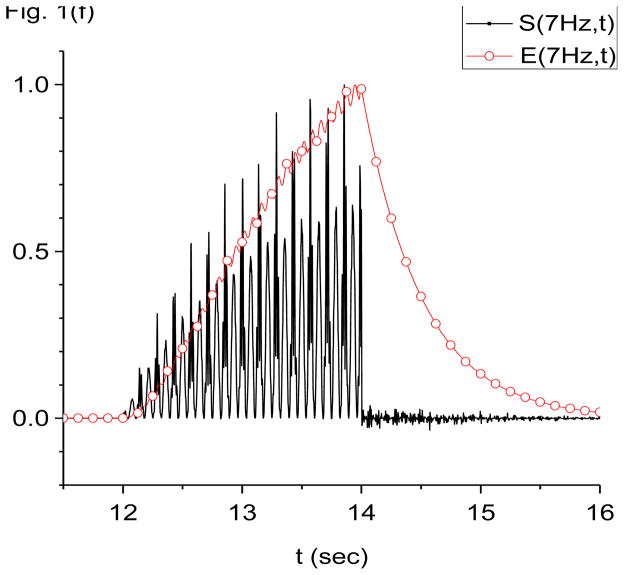
Damped-oscillator pseudo-wavelet analysis of computer generated data using X-DOOD. In these graphs, the computer generated data driving force h(t), data power S(f, t) and total energy measure E(f, t) are all rescaled so that the maximum value of each is equal to one. The friction is zero for all graphs except (f). See text for explanation. (a) Data driving force h(t) = xdata (t) and phase of 7 Hz mathematical oscillator, θ(7 Hz, t). (b) Data driving force h(t) = xdata (t), data power S(f, t) and total energy E(f, t) for the 7 Hz mathematical oscillator. (c) FFT power spectrum (in arbitrary units) of S(f, t) for the 7 Hz mathematical oscillator. (d) Data driving force h(t) = xdata (t), data power S(f, t) and total energy E(f, t) for the 60 Hz mathematical oscillator. (e) FFT power spectrum (in arbitrary units) of S(f, t) for the 60 Hz mathematical oscillator. (f) Data power S(f, t) and total energy E(f, t) for the 7 Hz mathematical oscillator, same as in (b), except here g(n)=1 Hz for all n. Note much slower decay back to baseline for E(f, t) compared to S(f, t).
In Fig. 1(b) we show the data power spectral density of the 7 Hz mathematical oscillator, S(7 Hz, t), and the corresponding total energy spectral density, E(7 Hz, t). The friction is taken to be zero, g(n)= 0 for all n. Also shown for reference is h(t) = xdata (t). All lines in this graph are rescaled so that the maximum values are equal to one. Note that both S(7 Hz, t) and E(7 Hz, t) in Fig. 1(b) begin rising within one time period of the 7 Hz data oscillator being turned on at time t=12 s. When the data oscillators are turned off at time t=14 s, E(7 Hz, t) remains at maximal values indefinitely. In contrast, S(7 Hz, t) drops dramatically by more than an order of magnitude within one time period of the 7 Hz oscillator, to fluctuate about zero. These fluctuations are of larger magnitude than prior to turning on the data oscillators and the baseline looks “noisier” than before. We refer to the increased noise in the baseline after a data oscillation has turned off as the oscillator energy trail of that oscillation.
Also note the “beating effect” in the amplitude of S(7 Hz, t) in Fig. 1(b). The higher amplitude beats occur on the crests of the data time series, h(t) = xdata (t), while the lower amplitude beats occur in the troughs. The reason for the beats is that the data time series exerts a positive driving force (a “push”) on the crests of the 7 Hz data oscillation, while it exerts a negative driving force (a “pull”) in the troughs. Both the pushes and the pulls result in increases in the energy of the 7 Hz mathematical oscillator. The result is that the 7 Hz mathematical oscillator receives energy boosts at a frequency of 14 Hz, or twice the fundamental. Increases in energy cause S(7 Hz, t) to rise, and so S(7 Hz, t) exhibits a beating frequency of 14 Hz. The 14 Hz beating frequency in S(7 Hz, t) shows up strongly in the FFT power spectrum of S(7 Hz, t), shown in Fig. 1(c). Note the absence of a 7 Hz peak. When we later look at biological data, it will be helpful to look for this beating effect, to assure ourselves that a detected oscillation is real. To repeat, a sinusoidal oscillation in the data at a given driving frequency f0 will cause S(f0, t) to increase such that S(f0, t) exhibits beats at twice the fundamental, i.e., at 2 f0.
As an aside, we may also predict that periodic spike trains in the data may be interpreted as a periodic phenomenon that only “pushes” but does not “pull”. In this case, if the spikes occur at a frequency of f0, then S(f0, t) will exhibit beats at the fundamental, i.e., at f0.
To return to Fig. 1(b), note the fine structure on the crests of the data time series, h(t). This fine structure corresponds to the 60 Hz data oscillator, which as described by the exponential factor in Eq. 28 is amplified on the crests of the 7 Hz data oscillator and damped in amplitude in the troughs. The 60 Hz oscillation shows up clearly on the FFT power spectrum of S(7 Hz, t) shown in Fig. 1(c). In Fig. 1(c), we see not only a 60 Hz peak, but also satellite peaks at 60 +/− 7 Hz, 60 +/− 14 Hz, etc. The satellite peaks are due to coupling of the 60 Hz oscillation to the 7 Hz oscillation, and are expected. The coupling arises from the exponential factor in Eq. 28. Expansion of this exponential results in sinusoids with frequencies at 60 +/− 7 Hz, 60 +/− 14 Hz, etc.
In Fig. 1(d), we show the data power of the 60 Hz oscillator, S(60 Hz, t), and the corresponding total energy spectral density, E(60 Hz, t). The friction is still zero, g(n)= 0 for all n. This figure is similar to Fig. 1(b) except a slow 7 Hz modulation of amplitudes is evident in S(60 Hz, t), and the fast beats are much more prominent. Since the resonant fundamental frequency for this mathematical oscillator is 60 Hz, we expect to find 120 Hz beats in its power spectrum. The FFT power spectrum shown in Fig. 1(e) confirms that there are indeed 120 Hz beats, as well as associated satellites. It also shows the expected peaks at 7 Hz, its first harmonic at 14 Hz, and a doublet at 60 +/− 7 Hz. Figure 1(f) shows that turning on a bit of friction, g(n)/2π=1 Hz for all n, helps damp out the energy trail after E(f, t) at 60 Hz. Time resolution is still much better with S(f, t).
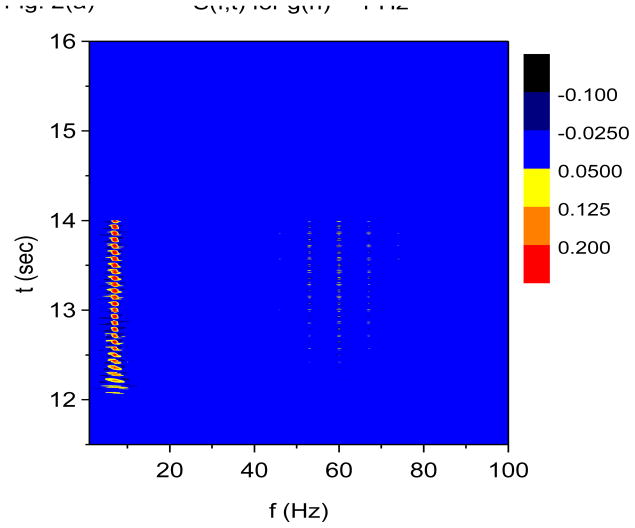
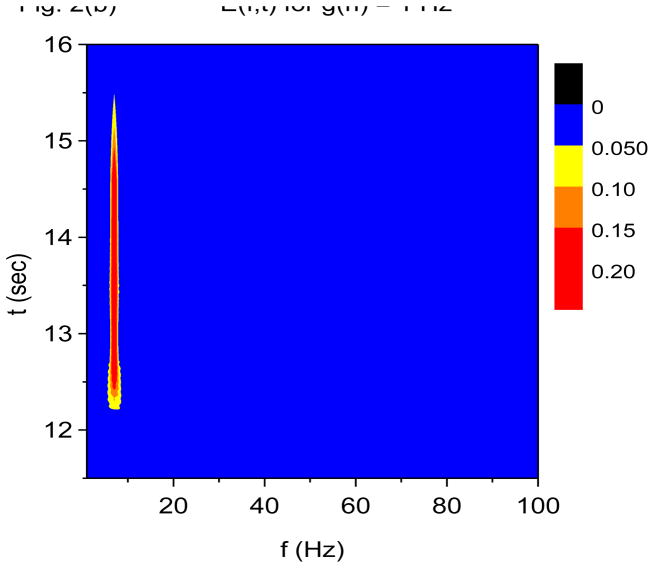
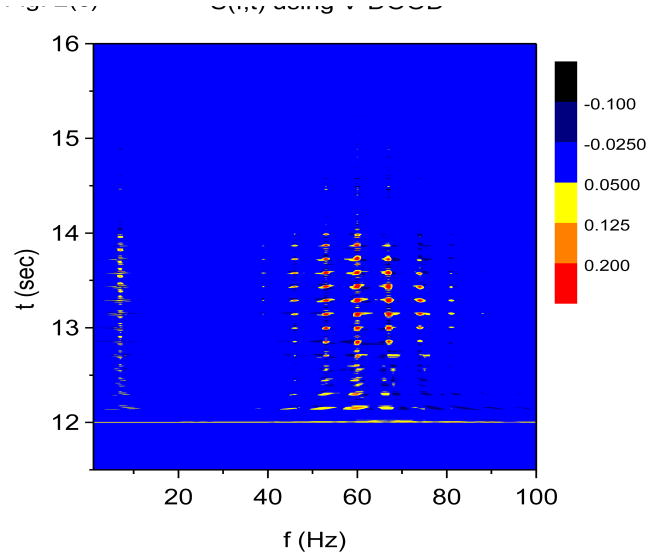
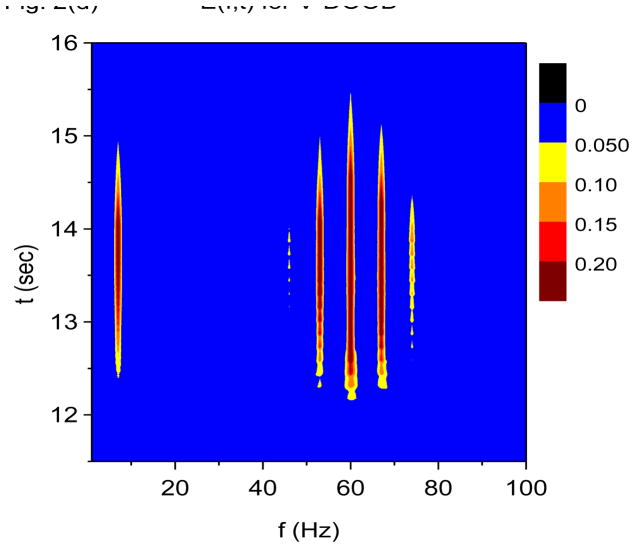
Recall that the X-DOOD algorithm corresponds to taking h(t) = xdata (t), while the V-DOOD algorithm corresponds to taking h(t) = ẋdata (t). Figures 2(a) and 2(b) are time-frequency plots for S(f, t) and E(f, t), respectively, using X-DOOD with g(n)/2π =1 Hz for all n. Figures 2(c) and 2(d) are time-frequency plots for S(f, t) and E(f, t), respectively, using V-DOOD with g(n)/2π=1 Hz for all n. It is seen that X-DOOD is more sensitive to the 7 Hz oscillation while V-DOOD is more sensitive to the 60 Hz oscillation. The relative low frequency bias of X-DOOD and high frequency bias of V-DOOD are expected as discussed earlier. However, we emphasize that X-DOOD and V-DOOD contain the same information but with relatively different emphases. The 60 Hz oscillations are present in X-DOOD but are simply harder to see because the 7 Hz oscillation is so much more prominent. Note that S(f, t) gives better time resolution than E(f, t), and that S(f, t) exhibits the same beating effect seen in Fig. 1.
Figure 2.
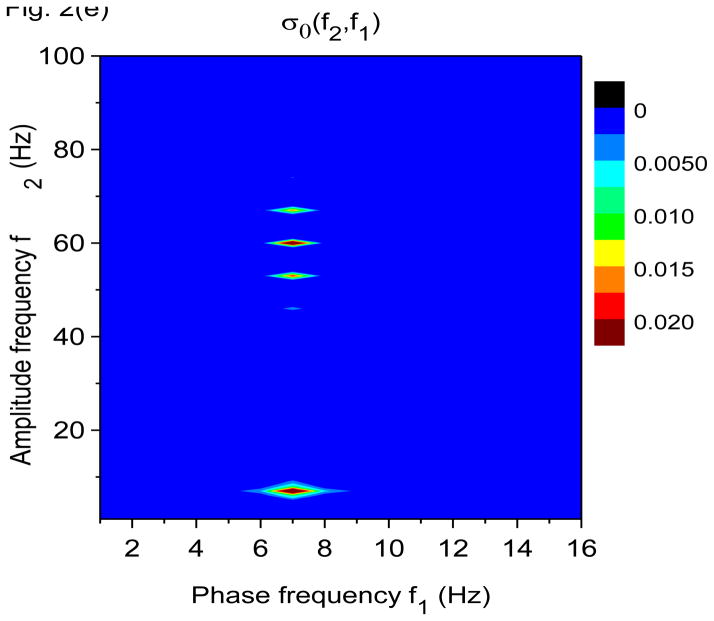
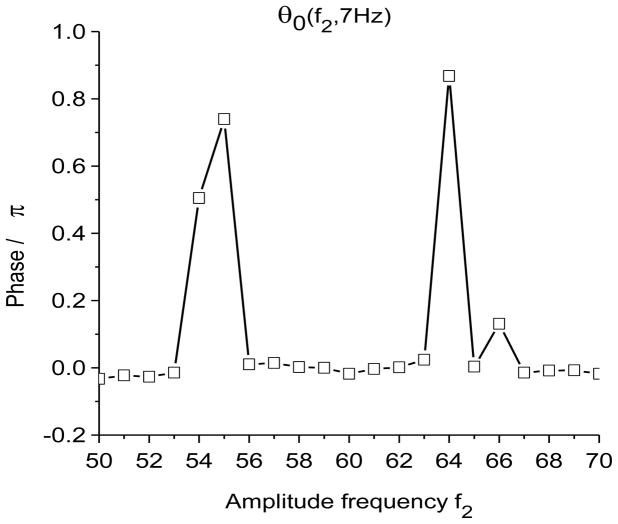
Time-frequency and phase-amplitude analysis applied to computer generated data. The friction is g(n)=1 Hz for all n, except for (e) and (f) where g(n)= 0 for all n. In these graphs, S(f, t) and E(f, t) are rescaled so that the maximum value is equal to one. (a) Time-frequency plot for S(f, t) using X-DOOD, h(t) = xdata (t). (b) Time-frequency plot for E(f, t) using X-DOOD, h(t) = xdata (t). (c) Time-frequency plot for S(f, t) using V-DOOD, h(t) = ẋdata (t). (d) Time-frequency plot for E(f, t) using V-DOOD, h(t) = ẋdata (t). (e) Phase amplitude correlation function σ0 (f2, f1) using X-DOOD. (f) Relative phase θ0(f2, 7 Hz) as a function of amplitude frequency f2.
In Fig. 2(e), we show the phase-amplitude correlation function, σ0 (f2, f1) from Eq. (27). If the 60 Hz oscillation tends to be activated at a certain phase of the 7 Hz oscillation, then σ0(f2, f1) will show a peak at f1= 7 Hz and f2= 60 Hz. The phase frequency is f1 while the amplitude frequency is f2. It is seen from Fig. 2(e) that there is indeed a peak at f1= 7 Hz and f2= 60 Hz, along with a couple of satellite peaks. There is a stronger peak at f1 = f2 = 7 Hz which is the correlation of the 7 Hz oscillation with itself. The phase-amplitude correlation function shown in Fig. 2(e) is calculated with the X-DOOD algorithm with g(n)= 0 for all n. If we were to use the V-DOOD algorithm, the peak at f1 = 7 Hz and f2 = 60 Hz would be larger than the self-correlation peak at f1 = f2 = 7 Hz, because V-DOOD favors higher frequency peaks. The phase of the 7 Hz oscillator at which the amplitude of the 60 Hz oscillator is largest can be read off the graph for θ0(f2, f1), as defined in Eq. (26). In Fig. 2(f) we see that θ0(60 Hz, 7 Hz) ≈ 0, which is the correct phase relationship as shown in Fig. 1(a).
In summary, what we have learned from testing the DOOD algorithm on computer generated data are the following:
When there are oscillators of multiple frequencies present in a given data set, V-DOOD is better for detecting the higher frequency oscillators than X-DOOD, and using X-DOOD alone may cause one to miss the higher frequency oscillations. In fact, V-DOOD does a fairly good job of detecting low frequency oscillations, and may be preferable to X-DOOD as an initial screening tool.
The data power measure S(f, t) gives better time resolution, especially of when an oscillator turns off, than the more conventional total energy measure E(f, t).
The data power measure S(f, t) exhibits a beating effect when a data oscillator is present. This beating effect may help us distinguish an oscillatory signal from non-oscillatory driving forces when dealing with real biological data.
As a point for future study, it may also be possible to analyze the fine structure of these beats in S(f, t), in order to extract further information, such as whether there is coupling between data oscillators of different frequencies.
The instantaneous phase θ(f, t) is a stable, reliable and easily calculated quantity.
The phase-amplitude correlation function, σ0(f2, f1), may be a useful function for detecting phase-modulated coupling of a low frequency oscillation to a higher frequency oscillation. This kind of coupling is thought to be an important mechanism for coding higher order information in the brain (Lisman 2005).
That V-DOOD may be preferable to X-DOOD as an initial screening tool is significant because transforming the raw data represented by the time series xdata (t) into the “velocity” form ẋdata (t) requires taking a numerical time derivative of xdata (t). We use a simple finite difference formula for this derivative. It is known that such numerical derivatives magnify the effect of noise, but as we see in this computer generated example, with Gaussian added noise, V-DOOD was actually superior to X-DOOD in detecting higher frequency oscillations. It may not be surprising that analyzing the velocity form of the raw data time series should be useful, as velocity-based analyses are common in the physical sciences and the velocity-velocity correlation function is related to important dynamical properties of many-body systems such as the diffusion constant (Berne and Pecora 1976). In the next example, where the DOOD algorithm is applied to real biological data acquired from a rat, we will see the V-DOOD again proves itself capable of detecting physiological oscillations, both at low and high frequencies.
3.2 Rat data
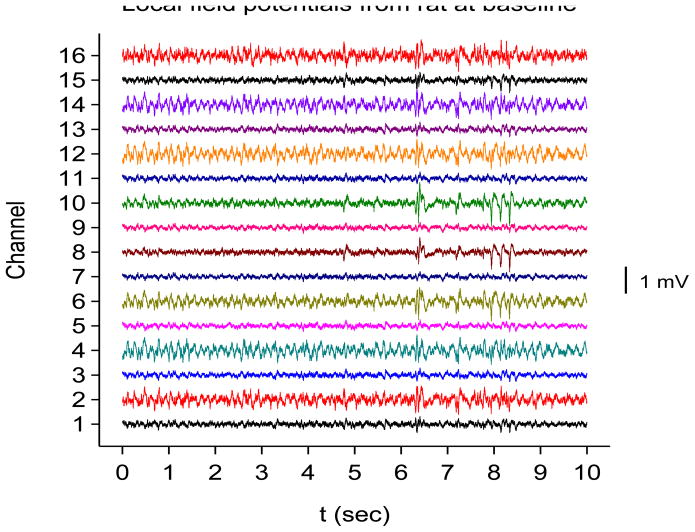
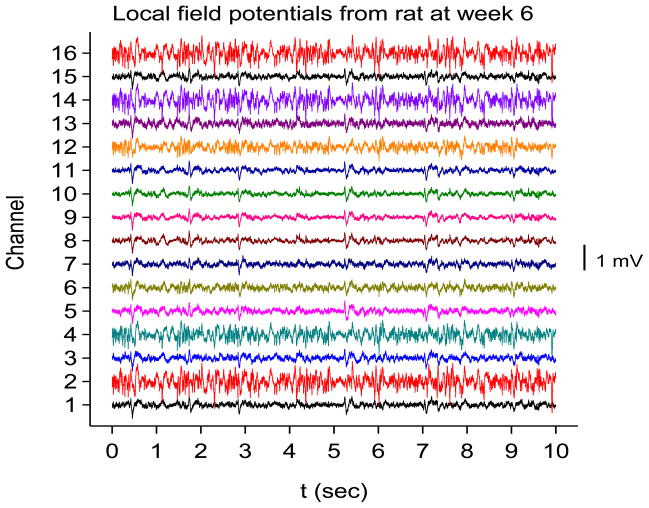
A 16-channel silicon probe was inserted into the right hippocampus of two adult Sprague-Dawley rats. Please see Experimental Methods section below for details. The electrode channels span area CA1, the dorsal blade of the dentate gyrus and the hilus of the dentate gyrus. Two weeks after electrode implantation, status epilepticus was induced with repeated small (5 mg/kg) intraperitoneal doses of kainic acid. Field potentials were sampled at a frequency of fS=12,207.03 Hz and filtered online between 2 Hz and 6000 Hz. Recordings were saved just prior to injection of kainic acid, immediately after injection of kainic acid, and at weekly intervals out to week 6 after kainic acid injection. By six weeks out, the rats were clearly epileptic, with frequent clinical seizures noted. Each recording was at least 2 minutes in duration. Sample interictal traces from one of these rats at baseline (prior to kainic acid injection) and six weeks after kainic acid injection are shown in Figs. 3(a) and 3(b).
Figure 3.
Sample local field potentials recorded from rat hippocampus with an electrode with 16 contacts. The first contact is in the alveus (bottom tracing) and the last contact is in the hilus of the dentate gyrus (top tracing). See Experimental Methods for a list of recording sites determined histologically. (a) Recording from a rat just before kainic acid injection. (b) Same rat, 6 weeks after kainic acid injection.
The choice of this experimental system to study was motivated by the focus of our research groups on changes in brain dynamics with epileptogenesis. In this paper, we will not explore all of these changes in detail, but rather our main intent here is to demonstrate the use of the DOOD algorithm. The results of this initial analysis are presented here for one of these rats.
By inspection, it appears that the electrode outputs from channels 2, 4, 6, 12, 14, and 16 are very similar to one another. We shall refer to these as group I channels. We suspect these channels reflect activity in neuronal layers, although they do not match up exactly with later histology (see the Experimental Methods section below). Similarly, the outputs from the remaining channels are more or less similar to one another. We suspect these channels are in the non-neuronal layers, and we will refer to them as group II channels. Detailed analysis of all 16 channels through the six weeks after kainic acid injection will be presented in a future paper. For now, we show results from analyzing channels 16 and 1 only. Based on histology, we believe channel 1 to be in the alveus while channel 16 is in the hilus of the dentate gyrus.
For this data, we wish to cover a wide frequency range, and so we use a geometric frequency grid, as discussed earlier in Section 2.1. The frequency of the nth mathematical oscillator is given by f(n) = f(n −1)[1+ g0 ] where f(1)= 0.5 Hz. We take g0= 0.02 and define the friction for the nth mathematical oscillator to be g(n)/2π= g0 f(n). This choice allows us to span the frequency range from 0.5 Hz to 6000 Hz with only Nf= 476 mathematical oscillators. We average S(f, t) over consecutive time windows each of duration tdump, where tdump is varied between 4 ms and 1 s. The resulting averages for S(f, t) are plotted as functions of both frequency and time.
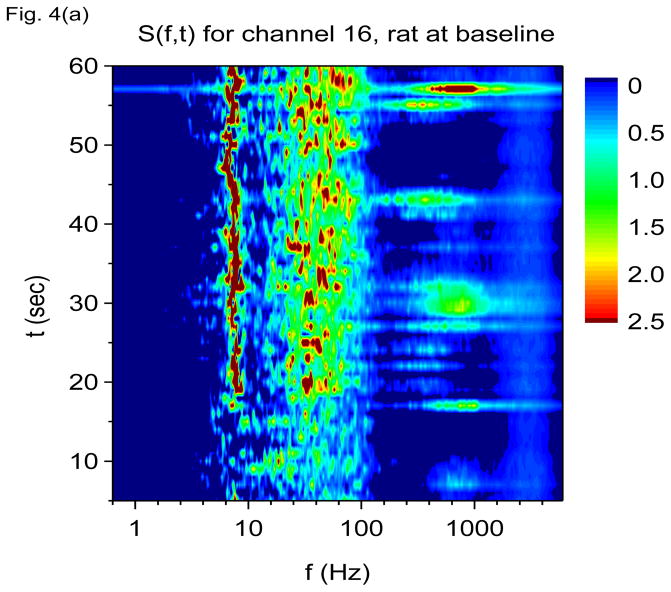
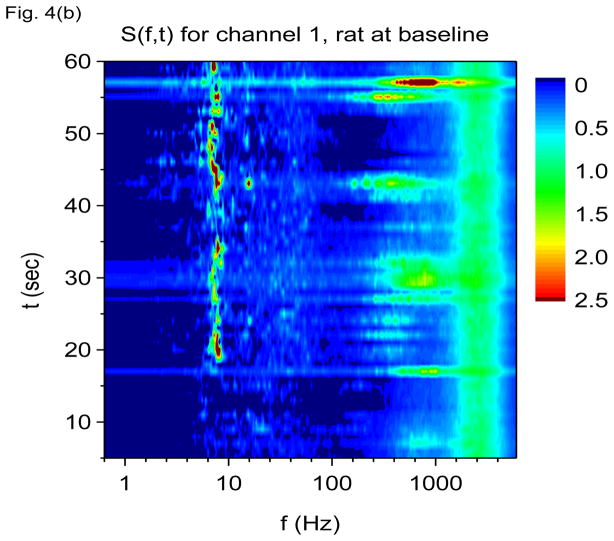
Shown in Fig. 4(a) and 4(b) are S(f, t) using V-DOOD with tdump=1 sec for channels 16 and 1 at baseline, just prior to kainic acid injection. The theta oscillation at 7 Hz is the most prominent finding. There is also a broad gamma frequency band centered at 60 Hz, and intermittently there are bursts of higher frequency activity centered at 600 Hz. A yet higher frequency band centered at 2000 Hz may also be discerned. The theta and gamma bands are most prominent in channel 16 while the 2000 Hz band is better seen in channel 1. The 600 Hz band is seen clearly in both channels 16 and 1. The 600 Hz activity appears to be intermittent while the 7 Hz, 60 Hz and 2000 Hz activity appear to be nearly continuous.
Figure 4.
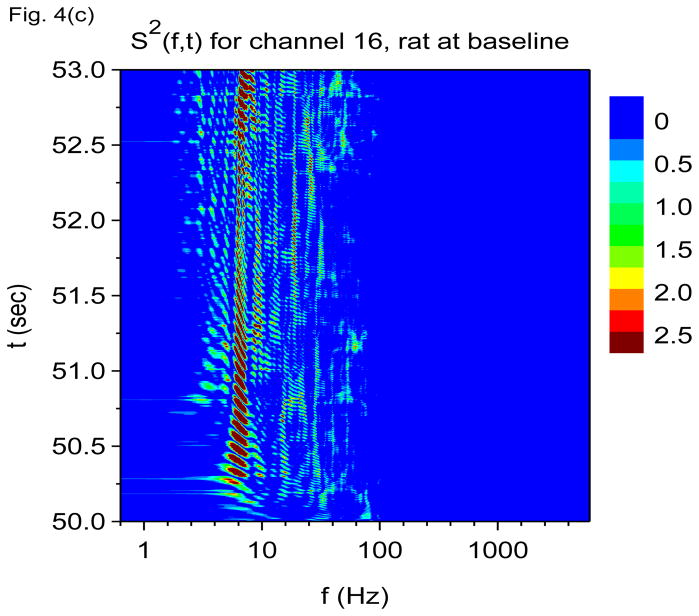
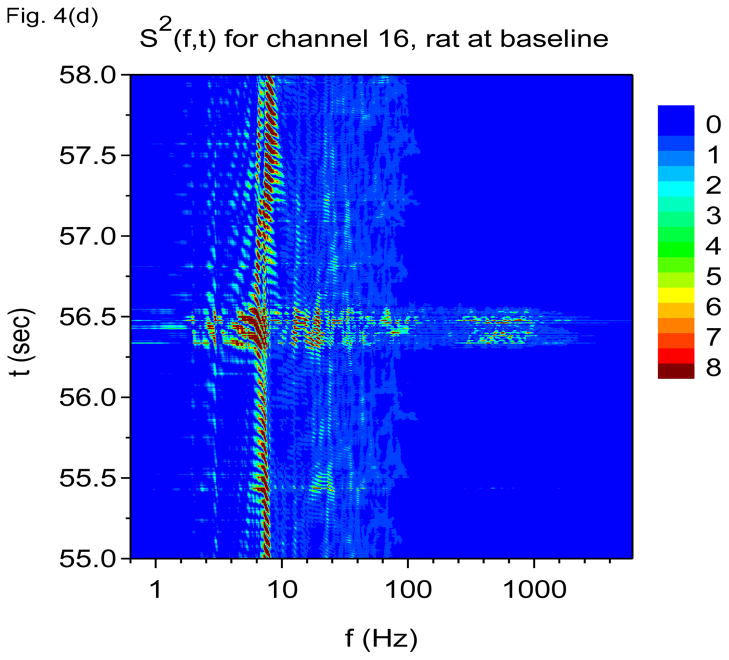
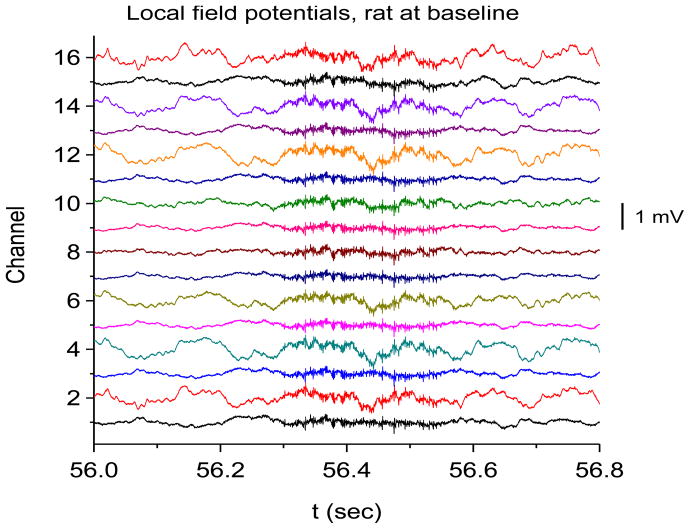
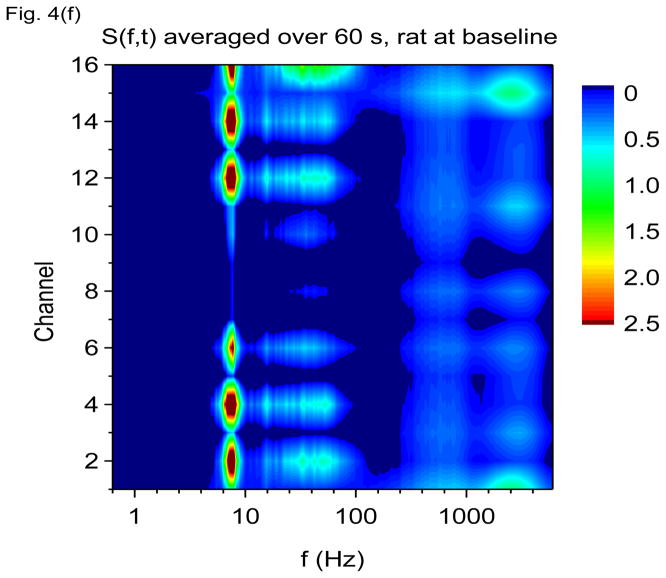
Time-frequency V-DOOD spectra from intrahippocampal rat recordings at baseline, prior to kainic acid injection. In these graphs, S(f, t) is rescaled by subtracting out the mean and dividing by the standard deviation. The mean and standard deviation are calculated over all channels, mathematical oscillator frequencies and time up to 60 secs. Note the logarithmic scale on the horizontal frequency axis for all of these plots. (a) S(f, t) time-frequency plot from channel 16 with tdump=1 sec. (b) Same as in (a) but for channel 1. (c) S2(f, t) time-frequency plot from channel 16 with tdump=5 msec. (d) Same as in (c) but with a different time interval to show the 600 Hz burst at around time t= 56.4 sec. (e) Local field potentials from the 16 channel electrode to depict the 600 Hz burst at around time t= 56.4 sec. (f) S(f, t), averaged over 60 seconds of data.
To appreciate the finer temporal structure, we show in Figs. 4(c) and 4(d) the square of the data power, S2(f, t), averaged over shorter time windows of duration tdump=5 msec. Squaring the data power before time averaging prevents large cancellations between positive and negative variations in mathematical oscillator energy. Seen in Figs. 4(c) and 4(d) is a strong 7 Hz oscillation which now exhibits the expected “beating” effect. The gamma band can now also be seen to be composed of many distinct gamma frequency oscillations which come and go. The time-frequency patterns created by the theta and gamma frequencies are quite intricate. Figure 4(d) is a magnification of the burst of 600 Hz activity at around time t = 56.4 sec. We see that this burst is coupled to increased activity in the 7 Hz and 60 Hz bands, and we see that the boundaries between these bands are respected and not crossed.
Are the 600 Hz and 2000 Hz bands “real” or could they be due to external artifact? Although Fig. 4(d) shows that the burst of 600 Hz activity is time correlated with increased activity at both 7 Hz and in the 60 Hz band, note the absence of a “beating” effect in the 600 Hz band, as compared with the 7 Hz and 60 Hz activity. This finding suggests that the activity in the 600 Hz band is not oscillatory. The 600 Hz band may represent simply fast, non-oscillatory activity.
Figure 4(e) shows a magnification of the local field potential 600 Hz burst near time t = 56.4 sec, depicted in the time domain, which shows only a high frequency “buzz” in all 16 channels at the time of the 600 Hz burst. No clear evidence of external artifact is present around this time. Figure 4(f) shows the data power averaged over the first 60 secs and plotted as a function of frequency and channel number. In this figure, it is clear that the theta and gamma oscillations co-localize to the same hippocampal layers (which we suspect to be the neuronal layers), while the 600 Hz and 2000 Hz activity co-localize to a different set of layers. The only exception is channel 6, which shows activity from all four frequency bands. If the 600 Hz or 2000 Hz band activity were from external noise, one would not expect localization of these bands to distinct hippocampal layers, but rather all the layers should be involved to a similar extent, or there should be a unidirectional gradient in amplitude. The 600 Hz band may be related to the high frequency oscillations (HFO’s) observed by others (Worrell, Gardner et al. 2008; Zijlmans, Jacobs et al. 2009; Bragin, Engel et al. 2010). We do not know what the 2000 Hz band could possibly correspond to. It is much too fast to be related to neuron-to-neuron synaptic communication. It might be related to fast local ion flows, possibly in the dendritic trees, neuronal cell membranes or in the distal axonal arborizations. Future work is necessary to sort this out.
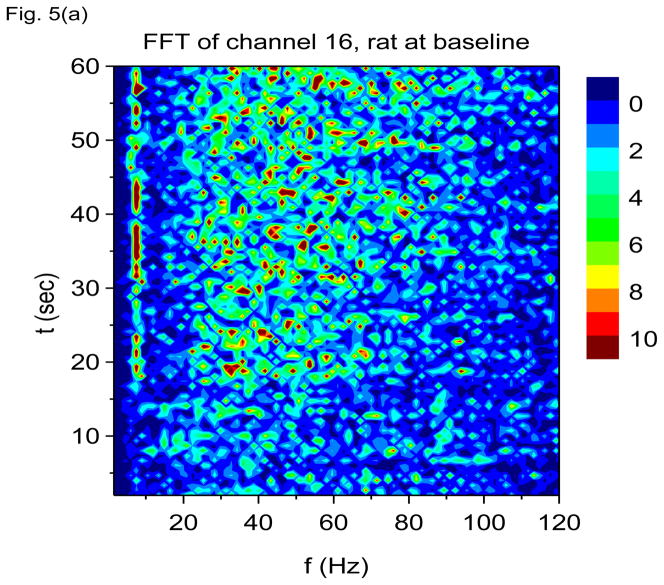
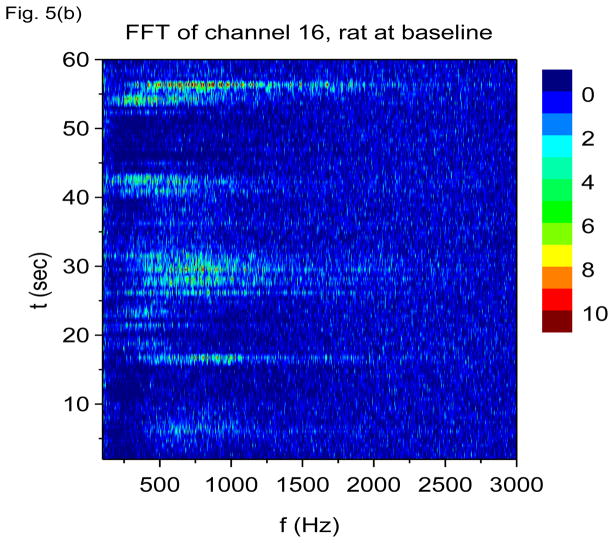
In Figs. 5(a) and 5(b) we show results of finite non-overlapping time-windowed FFT time-frequency analysis applied to the same data, with time windows chosen to be 0.67 sec in duration. Prior to application of the fast Fourier transform, the data is first converted to its first time derivative, i.e., FFT is performed on h(t) = ẋdata (t), which we refer to as V-FFT. A time window of 0.67 sec implies that time resolution is itself 0.67 sec (rather poor) with a frequency resolution of 1/0.67 = 1.49 Hz. If we take shorter time windows in order to improve time resolution, the frequency resolution would be degraded and we may not be able to resolve the 7 Hz oscillation. Nonetheless, V-FFT shows the same basic information as V-DOOD, namely, that there is a strong 7 Hz oscillation, a wider 60 Hz band, and occasional 600 Hz activity. We have plotted the V-FFT results on a linear frequency scale, to emphasize that FFT is more naturally calculated on a linear (not geometric) scale. Note that the beautifully intricate time-frequency structure seen using the V-DOOD S2(f, t) measure fails to show up using V-FFT. It may be possible to bring out the fine structure with multiscale windowing (Thomson 1982; Mitra and Pesaran 1999; Groechenig 2001), but this would require more computational effort. The CPU time for computing each of Figs. 5(a) and 5(b) was about 5.7 secs. In comparison, a similar effort using V-DOOD with the same time and frequency resolution takes about 26 secs. As expected, FFT with non-overlapping time windows is much faster than DOOD. Nonetheless, we find for our purposes that DOOD is tolerably fast.
Figure 5.
V-FFT time-frequency power spectra with h(t) = ẋdata (t) from channel 16 from the rat prior to kainic acid injection. Non-overlapping time windows of 0.67 sec were used, with a total time interval of 60 secs and frequency resolution of 1.49 Hz. In these graphs, each power spectrum is rescaled by subtracting out the mean and dividing by the standard deviation. The mean and standard deviation are calculated over all channels, FFT frequencies and time up to 60 secs. (a) Frequency range from 1.49 Hz to 120 Hz. (b) Frequency range from 100 Hz to 3000 Hz.
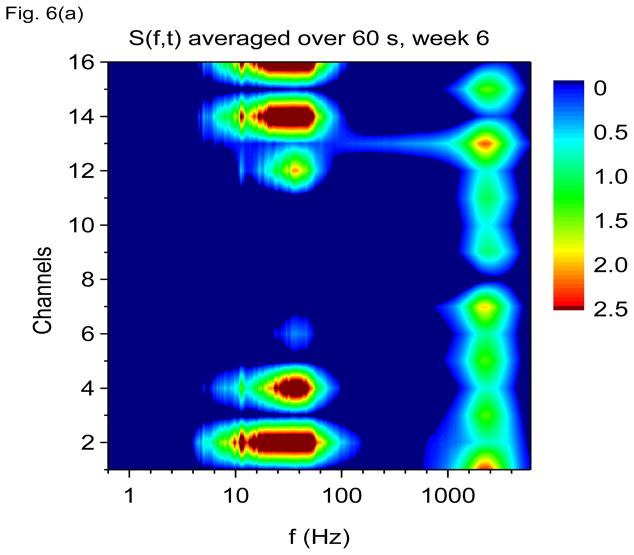
In Fig. 6(a) we show S(f, t) averaged over 60 seconds from the same rat 6 weeks after kainic acid injection. At this point, the rat exhibits frequent spontaneous seizures. Figure 6(a) shows that the 7 Hz theta oscillation has been severely degraded as to be virtually undetectable. The gamma band has expanded to absorb the theta oscillation and there is no longer a clear separation between theta and gamma bands. The 600 Hz band has also been degraded, while the 2000 Hz band has grown in prominence, but note that the 2000 Hz band is still localized to distinct layers of the hippocampus, being more prominent in layers in which the gamma oscillation is less prominent.
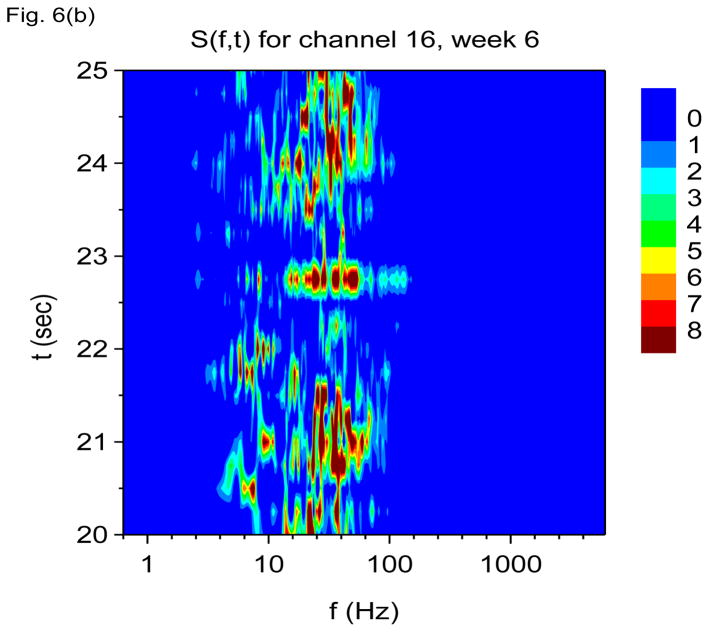
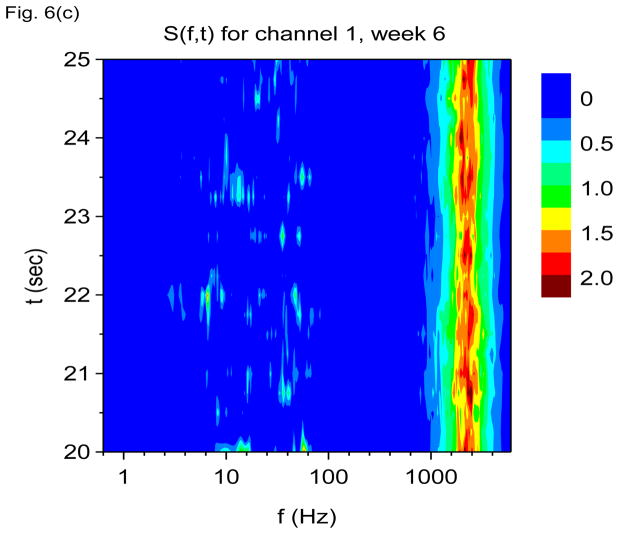
Figure 6.
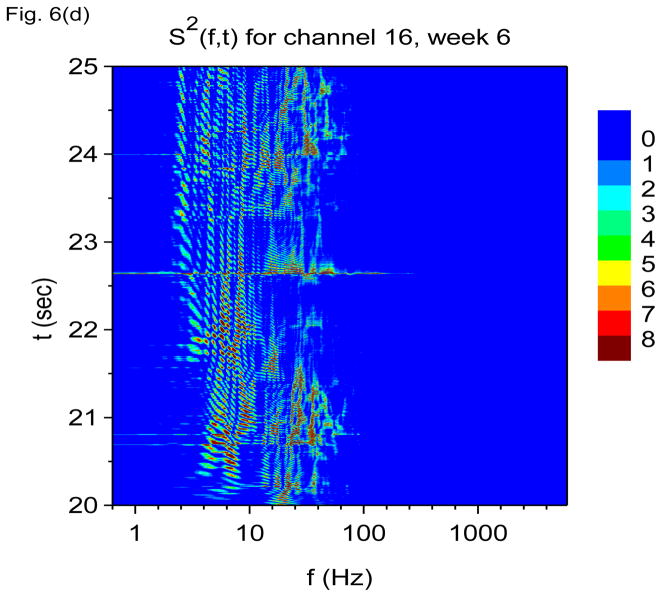
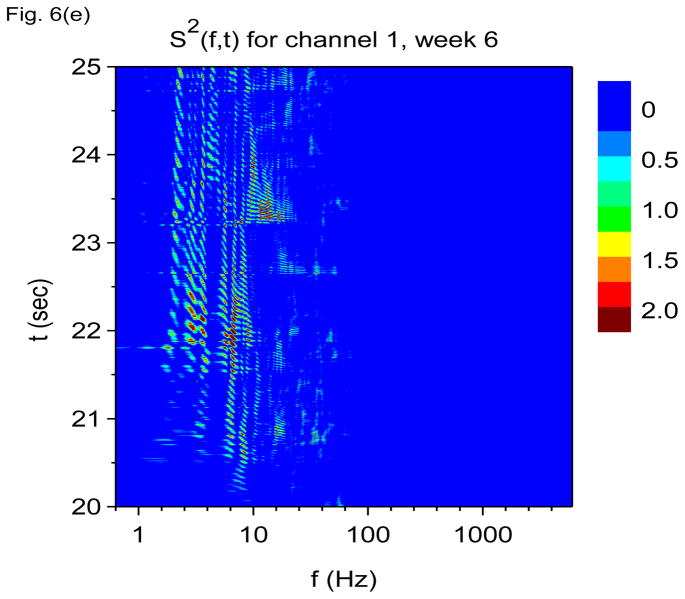
Time-frequency V-DOOD spectra with h(t) = ẋdata (t) from intrahippocampal rat recordings at six weeks after kainic acid injection. In these graphs, S(f, t) is rescaled by subtracting out the mean and dividing by the standard deviation. (a) S(f, t) for each of the 16 channels, averaged over 60 secs. (b) S(f, t) with tdump= 0.25 sec for channel 16. (c) Same as (b) but for channel 1. (d) S2(f, t) time-frequency plot from channel 16 with tdump= 4 msec. (e) Same as (d) but for channel 1.
Figure 6(b) shows S(f, t) for channel 16 averaged over time windows of duration tdump= 250 msec. We see that activity is now dominated by gamma frequency discharges rather than theta. Figure 6(c) shows S(f, t) for channel 1, also with tdump= 250 msec. Activity in this channel is now dominated by the 2000 Hz band.
To look more closely at the finer time-frequency structure, we plot the square of the data power, S2(f, t), averaged over time windows of duration tdump= 4 msec, shown in Figs. 6(d) and 6(e). Again one sees beautifully intricate time-frequency patterns spanning theta through gamma frequencies, but now there is not a dominant theta rhythm, and there is no clear boundary between the theta and gamma bands. It is as though gamma oscillations have invaded into theta territory and disrupted the normally dominant theta oscillation. The loss of clear separation between theta and gamma bands and the degradation of the dominant theta rhythm with epileptogenesis may impair the ability of the epileptic brain to couple gamma oscillations to the theta rhythm. If such theta-gamma coupling is important for cognitive performance (Lisman 2005), then the disruption of theta-gamma coupling may contribute to cognitive impairment in epileptic rats.
It may also appear that the gamma oscillations are not as well formed in Fig. 6(d) as in Fig. 4(c). In Fig. 4(c), each gamma oscillation is a clean vertical line, but in Fig. 6(d), the beginnings of each oscillation is a triangular clump, and each oscillation peters out quickly. We are not certain if this finding will hold up with more detailed studies, but we will return to this point in future studies.
We have also noted that the squared data power measure, S2(f, t), appears to be more sensitive to low frequency structure and not as sensitive to high frequency structure. If one were to plot the Figs. 6(d) and 6(e) on a logarithmic scale, it is possible to see the high frequency band at 2000 Hz, but this band appears only as a small hump. It seems that S(f, t) is more sensitive to high frequency activity than S2(f, t).
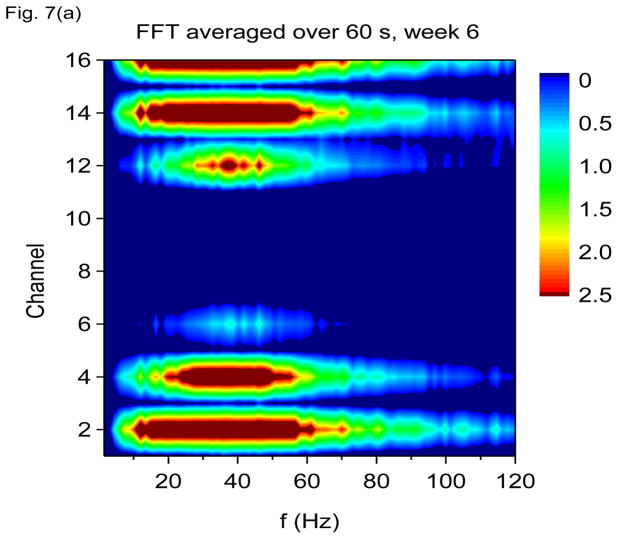
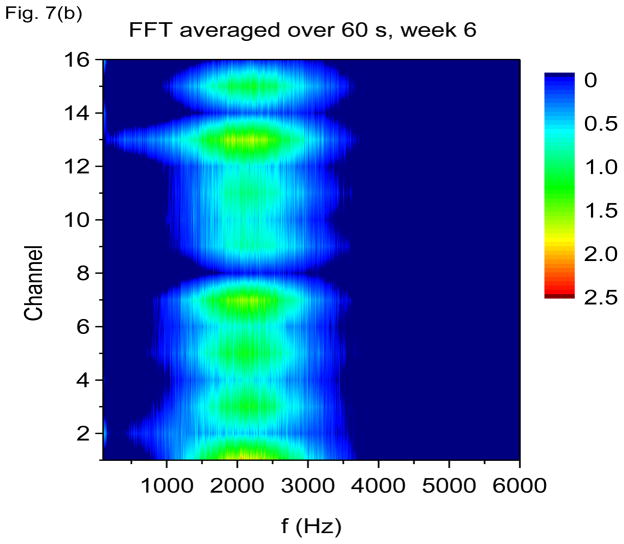
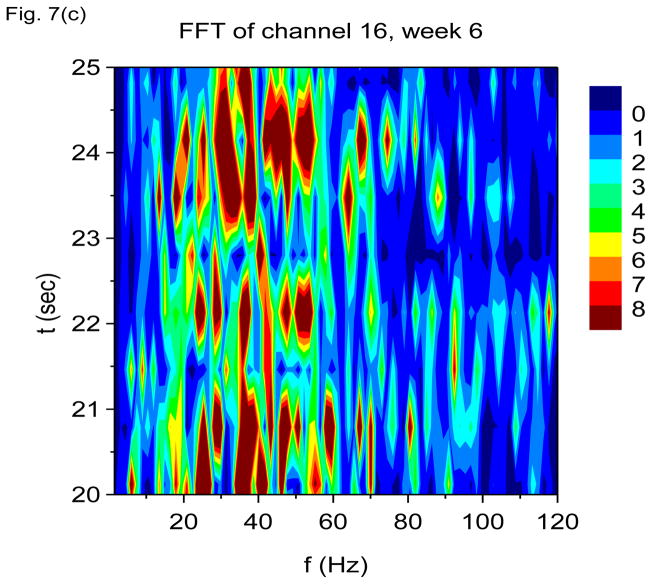
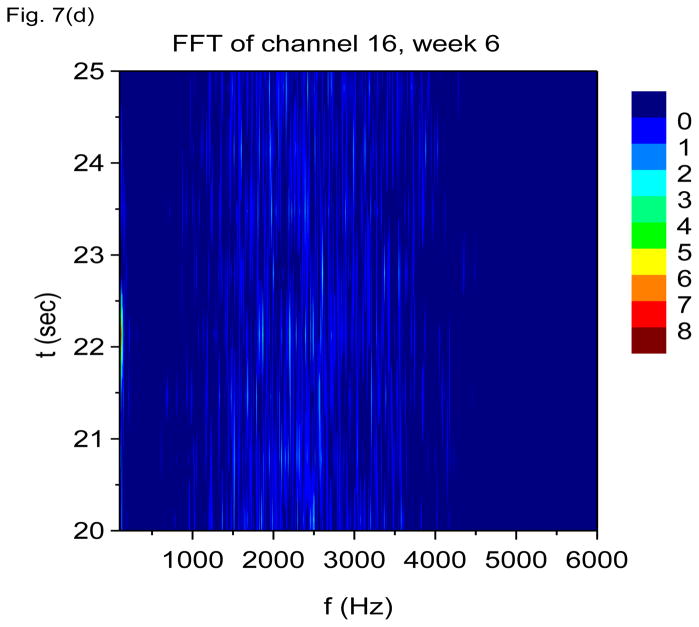
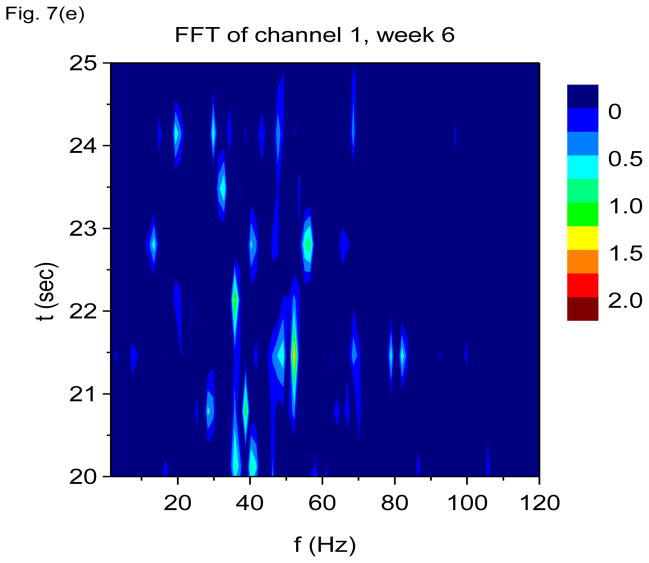
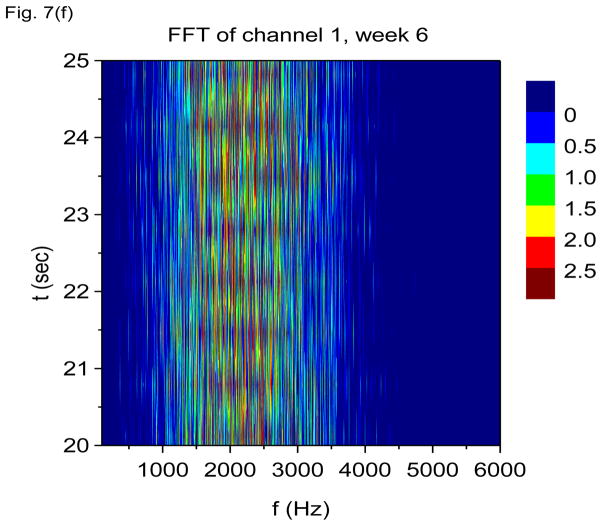
In Figs. 7(a) through 7(f), we show non-overlapping time windowed V-FFT results at 6 weeks after status epilepticus using time windows of 0.67 sec. These figures are in agreement with those using S(f, t), showing loss of the theta rhythm and expansion of the gamma band down to theta frequencies. The 2000 Hz band has grown in prominence, but it is most prominent in those channels where the gamma rhythm is weakest. However, Figs. 7(c) and 7(e) shows that V-FFT is rather poor at showing the fine time-frequency structure that is so striking when using V-DOOD S2(f, t).
Figure 7.
V-FFT frequency and time-frequency power spectra from the rat with h(t) = ẋdata (t) at six weeks after kainic acid injection. Non-overlapping time windows of 0.67 sec were used, with a total time interval of 60 secs and frequency resolution of 1.49 Hz. (a) Power spectrum for each channel averaged over all 60 secs, frequency range 1.49 Hz to 120 Hz. (b) Same as (a) but with frequency range from 100 Hz to 6000 Hz. (c) Time-frequency power spectrum of channel 16 using non-overlapping time windows of 0.67 sec and frequency range from 1.49 Hz to 120 Hz. (d) Same as (c) but with frequency range from 100 Hz to 3000 Hz. (e) Time-frequency power spectrum of channel 1 using non-overlapping time windows of 0.67 sec and frequency range from 1.49 Hz to 120 Hz. (f) Same as (e) but with frequency range from 100 Hz to 3000 Hz.
4. Discussion
In this paper, our main goal is to introduce the DOOD algorithm. More detailed analysis of the time-frequency spectra of in vivo rat (and human) data will be presented in future publications, including more detailed study of the 600 Hz and 2000 Hz bands. Nonetheless, the results shown here suggest a striking richness of time-frequency structure in the normal rat, which is altered after the rat undergoes epileptogenesis. If we believe that oscillations underlie the function of the brain (Buzsaki 2006), then the fine details of the behaviors of these oscillations – when they arise, where they arise, for how long and in what relation to other oscillations – must contain interesting information about how the brain works and what happens to it in disease. It would also be of interest to know whether the 2000 Hz activity is reproducible in other experiments, and if so, to determine from where it arises. Is it generated in the dendritic tree, in cell membranes, or from somewhere else? We were initially inclined to dismiss it as artifact, but the fact that the 2000 Hz activity is most prominent in specific hippocampal layers suggests that it may not be due to artifact, or at least not due to artifact external to the hippocampus. We do have data from a second rat, prepared the same way as described here, for which 2000 Hz activity is also seen and which also grows in prominence after status epilepticus.
Others have described the same pseudo-wavelet presented here but without identifying its relationship to damped harmonic oscillators (Szu, Telfer et al. 1992; Vazquez, Mazilu et al. 2005). The spectral density tested by those authors was the total energy measure, E(f, t), not the data power measure, S(f, t), nor the squared power measure, S2(f, t), introduced here. We expect the data power and squared power measures to be capable of better time and frequency resolution. In application to an example consisting of computer generated data, we showed that the data power measure yields better time and frequency resolution than the total energy measure. As shown in Fig. 2, the time resolution even at zero friction is remarkable. The better time resolution allows us to use lower levels of friction which in principle should yield an improved frequency resolution as well.
Does the data power measure of the damped-oscillator pseudo-wavelet give better time and frequency resolution than other wavelets or pseudo-wavelets? We have not compared the damped-oscillator pseudo-wavelet directly with other wavelets. However, unless a wavelet or pseudo-wavelet is especially chosen to match a particular application, there are not usually dramatic differences in time and frequency resolution between them. Since all other wavelet and pseudo-wavelet methods define spectral density in terms of the equivalent of the total energy measure, it is possible that the data power measure introduced here may be superior to them as well.
The velocity form of the damped-oscillator pseudo-wavelet (V-DOOD) is more sensitive to high frequency activity while the coordinate form (X-DOOD) is more sensitive to low frequency activity. This property is common to all methods of time-frequency analysis; that is, all time-frequency methods have analogous coordinate and velocity forms with the same relative sensitivities to low and high frequency activity. It is generally good practice to scan data with both forms so as not to miss either low or high frequency activity. However, our experience has been that V-DOOD is fairly good at detecting even low frequency activity while X-DOOD is relatively insensitive to higher frequency activity. Thus we favor V-DOOD over X-DOOD, at least as an initial screening tool.
In application to in vivo rat data, we found that the squared data power measure shows intricate time-frequency structure at low frequencies. The square of the data power brings out this structure somewhat better than the data power itself.
In summary, we have developed a novel pseudo-wavelet approach for time-frequency analysis that is intuitively appealing, easy to use, and provides striking time-frequency resolution. The damped-oscillator pseudo-wavelet is particularly useful when multiple time scales are involved spanning several orders of magnitude or more, and when one wishes to have maximal flexibility in deciding which frequency ranges to monitor. Our preliminary results suggest a richness of time-frequency structure in local field potentials in a rat brain undergoing epileptogenesis, that invites further study.
5. Experimental methods
Adult, Spraque-Dawley rats were anesthetized with 2% isoflurane after pretreatment with atropine (2 mg/kg) and placed in a stereotaxic apparatus. The area of incision was injected with 0.5 ml of 0.5% bupivacaine for prolonged local anesthesia/analgesia and burr holes for the recording probe and ground screw were placed by conventional surgical techniques. The depth-recording electrode, a 16-channel silicon probe (NeuroNexus, Inc., Ann Arbor, MI), was implanted in the right hippocampus (3.0 mm posterior, 2.6 mm lateral, 3.1 mm ventral), spanning CA1, dorsal dentate gyrus, and the hilus at 100 micron intervals. A skull screw was placed in the left frontal bone to serve as ground. Dental acrylic was used to secure the electrodes according to standard chronic methods. Postoperative analgesia was administered once daily (buprenorphrine 0.01 mg/kg, subcutaneous). At two weeks following electrode implantation, kainic acid (Tocris Bioscience, Ellisville, MO) was administered in repeated, low doses (5 mg/kg, intraperitoneal) hourly until each rat experienced convulsive status epilepticus for >3 h (Hellier, Patrylo et al. 1998).
Simultaneous in vivo field potential recordings from 16-channel silicon probes were obtained in freely-moving rats during each recording session. Field potentials were recorded at a sampling frequency of 12,207.03 Hz and filtered on-line between 2 Hz and 6000 Hz using a Tucker Davis Technologies recording system (Alachua, FL). Off-line conversion of the electrographic data to f32 binary files was accomplished using custom-written software developed in MATLAB® (The MathWorks, Inc., Natick, MA).
After completion of long-term recordings epileptic rats were perfused with 0.01M phosphate buffered saline followed by an aqueous solution of aldehyde fixatives (4% paraformaldehyde-0.5% glutaraldehyde). The brains were removed, post-fixed overnight in same fixative solution, and sectioned on a Pelco Vibratome 1500 sectioning system into 100-μm coronal sections. The sections were wet-mounted in 0.9% saline and imaged with a digital camera (Spot II; Diagnostic Instruments, Sterling Heights, MI) on a Nikon E600 Eclipse epifluorescent microscope with ×1–4 planapochromatic objectives in order to locate and measure the recording tracts. Brightfield images were acquired at an initial 36-bit tone scale and saved as 16-bit files. The final images were prepared in Adobe Photoshop 7.0. Adjustments in tone scale, gamma, contrast, and hue and subsequent sharpening with the unsharp mask algorithm were applied to the entire image. The 16 recording sites along the probe length were reconstructed and associated with relevant hippocampal structures using histological measurements and the known inter-site intervals. Electrodes 1–3 were in stratum oriens of CA1, with electrode 1 probably in alveus. Electrodes 4–5 were in the pyramidal cell layer. Electrodes 6–7 were in stratum radiatum. Electrodes 8–9 were in the lacunosum moleculare layer. Electrodes 10–11 were in the molecular layer of the dentate gyrus. Electrodes 12–13 were in the dentate granule cell layer. Electrodes 14–16 were in the hilus of the dentate gyrus.
Institutional regulations for the care of all animals were strictly adhered to. Animals that are persistently ill after induction of seizures or that suffer frequent, prolonged seizures are euthanized.
Research Highlights.
Time-frequency analysis using mathematical oscillators to detect data oscillators
High time-frequency resolution
Fast and convenient to use
Tested on computer generated and in vivo electrophysiological data
Acknowledgments
DH was supported by the NIH Loan Repayment Program. TPS was supported by NIH R01-25020. GAW was supported by NIH R01-NS63039-01.
Abbreviations
- DOOD
damped-oscillator oscillator detector
- FFT
fast Fourier transform
Footnotes
Publisher's Disclaimer: This is a PDF file of an unedited manuscript that has been accepted for publication. As a service to our customers we are providing this early version of the manuscript. The manuscript will undergo copyediting, typesetting, and review of the resulting proof before it is published in its final citable form. Please note that during the production process errors may be discovered which could affect the content, and all legal disclaimers that apply to the journal pertain.
References
- Allen DP, MacKinnon CD. Time-frequency analysis of movement-related spectral power in EEG during repetitive movements: A comparison of methods. J Neurosci Methods. 2009;186(1):107–115. doi: 10.1016/j.jneumeth.2009.10.022. [DOI] [PMC free article] [PubMed] [Google Scholar]
- Axmacher N, Henseler MM, et al. Cross-frequency coupling supports multi-item working memory in the human hippocampus. Proceedings of the National Academy of Sciences. 2010;107(7):3228–3233. doi: 10.1073/pnas.0911531107. [DOI] [PMC free article] [PubMed] [Google Scholar]
- Berne BJ, Pecora R. Dynamic Light Scattering. New York: Wiley; 1976. [Google Scholar]
- Bragin A, Engel JJ, et al. High-frequency oscillations in epileptic brain. Current Opinion in Neurology. 2010;23(2):151–156. doi: 10.1097/WCO.0b013e3283373ac8. [DOI] [PMC free article] [PubMed] [Google Scholar]
- Buzsaki G. Rhythms of the Brain. New York: Oxford University Press; 2006. [Google Scholar]
- Canolty RT, Edwards E, et al. High gamma power is phase-locked to theta oscillations in human neocortex. Science. 2006;313(5793):1626–8. doi: 10.1126/science.1128115. [DOI] [PMC free article] [PubMed] [Google Scholar]
- Cohen A, Kovacevic J. Wavelets: The mathematical background. Proceedings of the IEEE. 1996;84(4):514–522. [Google Scholar]
- Cohen L. Time-frequency distributions - a review. Proceedings of the IEEE. 1989;77(7):941–981. [Google Scholar]
- Daubechies I. The wavelet transform, time-frequency localization and signal analysis. IEEE Transactions on Information Theory. 1990;36(5):961–1005. [Google Scholar]
- Farge M. Wavelet transforms and their application to turbulence. Annual Review of Fluid Mechanics. 1992;24:395–457. [Google Scholar]
- Graps A. An introduction to wavelets. IEEE Computational Science & Engineering. 1995;2(2):50–61. [Google Scholar]
- Groechenig K. Foundations of Time-Frequency Analysis. Boston: Birkhauser; 2001. [Google Scholar]
- Hellier JL, Patrylo PR, et al. Recurrent spontaneous motor seizures after repeated low-dose systemic treatment with kainate: assessment of a rat model of temporal lobe epilepsy. Epilepsy Res. 1998;31(1):73–84. doi: 10.1016/s0920-1211(98)00017-5. [DOI] [PubMed] [Google Scholar]
- Hsu D, Hsu M, et al. An algorithm for detecting oscillatory behavior in discretized data: the damped-oscillator oscillator detector. 2007 Aug 9; from arxiv.org/abs/0708.1341.
- Le Van Quyen M, Bragin A. Analysis of dynamic brain oscillations: methodological advances. Trends Neurosci. 2007;30(7):365–73. doi: 10.1016/j.tins.2007.05.006. [DOI] [PubMed] [Google Scholar]
- Le Van Quyen M, Foucher J, et al. Comparison of Hilbert transform and wavelet methods for the analysis of neuronal synchrony. J Neurosci Methods. 2001;111(2):83–98. doi: 10.1016/s0165-0270(01)00372-7. [DOI] [PubMed] [Google Scholar]
- Lisman J. The theta/gamma discrete phase code occuring during the hippocampal phase precession may be a more general brain coding scheme. Hippocampus. 2005;15(7):913–22. doi: 10.1002/hipo.20121. [DOI] [PubMed] [Google Scholar]
- Mitra PP, Pesaran B. Analysis of dynamic brain imaging data. Biophys J. 1999;76(2):691–708. doi: 10.1016/S0006-3495(99)77236-X. [DOI] [PMC free article] [PubMed] [Google Scholar]
- Oonincx PJ. Mathematical Signal Analysis: Wavelets, Wigner Distribution and a Seismic Application. Amsterdam: Centrum voor Wiskunde en Informatica; 2000. [Google Scholar]
- Qiu J, Pawu UK, et al. Pseudo-wavelet analysis of turbulence patterns in 3 vegetation layers. Boundary-Layer Meteorology. 1995;72(1–2):177–204. [Google Scholar]
- Senhadji L, Wendling F. Epileptic transient detection: wavelets and time-frequency approaches. Neurophysiologie Clinique/Clinical Neurophysiology. 2002;32(3):175–192. doi: 10.1016/s0987-7053(02)00304-0. [DOI] [PubMed] [Google Scholar]
- Storti S, Formaggio E, et al. Wavelet Analysis as a Tool for Investigating Movement-Related Cortical Oscillations in EEG-fMRI Coregistration. Brain Topography. 2009;23(1):46–57. doi: 10.1007/s10548-009-0117-2. [DOI] [PubMed] [Google Scholar]
- Szu HH, Telfer B, et al. Causal analytical wavelet transform. Optical Engineering. 1992;31:1825–9. [Google Scholar]
- Thomson DJ. Spectrum estimation and harmonic analysis. Proceedings of the IEEE. 1982;70(9):1055–1096. [Google Scholar]
- Vazquez JM, Mazilu M, et al. Wavelet transforms for optical pulse analysis. Journal of Optical Society of America A. 2005;22:2890–9. doi: 10.1364/josaa.22.002890. [DOI] [PubMed] [Google Scholar]
- Wilson DK, V, Ostashev E, et al. Quasi-wavelet formulations of turbulence and other random fields with correlated properties. Probabilistic Engineering Mechanics. 2009;24(3):343–357. [Google Scholar]
- Worrell GA, Gardner AB, et al. High-frequency oscillations in human temporal lobe: simultaneous microwire and clinical macroelectrode recordings. Brain. 2008;131(Pt 4):928–37. doi: 10.1093/brain/awn006. [DOI] [PMC free article] [PubMed] [Google Scholar]
- Zaveri HP, Williams WJ, et al. Time-frequency representation of electrocorticograms in temporal lobe epilepsy. IEEE Trans Biomed Eng. 1992;39(5):502–9. doi: 10.1109/10.135544. [DOI] [PubMed] [Google Scholar]
- Zijlmans M, Jacobs J, et al. High frequency oscillations and seizure frequency in patients with focal epilepsy. Epilepsy Res. 2009;85(2–3):287–92. doi: 10.1016/j.eplepsyres.2009.03.026. [DOI] [PMC free article] [PubMed] [Google Scholar]


