Abstract
Oligodendrocytes (OLs), the predominant cell type found in cerebral white matter, are essential for structural integrity and proper neural signaling. Very little is known concerning stroke-induced OL dysfunction. Our laboratory has shown that infusion of human umbilical cord blood (HUCB) cells protects striatal white matter tracts in vivo and directly protects mature primary OL cultures from oxygen glucose deprivation (OGD). Microarray studies of RNA prepared from OL cultures subjected to OGD and treated with HUCB cells showed an increase in the expression of 33 genes associated with OL proliferation, survival, and repair functions, such as myelination. The microarray results were verified using quantitative RT-PCR for the following eight genes: U2AF homology motif kinase 1 (Uhmk1), insulin induce gene 1 (Insig1), metallothionein ( Mt3), tetraspanin 2 (Tspan2), peroxiredoxin 4 (Prdx4), stathmin-like 2 (Stmn2), myelin oligodendrocyte glycoprotein (MOG), and versican (Vcan). Immunohistochemistry showed that MOG, Prdx4, Uhmk1, Insig1 and Mt3 protein expression were upregluated in the ipsilateral white matter tracts of rats infused with HUCB cells 48 hrs after middle cerebral artery occlusion (MCAO). Furthermore, promoter region analysis of these genes revealed common transcription factor binding sites, providing insight into the shared signal transduction pathways activated by HUCB cells to enhance transcription of these genes. These results show expression of genes induced by HUCB cell therapy that could confer oligoprotection from ischemia.
Keywords: Stroke, white matter, human umbilical cord blood cells, ischemia, microarray, anti-oxidant
1. Introduction
Stroke is the third leading cause of death in the United States, with ischemic strokes accounting for 83% of all strokes (Lloyd-Jones et al., 2009). Ischemic brain injury affects both white and gray matter. Although white matter integrity is essential to proper neuronal communication, much of current research is focused exclusively on neuronal damage. Accounting for 50% of brain volume in humans, white matter and the oligodendroglia that myelinate these areas play an integral role in proper brain function (Miller et al., 1980). The myelin produced by OLs not only supports axonal structural integrity, but is also essential in impulse integration (Baumann and Pham-Dinh, 2001). Thus, white matter protection is necessary to dampen stroke-induced injury and its progressive pathology (Arai and Lo, 2009).
In addition to myelination, OLs support the survival and function of neurons by regulating axonal size and ion channel clustering. OLs also secrete trophic factors such as BDNF, NGF, GDNF and IGF-1, all of which aid in cell survival and maintenance (Baron-Van Evercooren et al., 1991; Kaplan et al., 1997; Noble, 2005; Wilkins et al., 2003). Of the different types of glia, OLs are the most vulnerable to hypoxic and hypoglycemic conditions, yet the precise mechanisms underlying this susceptibility are unknown (Lyons and Kettenmann, 1998).
HUCB cell therapy is an emerging treatment for CNS injury. The immaturity of HUCB cells contribute to the characteristic low immunogenicity (Sanberg et al., 2005). HUCB cells are less immunogenic than other stem cell treatments such as bone marrow and thus elicits lower immunomodulatory effects (Sanberg et al., 2005; Wang et al., 2009). In vivo, HUCB cells migrate to the site of injury, resulting in reduced infarct volumes, neuroprotection and preservation of white matter following MCAO (Hall et al., 2009; Newcomb et al., 2006; Newman et al., 2005; Vendrame et al., 2004). Furthermore, multipotential stem cells derived from HUCB cells secrete neuroprotective, angiogenic and anti-inflammatory factors resulting in a functional recovery in spinal cord injuries (Chua et al., 2010). In vitro experiments showed that in addition to growth factors, HUCB cells secrete cytokines, matrix metalloproteinase inhibitors, and interleukins (Neuhoff et al., 2007). Additionally, HUCB cells co-incubated with OLs reduced OGD-induced apoptosis by decreasing activated caspase 3 (Hall et al., 2009). Despite these potent protective actions and known soluble factors, the precise pathways involved in HUCB cell-mediated OL survival have yet to be elucidated.
The present study examined changes in the gene expression profiles of primary OL cultures subjected to OGD to elucidate the protective pathways induced by co-incubation with HUCB cells. Microarray results revealed that 33 genes were significantly increased in OLs co-incubated with HUCB cells and exposed to OGD. The upregulation of the following genes were confirmed by qRT-PCR: Uhmk1, Insig1, Mt3, Tspan2, Prdx4, Stmn2, MOG, and Vcan gene expression. Immunohistochemical analysis of tissues from rats treated with HUCB cells 48 hrs after MCAO demonstrated increased protein expression of Uhmk1, Insig1, Mt3, Tspan2, Prdx4, and MOG. Future experiments identifying the mechanisms by which HUCB cells enhance the expression of protective genes in OLs will provide insight into novel therapies to combat stroke-induced white matter injury.
2. Results
Characterization of Mature OLs
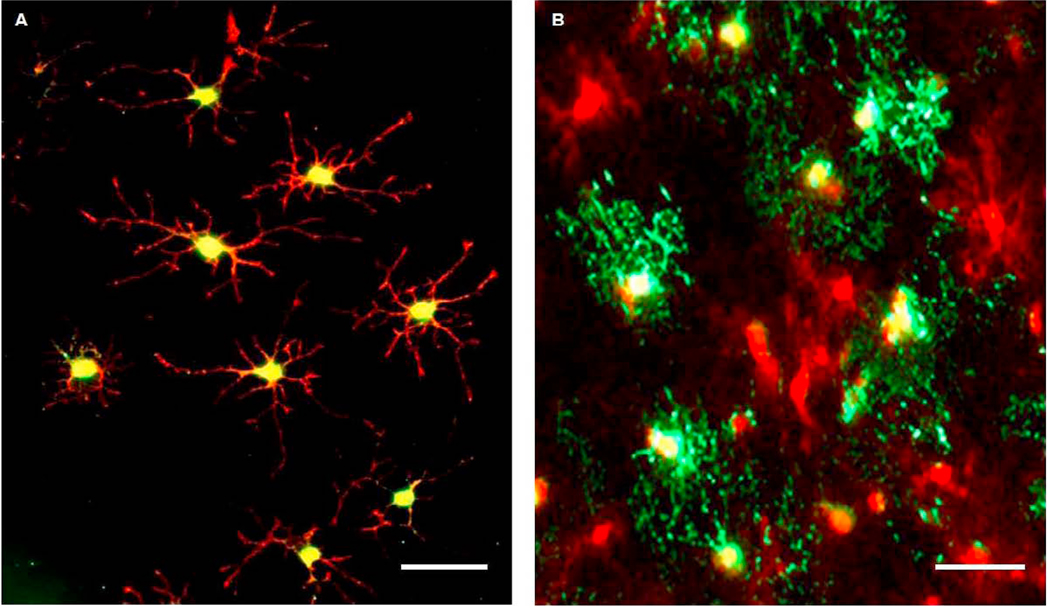
Antibodies specific for NG2, O4 and MBP were utilized in double immunofluorescence staining to determine OL developmental stage in vitro (Fig. 1). NG2 is a reliable marker throughout the course of OL differentiation in vitro, while O4 is expressed by immature OLs. Furthermore, the expression of myelinating proteins such as MBP denotes the mature OL phenotype. Six hours following PDGF-AA withdrawal, NG2 and O4 colocalized in OLs with immature morphology as indicated by the relatively low number of processes (Fig. 1A). MBP was not detected at this time point. By 36 hrs following PDGF-AA removal, colocalization of NG2 and MBP (Fig. 1B) was evident in OL cultures. The prominent upregulation of MBP and the increased number of OL processes at 36 hrs signifies the progression of OLs to the mature phenotype that is present in the adult rat brain.
Fig 1. OLs differentiate into the mature phenotype.
Photomicrographs show immunofluorescent staining of OL cultures at selected time points following PDGF-AA withdrawal. (A) 6 hrs after withdrawal, NG2 (red) and O4 (green) colocalized in OLs that exhibited both bipolar and immature morphology, as indicated by the lateralized orientation of processes and the relatively low number of processes, respectively. (B) At 36 hrs, NG2-positive OLs (red) expressed MBP (green) and contained greater numbers of processes, indicating that this withdrawal period was sufficient for differentiation into the mature phenotype. Scale bars = 50µm.
Secreted Factors from HUCB Cells Protect Mature OLs
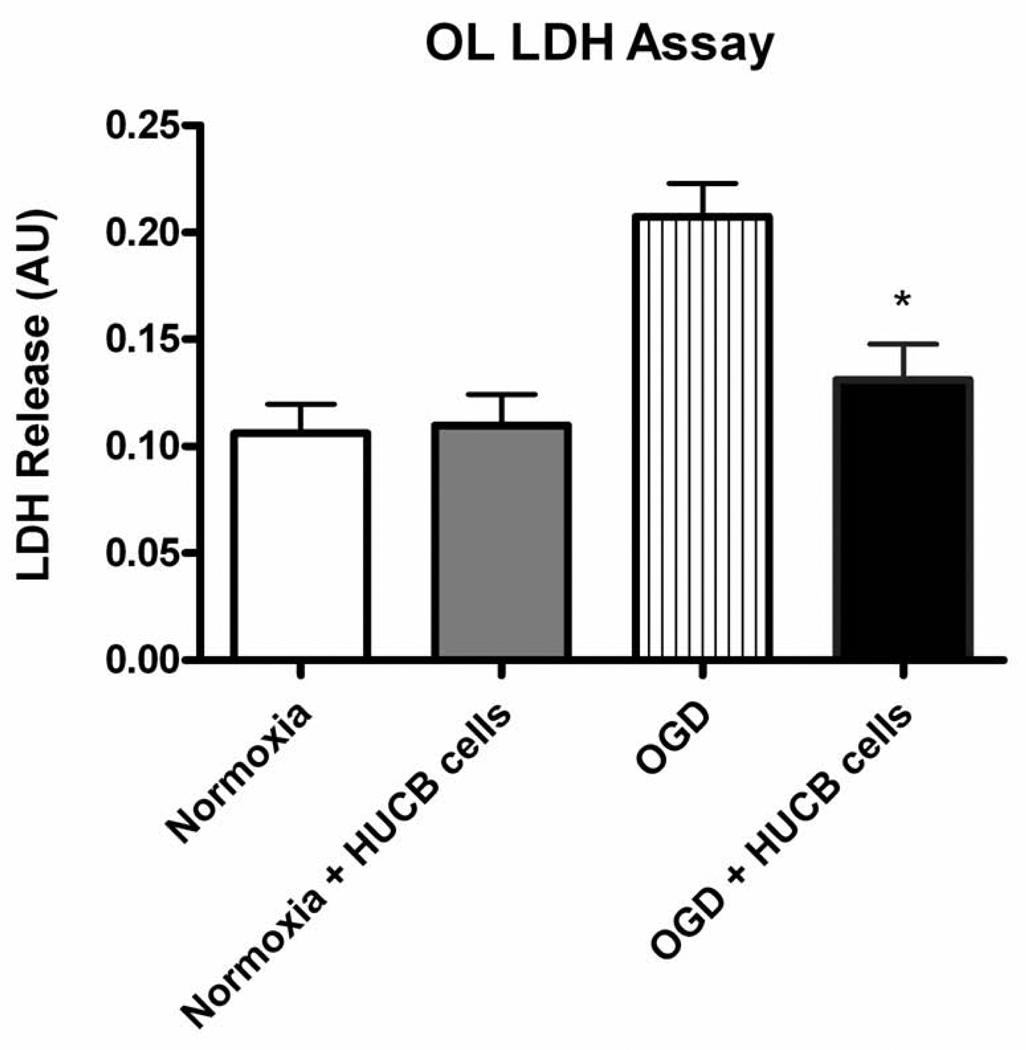
Cell death is associated with LDH release through the plasma membrane, and therefore media levels of LDH were measured to assess OL injury after OGD (Fig. 2). Media from OL cultures exposed to OGD showed significantly increased LDH levels compared to that from normoxic controls (p < 0.01, n = 7). Furthermore, HUCB cell treatment demonstrated oligoprotection. Media from OL cultures co-incubated with HUCB cells and subjected to OGD showed significantly reduced LDH levels relative to cultures subjected to OGD alone (p < 0.05, n = 7). Importantly, the fact that HUCB cells were separated from OLs by transwell inserts indicates that HUCB cells exerted these protective effects through the release of soluble factors rather than through direct cellular contact.
Fig 2. HUCB cells decrease LDH release from OLs subjected to 24 hrs OGD.
Media from OL cultures subjected to OGD-only contained elevated levels of LDH compared to media from normoxic controls, demonstrating OGD-induced cellular injury. OL cultures subjected to OGD were rescued by co-incubation with HUCB cells, as LDH release was reduced back to levels of normoxic controls (*p < 0.01, n=7).
HUCB Cell Protection is Associated with Changes in Gene Expression
Affymetrix microarray was utilized to detect changes in gene expression elicited by HUCB cells that were co-incubated with OLs during OGD. Of the 33 genes detected, eight genes encoding proteins associated with OL proliferation, survival, and repair functions were selected for further investigation (Table 1, bold font): Uhmk1, Insig1, Mt3, Tspan2, Prdx4, Stmn2, MOG, and Vcan. Genes listed in Table 1 exclude expressed sequence tags and exhibit fold changes ≥1.5 compared to OGD controls.
Table 1. HUCB cell treatment alters gene expression in OLs subjected to 24 hrs OGD.
Table shows OL genes for which HUCB cell treatment during OGD caused a fold change ≥ 1.5 compared to non-treated OGD controls. Genes were grouped based on functional relevance, and those associated with OL survival, proliferation, and myelination (bold font) were selected for further investigation.
| Genes and Function | Fold Change |
|
|---|---|---|
| Antioxidant/Free Radical Scavenging | ||
| Metallothionein 3 | 1.64 | |
| Peroxiredoxin 4 | 5.27 | |
| Lipid Biosynthesis/Myelination | ||
| UDF galactosyltransferase 8A | 1.68 | |
| Insulin induced gene 1 | 1.71 | |
| 3-hydroxy-3-methylglutaryl-Coenzyme A synthase 1 | 1.73 | |
| Myelin Oligodendrocyte Glycoprotein | 1.92 | |
| Isopentenyl-diphosphate delta isomerase | 2.22 | |
| Growth/Proliferation | ||
| Rhoa | 1.62 | |
| Crystallin, alpha B | 1.72 | |
| U2AF homology motif (UHM) kinase 1 | 1.97 | |
| Integrin linked kinase | 1.99 | |
| Guanine nucleotide binding protein, alpha o | 2.22 | |
| Translin-associated factor X | 2.96 | |
| S 100 calcium binding protein A6 (calcyclin) | 3.54 | |
| Ret proto-oncogene | 3.91 | |
| Protein kinase C, beta 1 | 5.34 | |
| lumican | −5.73 | |
| Pleckstrin homology-like domain, family A, member 1 | −20.77 | |
| Structural | ||
| Tetraspanin 2 | 1.54 | |
| Actin related protein 2/3 complex, subunit 1A | 1.56 | |
| Vimentin | 1.63 | |
| Microtubule-associated protein tau | 1.72 | |
| Actin related protein 2/3 complex, subunit 1B | 1.78 | |
| Tropomyosin 1, alpha | 2.03 | |
| Versican | 2.54 | |
| Ral GEF with PH domain and SH3 binding motif 2 | 2.70 | |
| Stathmin-like 2 | 2.73 | |
| Microtubule-associated protein 2 | 5.50 | |
| Metabolic | ||
| Translocase of inner mitochondrial membrane 8 homolog b (yeast) | 1.67 | |
| Translocase of inner mitochondrial membrane 10 homolog (yeast) | 1.73 | |
| Acyl-CoAthioesterase 2 | −69.70 | |
| Signaling | ||
| Endothelial different lysophosphantidic and G-protein-coupled receptor.2 | 2.46 | |
| Phospholipase D1 | 3.20 | |
qRT-PCR Verification of Microarray Results
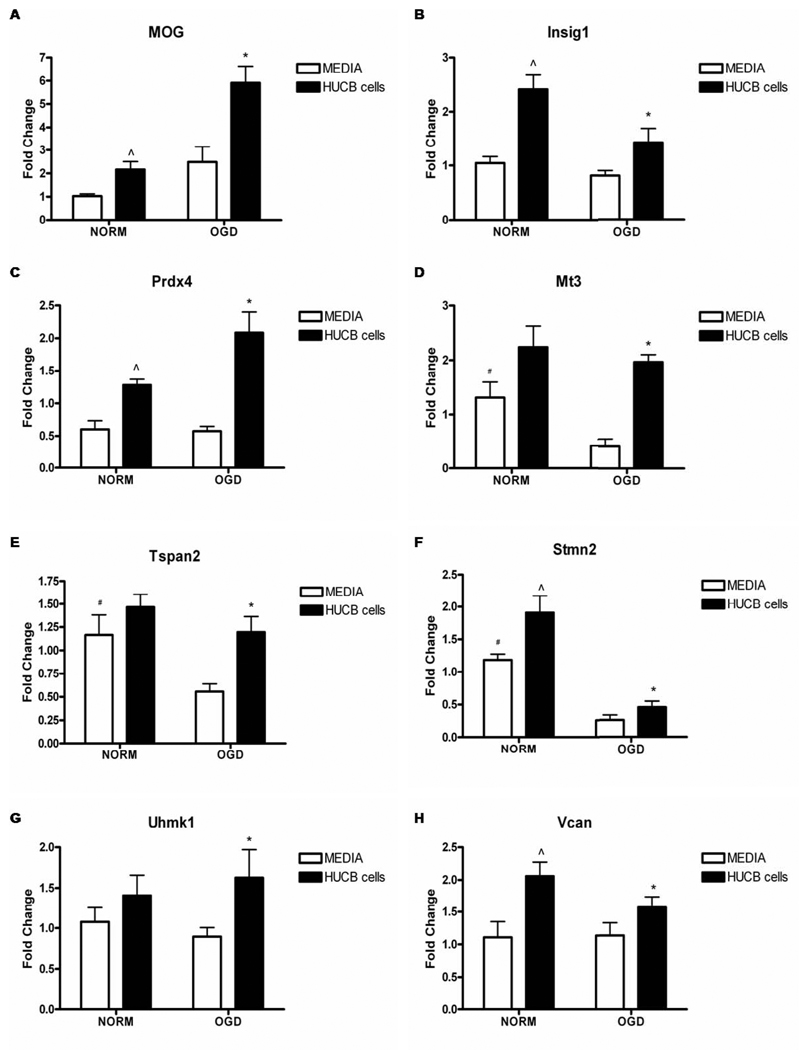
qRT-PCR was performed to validate gene expression data obtained by microarray analysis. RNA was collected from supplementary experiments in which HUCB cell co-incubation rescued OLs subjected to 24 hrs OGD. qRT-PCR confirmed results obtained by microarray (Fig. 3). HUCB cell treatment increased expression of all selected genes (Fig. 3A–H) when compared to OLs subjected to OGD without HUCB cell treatment (p< 0.05). In addition, OGD reduced the expression of Mt3, Tspan2, and Stmn2 (Fig. 3D–F) relative to normoxic controls (p< 0.05). HUCB cells also increased the gene expression of MOG, Insig1, Prdx4, Mt3, Stmn2, and Vcan (Fig. 3A–D, F, H) under normoxic conditions when compared to normoxia only controls. Furthermore, a trend was also observed whereby HUCB cell treatment during OGD either maintained or increased mRNA expression levels relative to those of normoxic controls for all genes except Stmn2.
Fig 3. Affymetrix gene array fold changes are confirmed by qRT-PCR.
HUCB cell treatment of OLs exposed to 24 hrs OGD significantly increased gene expression of MOG, Insig1, Prdx4, Mt3, Tspan2, Stmn2, Uhmk1 and Vcan (A–H) as compared to OLs subjected to OGD alone (* p < 0.05, n = 5). Additionally, HUCB cell treatment of OLs exposed to normoxia increased the expression of MOG (A), Insig1 (B), Prdx4 (C), Stmn2 (F), and Vcan (H) as compared to non-treated normoxic controls (^ p < 0.05 n = 5). Under OGD conditions, OL expression of Mt3 (D), Tspan2 (E) and Stmn2 (F) were significantly reduced in non-treated cells compared to both normoxic groups (# p < 0.05, n = 5).
HUCB Cells Reduce Infarct Volume
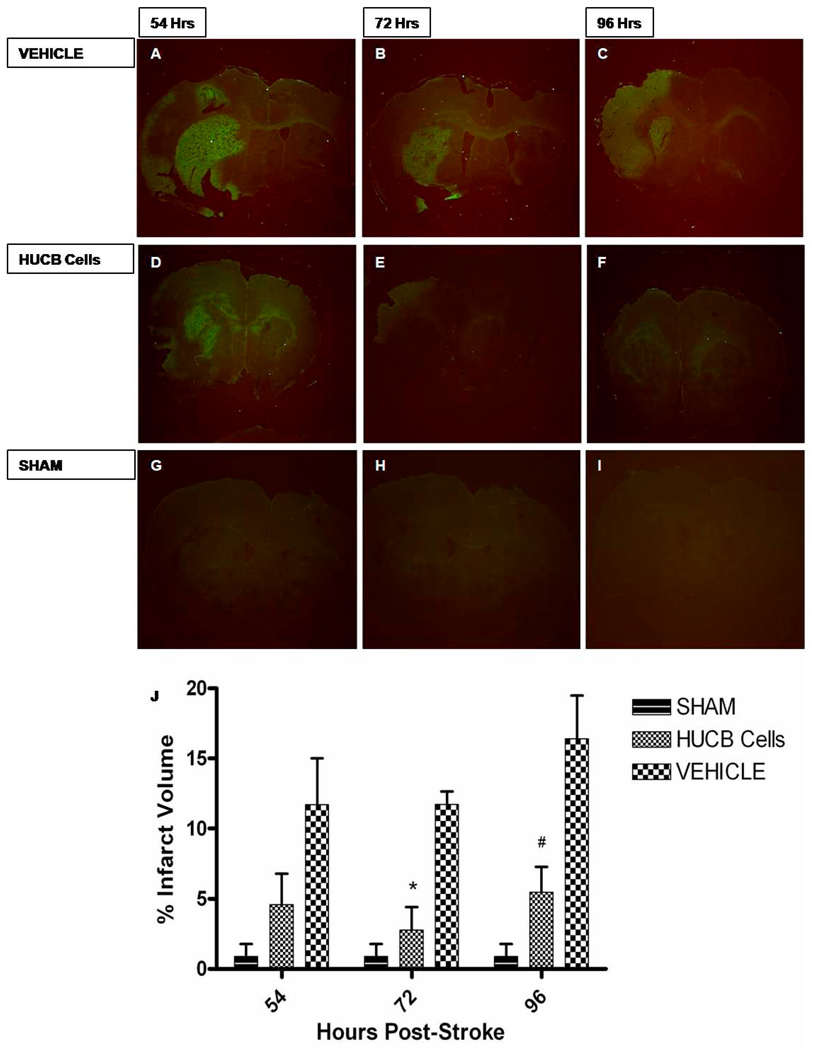
Systemic administration of HUCB cells 48hrs post-stroke significantly reduced infarct volume. The fluorochrome Fluoro-Jade was used to detect degenerating neurons in coronal brain section taken from rats subjected to MCAO and experimental groups that received HUCB cell treatment. HUCB cell treatment 48 hrs post-stroke significantly reduced infarct volume as compared to MCAO only groups at 72 and 96hrs post stroke (*p<0.05, #p<0.01 respectively (Fig.4). Sham operated groups were not significantly different from HUCB cell treated groups (p>0.05). Furthermore, brain tissues of HUCB cell treatment groups remained intact whereas tissue sections of MCAO only groups were fragile with signs of degradation.
Fig 4. HUCB cells reduce infarct volume.
HUCB cells provide neuroprotection when given systemically 48hrs post-stroke. Photomicrographs depict Fluoro-Jade staining of coronal rat brain sections at time points 54, 72 and 96 hrs post-MCAO. Infarct volume remained constant in MCAO only groups at 54 hrs (A), 72 hrs (B), and 96 hrs (C) post MCAO. Whereas HUCB cell administration reduced infarct volume at 72 hrs (E) and 96 hrs (F) post-stroke (* p < 0.05, # p < 0.01, respectively n = 4) while not significantly different from sham operated animals (G–I) (p > 0.05) at respective time points. Bar graph (G) shows the percent volume quantification of the ipsilateral (stroked) hemisphere compared to the contralateral (non-stroked) hemisphere for each group.
HUCB Cells Protect OLs In Vivo
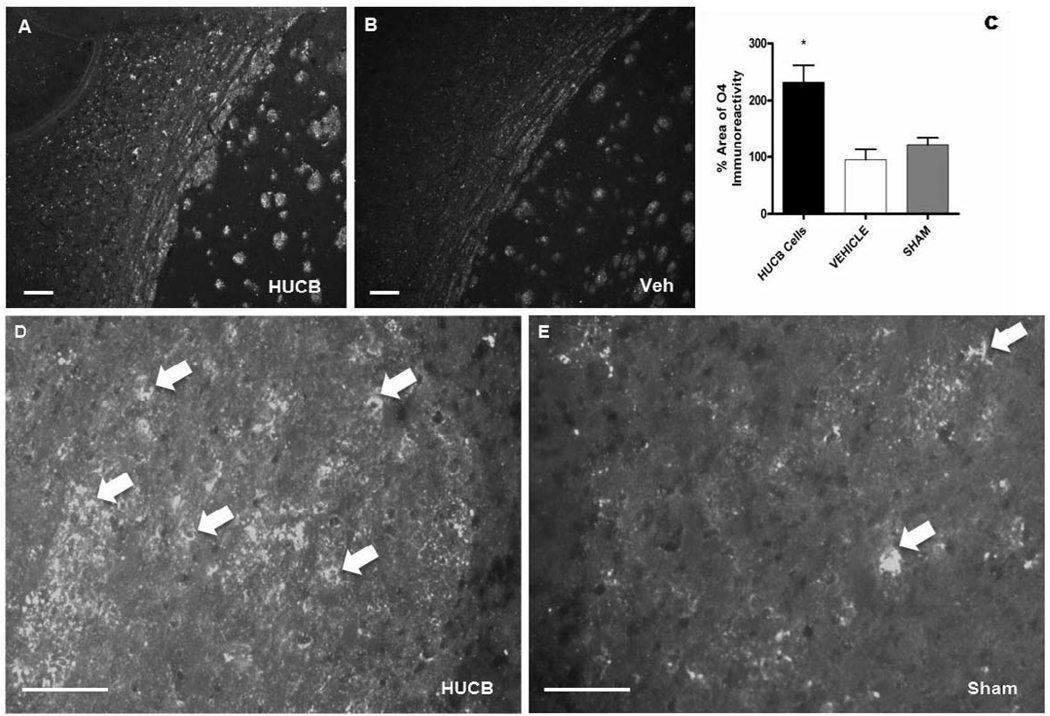
HUCB cells were administered 48 hrs post-stroke and sections were probed with anti-O4, a highly specific marker of OL cell bodies and processes (Schachner et al., 1981; Sommer and Schachner, 1982), to determine whether this therapy provided oligoprotection (Fig. 5). O4 immunoreactivity was ubiquitous throughout the ipsilateral external capsule in sections from animals treated with HUCB cells (Fig. 5A) and localized to cell bodies throughout the region (Fig. 5D). Sections from vehicle-treated and sham-operated rats also showed O4 immunoreactive cells, though they were sparsely distributed when compared to the ipsilateral hemisphere of HUCB cell treated rats (Fig. 5B,E). Quantification of the percent area occupied by O4 immunoreactivity (Fig. 5C) showed that O4 was significantly increased in the ipsilateral hemisphere of animals that received HUCB cells relative to vehicle-treated and sham-operated controls (p<0.01).
Fig 5. HUCB cells rescue OLs of the external capsule following ischemic insult.
O4 immunoreactivity was abundant throughout the ipsilateral external capsule of animals treated with HUCB cells 48 hrs post-MCAO (A, D). Vehicle (B) and sham-operated (E) controls also expressed O4, though immunoreactivity was sparsely distributed and less prominent compared to HUCB cell-treated animals. Quantification showed that HUCB cell treatment significantly increased O4 immunoreactivity relative to both vehicle-treated and sham-operated controls (* p < 0.01, n = 3). Scales bar = 50 µm. Arrows points to O4 positive staining.
HUCB Cells Induce Protein Expression
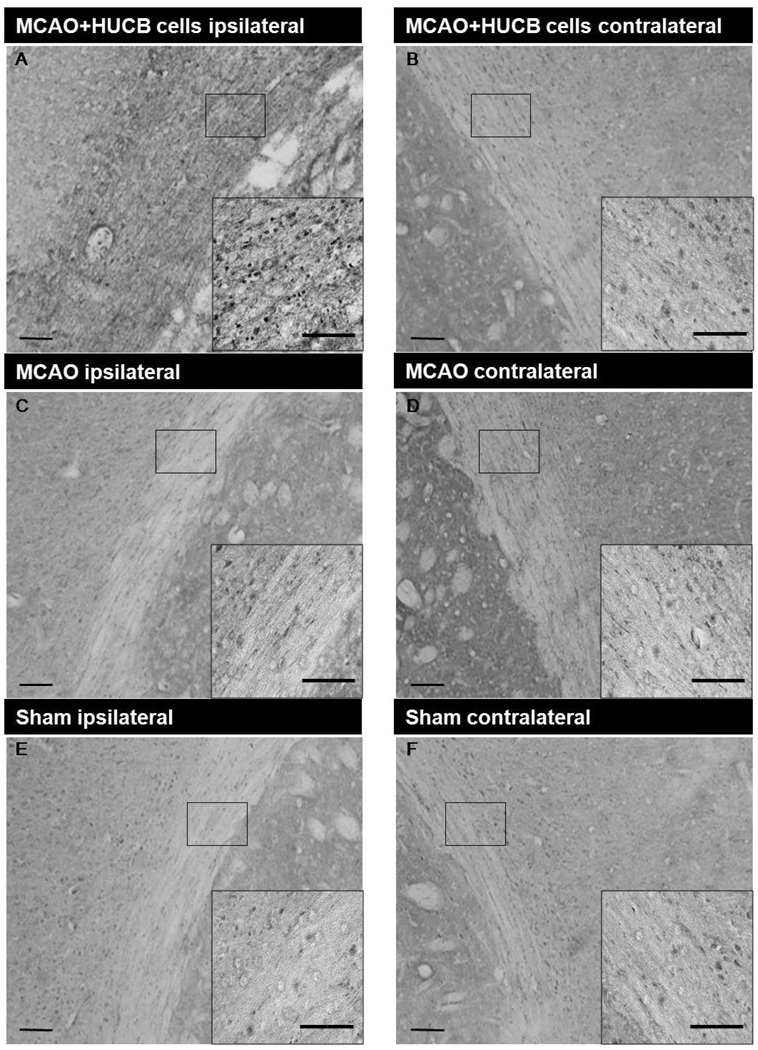
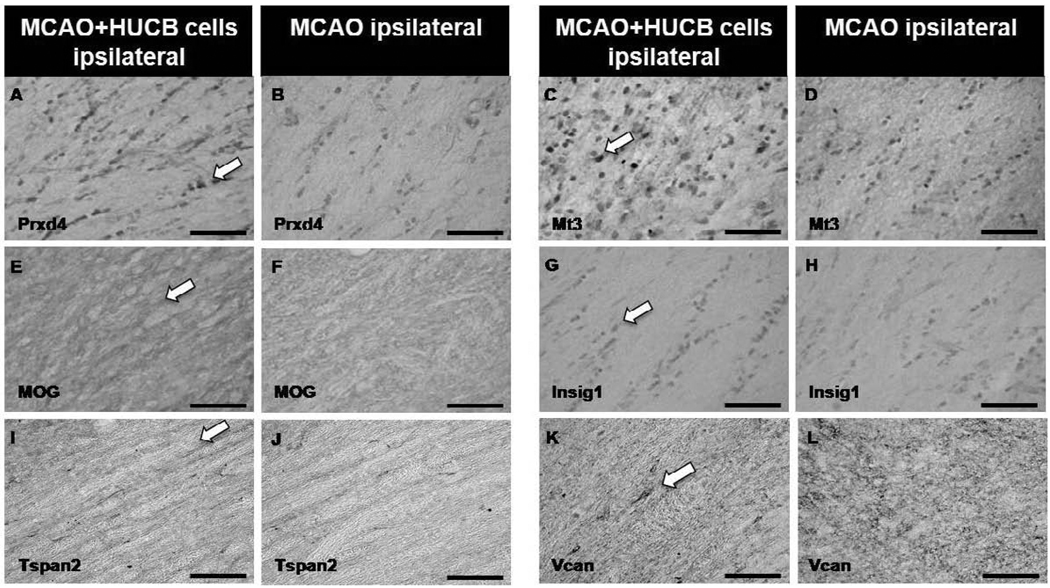
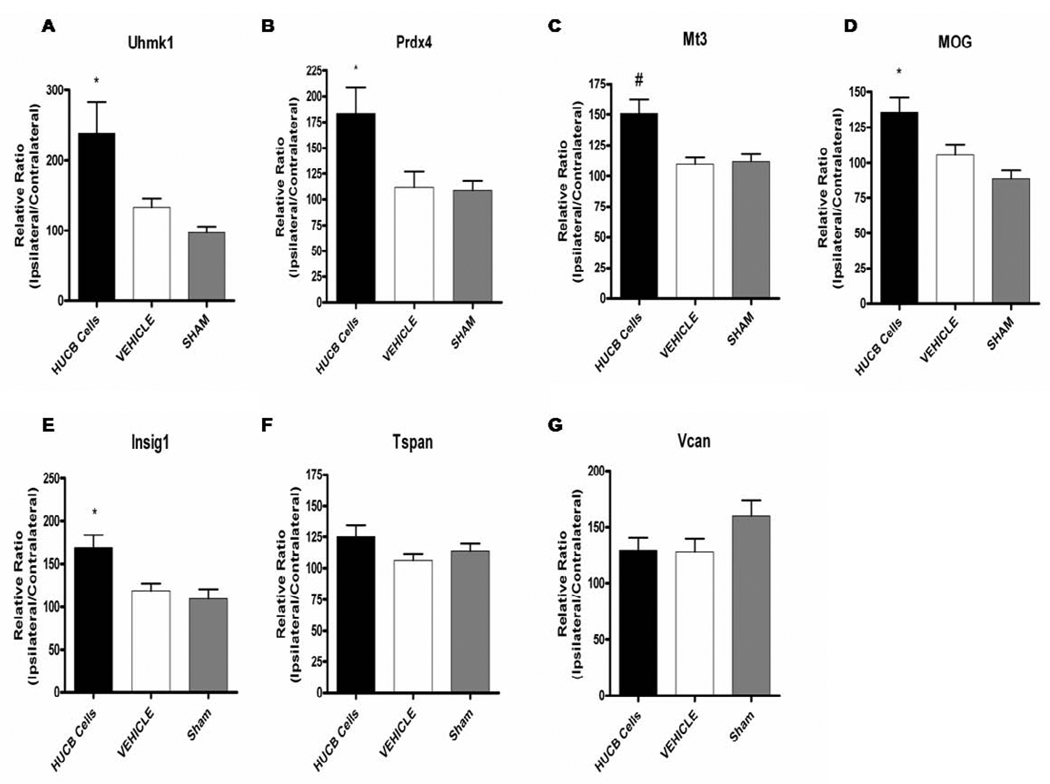
To expand on the microarray data from OL cultures, immunohistochemistry was performed to determine whether increased OL gene expression in vitro was consistent with increased gene product expression in vivo in the white matter rich region of the external capsule (Fig. 6 shows selected region). Experiments included sections from rats that were administered either vehicle or HUCB cells 48 hrs post-MCAO and rats that were subjected to sham-MCAO and received vehicle injections. Immunostaining was performed for the following proteins: Uhmk1 (Fig. 6), Prdx4, Mt3, MOG, Insig1, Tspan2, and Vcan (Fig. 7). In general, sham-operated controls (Fig. 6E,F) showed nearly identical staining patterns as vehicle-treated controls (Fig. 6C,D) with no apparent differences in the expression of any proteins examined. While MOG (Fig. 7E,F) and Vcan (Fig. 7K,L) immunoreactivity was present throughout the extracellular space, immunoreactivity for all other proteins was restricted to cell bodies. Quantification was performed by calculating the mean percent area for each treatment group (Fig. 8). The contralateral hemisphere was utilized as an internal control to adjust for ipsilateral brain swelling caused by edema. There was no significant difference in the expression of any proteins when comparing sham-operated and vehicle-treated controls. Uhmk1, Prdx4, Mt3, MOG and Insig1 were upregulated in rats treated with HUCB cells compared to sham-operated and vehicle-treated controls (*p < 0.05, #p< 0.01), while Tspan2 and Vcan expression were unchanged.
Fig 6. HUCB cells increase white matter Uhmk1 expression following ischemic insult.
HUCB cell treatment (A,B) 48 hrs post-MCAO significantly increased Uhmk1 expression in the ipsilateral hemisphere of the external capsule compared to vehicle (C,D) and sham-operated (E, F) controls (* p < 0.05, n = 3). Low magnification scale bars = 100 µm; high magnification inset scale bars = 20 µm.
Fig 7. HUCB cells alter white matter protein expression following ischemic insult.
Photomicrographs show increased expression of Prdx4 (A), Mt3 (C), MOG (E) and Insig1 (G) in the ipsilateral hemisphere of animals treated with HUCB cells 48 hrs post-MCAO compared to vehicle-treated controls (B,D,F,H, respectively). No differences were observed in the expression of Tspan (I,J) or Vcan (K,L) in response to HUCB cell treatment. Scale bars = 50 µm. Arrows points to positive staining.
Fig 8. Immunohistochemical quantification of white matter protein expression.
HUCB cell treatment 48 hrs post-MCAO resulted in increased expression of Uhmk1 (A), Prdx4 (B), Mt3 (C), MOG (D), and Insig1 (E) in the ipsilateral external capsule compared to vehicle-treated and sham-operated controls (*p < 0.05, #p < 0.01 n = 3). No significant differences were detected for Tspan2 (F) or Vcan (G).
Protein Expression and Localization
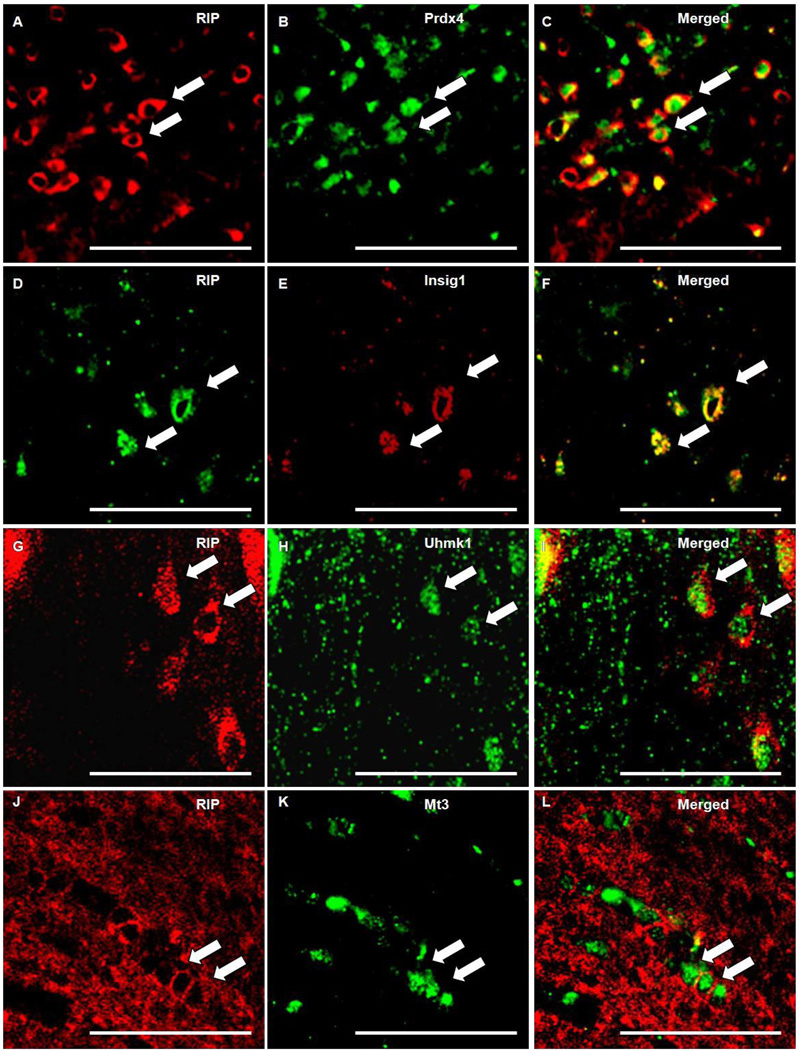
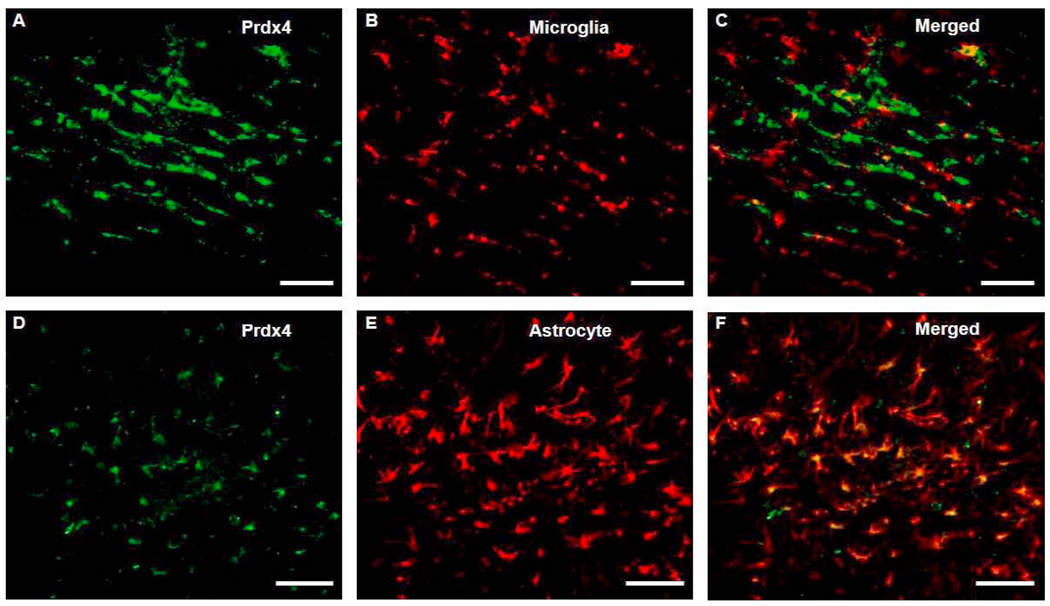
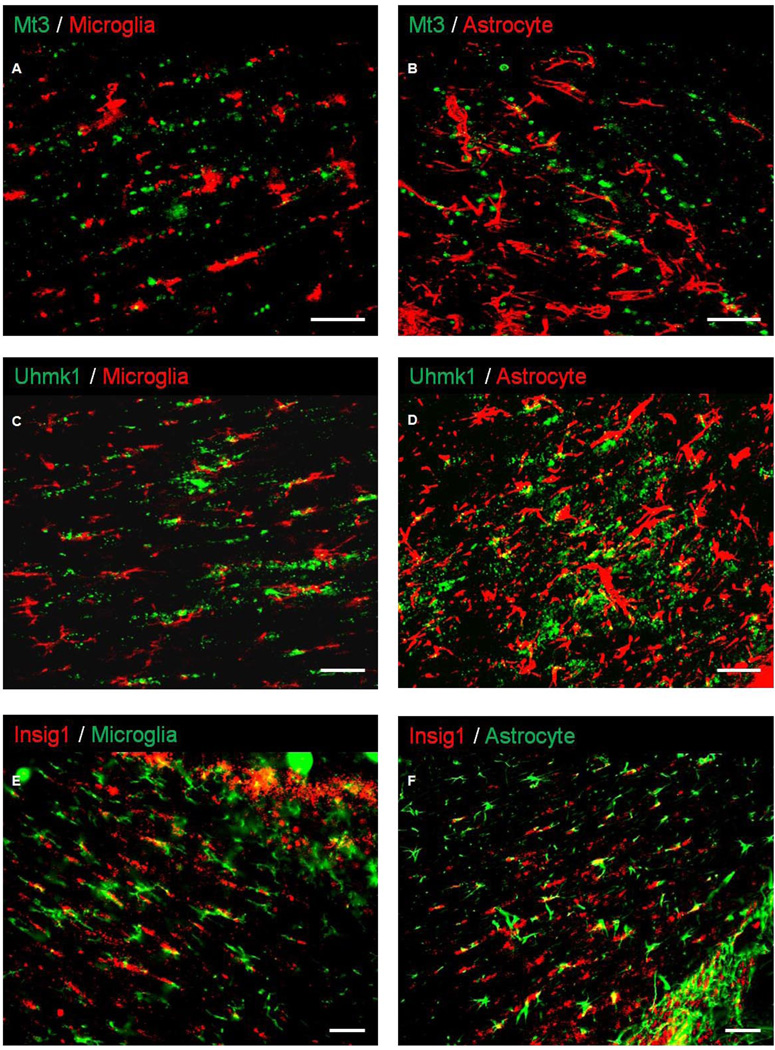
Double-label immunofluorescent staining was performed on sections from animals subjected to MCAO to characterize the cellular expression profile of the identified proteins. RIP, CD11b and GFAP were used for labeling of OL, microglia and astrocytes, respectively, in conjunction with antibodies raised against Prdx4, Mt3, Uhmk1, and Insig1. RIP colocalized with Prdx4, Mt3, Insig1, and Uhmk1. RIP staining was localized in OL membranes as does Insig1, whereas, Prdx4 Mt3, and Uhmk1 labeled cytoplasmically (Fig 9). Although Prdx4 did not colocalize with CD11b (Fig. 10A–C), Prdx4-positive cell bodies colocalized with GFAP-positive cells that exhibited the classic hypertrophic, stellate morphology indicative of reactive astrocytes (Fig. 10D–F). Neither CD11b nor GFAP colocalized with Mt3, Uhmk1 or Insig1 (Fig. 11).
Fig 9. Prdx4, Uhmk1, Insig1 and Mt3 colocalized with OL marker RIP.
Photomicrographs depicts immunoflourescent double-labeling of OL specific antibody RIP (A, D, G, J) and antibodies generated against Prdx4 (B), Mt3 (K), Insig1 (E), and Uhmk1 (H). RIP and Insig1 are colocalized (F) in OL membranes, whereas Prdx4 (C), Mt3 (L), and Uhmk1 (I) are cytoplasmically localized. Scale bars = 50 µm. Arrows points to positive staining.
Fig 10. Prdx4 is expressed in astrocytes but not microglia/macrophages following ischemic insult.
Double-label Immunohistochemistry for Prdx4 (A) and CD11b (B) shows that Prdx4 is not expressed in CD11b-positive microglia/macrophages (C) contained within the ipsilateral external capsule. Prdx4 (E) and GFAP (D) colocalization shows astrocytic expression of Prdx4 (F) within the white matter following ischemic insult. Scale bars = 100 µm.
Fig 11. Mt3, Uhmk, and Insig1 are not expressed in microglia/macrophages or astrocytes following ischemic insult.
Immunofluorescent double-labeling shows that while expression is evident in the ipsilateral external capsule following MCAO, Mt3, Uhmk1, and Insig1 did not colocalize with CD11b-positive microglia/macrophages (A, C, E) or GFAP-positive astrocytes (B, D, F). Scale bars = 50 µm.
Comparison of gene promoter
The promoter regions of genes upregulated in OLs co-cultured with HUCB cells during OGD were explored by Genomatix software. Common transcription factor binding sites were identified and included: EVI1, MZF1, GATA1, NK6.1, PAX6, Sox-5, and SRF (Table. 2). These results suggest that the genes identified by microarray are being transcriptionally elevated by similar signaling pathways activated by the soluble factors secreted from the HUCB cells.
Table 2. Common transcription factor binding sites present in the promoters of upregluated genes.
Table shows common transcription factor binding sites identified in the promoter regions of Prdx4, Mt3, Insig1, MOG, Uhmk1, Tspan2, Vcan and Stmn2. 8/8 denotes transcription factor binding sites present in all 8 genes, whereas 7/8 denotes transcription factor binding sites present in 7 of the 8 selected genes.
| Transcription Factor 8/8 | Transcription Factor 7/8 |
|---|---|
|
|
3. Discussion
The present study employed both in vitro and in vivo approaches to test the efficacy of HUCB cells in reducing OL cell death and white matter injury, respectively. LDH levels in media from OL cultures co-incubated with HUCB cells during OGD were reduced relative to OL-only cultures. As previously reported by Newcomb et al 2006. and Vendrame et al 2004,. here we report that HUCB cell treatment 48 hrs post-stroke reduced infarct volume. Separate experiments showed that O4 immunoreactivity increased in the ipsilateral external capsule of rats treated with HUCB cells 48 hrs after MCAO. Upregulation of this OL marker was consistent with the previous report by Hall et al 2009. showing that HUCB cell treatment increased MBP immunoreactivity. Thus, HUCB cells not only protect OLs from OGD-induced injury in vitro, but also upregulate the expression of white matter-associated proteins after ischemia in vivo.
Based upon these data, further experiments were conducted to identify the mechanisms by which HUBC cells confer protection. Gene expression analysis of OL cultures subjected to OGD and treated with HUCB cells revealed increased mRNA content of Uhmk1, MOG, Insig1, Mt3, Tspan2, Prdx4, Stmn2, and Vcan. Additionally, the levels of Mt3, Prdx4, MOG, Insig1 and Uhmk1 gene products were elevated in the ipsilateral external capsule of animals administered HUCB cells 48 hrs after MCAO. Previous reports have demonstrated expression of these proteins in OLs (Jin et al., 2005; Kursula, 2008; Miyazaki et al., 2002; Sim et al., 2008). Here, double-label immunohistochemistry showed that the OL specific antibody RIP colocalizes with Prdx4, Mt3, Insig1 and Uhmk1 whereas only Prdx4 colocalized with astrocytes, while none of the proteins colocalized with microglia/macrophages. Both the increased gene expression in culture and the lack of colocalization with other glial cell types in vivo demonstrates that HUCB cells injected into MCAO rats caused OLs seated within the cerebral white matter to upregulate these proteins.
To our knowledge, this is the first study linking upregulated expression of genes and gene products with the protective effects of HUCB cell therapy within the context of OL susceptibility and white matter injury resulting from ischemia. HUCB cell-induced upregulations in Prdx4 and Mt3 observed here are consistent with the notion that HUCB cells provide protection to white matter by inducing OLs to express proteins that combat oxidative damage. Oxidative stress is a major cause of OL cell death resulting from OGD (Dewar et al., 2003). The Prdx family of anti-oxidants exerts protective effects through peroxidase activity, detoxifying a range of free radical-forming organic hydroperoxides (Hofmann et al., 2002). In particular, Prdx4 regulates the thromboxane A2 receptor, a receptor which is upregulated by oxidative stress and contribute to oxidative injury upon activation (Valentin et al., 2004). Previous work showed that thromboxane A2 expression was inhibited during oxidative stress by Prdx4 over-expression (Giguere et al., 2007). In addition, the Prdx family has also been shown to undergo structural changes to engage in chaperone activity in response to excessive oxidation (Jang et al., 2004). This chaperone activity may be a necessary function in the recovery of oxidatively damaged cells by preventing free radical-induced aggregation of cytosolic proteins (Jang et al., 2004; Kang et al., 2005).
Similarly, the antioxidant Mt3 exerts its effects through metal detoxification and free radical scavenging activity (Hozumi et al., 1998; Hwang et al., 2008; Uchida et al., 2002). These mechanisms are of particular relevance to the present study since iron is not only a critical co-factor in myelin production, but is also highly reactive and can contribute to free radical formation and lipid peroxidation (Braughler et al., 1986; Connor and Menzies, 1996). Additionally, OLs possess low concentrations of the antioxidant glutathione, and oxidative stress leads to increased iron-mediated production of ROS (Juurlink, 1997; Juurlink et al., 1998). Thus, the protective effects of HUCB cells likely result, at least in part, from the secretion of a factor or factors that ultimately increase the expression of Mt3.
HUCB cell therapy has previously been shown to target the Akt signaling pathway, as Akt inhibition diminishes the protective effects of HUCB cells (Dasari et al., 2008). Importantly, growth factors such as VEGF and interleukins such as IL-6, which are secreted by HUCB cells, have also been shown to activate Akt, leading to cell migration, angiogenesis, and cell survival (Morales-Ruiz et al., 2000; Neuhoff et al., 2007; Six et al., 2002; Wegiel et al., 2008). The present study identified several common transcription factor binding sites within the promoter regions of the genes identified by microarray. In particular, EVI1, MZF1, and GATA1 transcription occur downstream of PI3k/Akt activation (Liu et al., 2006; Moeenrezakhanlou et al., 2008; Yu et al., 2005), providing additional evidence that Akt is an important upstream activator responsible for the oligoprotective, anti-oxidant effects of HUCB cells. Taken together, these data show that HUCB cells release factors that transduce signaling converging on Akt, thereby increasing the transcription of oligoprotective genes.
In addition to combating oxidative stress, data here show that HUCB cell treatment alters the expression of proteins involved in microtubule regulation. The concerted actions of MOG and Stmn2 inhibit microtubule polymerization, and Stmn2 was previously found to increase neurite outgrowth via this mechanism (Chiellini et al., 2008; Johns and Bernard, 1999; Riederer et al., 1997). Thus, these data provide evidence that upregulated expression of MOG and/or Stmn2 acts to inhibit microtubule polymerization in OLs, thereby increasing proliferation and/or migration and enhancing white matter repair.
Indeed, previous findings showed that mature OLs retain the ability to proliferate following injury (Wood and Bunge, 1991). In addition to regulating microtubule dynamics through the phosphorylation of Stmn2 (Belmont and Mitchison, 1996), Uhmk1 induces proliferation and cell cycle progression through the phosphorylation of p27kip1(Nakamura et al., 2008). Interestingly, Uhmk1 was also upregulated after MCAO in HUCB cell-treated rats. Here, the observed elevations in both Uhmk1 and O4 expression support the notion that HUCB cell therapy protects white matter injury by inducing OL proliferation via this pathway.
HUCB cell therapy may also alleviate white matter injury through replacement of important somatic and/or axonal membrane lipids that are degraded in response to H–I injury. The OL axon sheath is rich in glycosphingolipids and cholesterol (Simons and Trajkovic, 2006). Insig1 is degraded when cholesterol is depleted within a cell (Gong et al., 2006), and hypoxia increases Insig1 expression through a mechanism mediated by hypoxia inducible factor 1α (Nguyen et al., 2007). Thus, the elevations in Insig1 likely reflect HUCB cell induction of cholesterol biosynthesis aimed at remyelination or restoration of the cell membrane.
Although a role for HUCB cells in remyelination is also supported here by increased O4 expression, future experiments are necessary to determine precisely which proteins are associated with restoration of the myelin sheath or cell membrane viability in general. For example, Tspan2 is integrated into the myelin sheath membrane following active myelination, while Vcan is involved in OL migration, proliferation, and structural integrity (Birling et al., 1999; Sheng et al., 2005). Tspan2 and Vcan mRNAs were upregulated in OL cultures subjected to OGD and treated with HUCB cells, yet there was no significant difference in protein expression in vivo after MCAO. These data suggest that although Vcan and Tspan may be capable of enhancing axonal and/or plasma membrane viability in culture, the complex microenvironment present in the stroked brain determines which genes are translated and trafficked accordingly. Likewise, these differences in in vitro transcription and in vivo translation highlight the importance of combining multiple approaches to elucidate the protective pathways elicited by HUCB cells. Future studies investigating these pathways will provide insight into the precise factors secreted by HUCB cells that protect OLs and cerebral white matter following ischemia.
4. Experimental Procedure
Animal Care
All animal procedures were conducted in accordance with the NIH Guide for the Care and Use of Laboratory Animals with a protocol approved by the Institutional Animal Care and Use Committee at the University of South Florida. Experiments were designed to minimize the number of animals required. Sprague-Dawley rats were purchased from Harlan Labs (Indianapolis, IN), maintained on a 12 hr light/dark cycle (7 am – 7 pm) in a climate-controlled room, and allowed access to food and water ad libitum. Neonatal rats birthed from untimed-pregnant dams were used for in vitro experiments and 300–350 g male rats were used for in vivo experiments. Measures taken to minimize pain and discomfort are described in the subsequent methodology.
Mixed Glial Culture Preparation
Postnatal day 3 rat pups were decapitated, brains removed, and meninges dissected away. Rat cortices were dissociated in a solution of 0.25% trypsin/2.21 mM EDTA, triturated, and pelleted. The pellet was re-suspended in DMEM (Mediatech, Manassas, VA) supplemented with 2.5% fetal bovine serum, 10% horse serum, and 1% antibiotic/antimycotic (DMEM+). Trypan Blue exclusion was used to assess cell viability. Cells were seeded (1.5 × 10⁷) into poly-L-lysine-treated 75 cm2 tissue culture flasks. Media was changed with fresh DMEM+ the following day and cultures were incubated for 8 days at 37°C (Gottschall et al., 1995).
OL Culture Purification
Mixed glial cultures were mechanically shaken for 1 hr to separate microglial cells from the OL/astrocyte monolayer and media was discarded. Fresh DMEM+ was added and the flask was returned to the incubator for an additional 2 days at 37°C. OLs were purified from mixed glial preparations by shaking the preparations for 18 hrs to separate OLs and microglia from the astrocyte monolayer. The media was removed, the cells were pelleted and re-suspended in DMEM+. Viable cells were then counted using Trypan Blue exclusion. Microglia- and OL-containing media was added to 10 cm plastic tissue culture dishes at a density of 107 cells/dish and incubated for 15 min at 37°C (procedure repeated 3 times for microglial adherence to the plastic). After incubation, the dishes were gently swirled and media collected. The remaining suspension was pelleted, re-suspended in DMEM+, and plated on glass poly-L-lysine-treated coverslips at 3 × 10⁵ cells/coverslip (McCarthy and de Vellis, 1980). The following day, media was changed to Neurobasal complete (Neurobasal supplemented with B-27, L-glutamine 0.5mM, and 10ng/ml PDGF AA) (Barres et al., 1993; Yang et al., 2005). OLs remained in Neurobasal complete and PDGF-AA for 7 days to encourage proliferation. After the proliferation period, PDGF-AA was withdrawn for 5 days to induce OL differentiation into the mature phenotype (Yang et al., 2005). Experiments were conducted immediately following the 5 day PDGF-AA withdrawal. All in vitro experiments were conducted using > 95% pure OL cultures, as previously described in (Hall et al., 2009).
Oxygen Glucose Deprivation
OLs were seeded onto glass coverslips and randomly assigned to one of two conditions: OGD (DMEM without glucose) or normoxia (DMEM with glucose). Transwell inserts (0.2 µm: Nalge Nunc International, Rochester, NY) were added to 6-well plates containing coverslips. The inserts provided a barrier that prevented OL-HUCB cell contact but was permeable to media and soluble factors. Cryopreserved HUCB cells (ALLCELLS, Emeryville, CA) were rapidly thawed, washed, pelleted to remove the cryopreservatives and re-suspended in 10 ml DMEM with glucose and DNase (Sigma-Aldrich, St. Louis, MO; 50 kunitz units/ml). HUCB cells were seeded onto tissue culture inserts (1×10⁵ cells/insert) and placed into the wells containing OL coverslips immediately prior to OGD exposure. Experimental groups not subjected to HUCB cell treatment received inserts containing an equal volume of DNase-supplemented DMEM with glucose. A negative control of media alone and wells containing 1×10⁵ HUCB cells with DNase were included as controls to quantify HUCB cell contribution to the LDH assay for each experimental condition.
Cells undergoing OGD were placed in an air-tight hypoxica chamber. The chamber was then flushed with hypoxic gas (95% N2, 4% CO2, 1% O2; Airgas, Tampa, FL) for 15 min and sealed for the duration of exposure. Normoxic cells were maintained in a standard tissue culture incubator. Cultures were subjected to OGD or normoxia for 24 hrs at 37°C. The media from each well was collected, clarified by centrifugation, and LDH analysis was performed immediately.
LDH Assay
OL cell death in culture was determined using the LDH assay (Takara Bio, Inc., Madison, WI). Briefly, 100 µl of tissue culture media from each experimental group was added to a 96-well plate and 100µl of LDH reagent was added to each well. Plates were incubated for 30 min at 25°C and absorbances were read on a microplate reader at a 548 nm wavelength. The media from HUCB cell only cultures served as a control for HUCB cell death. The absorbance of HUCB cell only media, as well as the absorbance of media only, was subtracted from the total absorbance of the OL wells to eliminate background LDH activity.
RNA Collection and Purification
All collection and purification steps were performed under nuclease-free conditions using DNAse/RNAse-free materials. For RNA lysate collection, 10 µl of β-Mercaptoethanol (Pharmacia Biotech, Uppsala, Sweden) was added to 1 ml RTL buffer (Qiagen Inc., Valencia, CA) and 350µl of the resulting mixture was added to each OL-containing well to lyse the cells. Cell lysates were then collected and stored at −80°C prior to extracting the RNA. Qiagen’s RNeasy Mini Kit was used to extract total RNA from each cell lysate using the optional Qiagen RNase-Free DNase set for DNase digestion (Qiagen Inc). Following the extraction, 1 µl of each RNA sample was tested in an Agilent 2100 Bio-analyzer to determine the purity and quantity of RNA present. The remaining sample was stored at −80°C for subsequent use with gene array.
Gene Array
Gene array was performed by the H. Lee. Moffitt Cancer Center Microarray Core Facility utilizing a GeneChip 3000 Scanner, GCOS 1.4 with an Affymetrix MAS 5.0 algorithm to generate signal intensities, and GeneChip Rat Genome 230 2.0 Array (Affymetrix inc, Santa Clara, CA). Microarray data were normalized to RNA from cultures exposed to OGD. Only genes with ≥ 1.5 fold increase and a signal intensity of > 100 were selected for further investigation. For investigated treatment groups, samples were pooled (n=5) to obtain the necessary RNA quantity and quality to perform this procedure.
Quantitative Real Time Polymerase Chain Reaction
Primers were ordered for selected sequences in which expression of genes deemed vital to OL survival and proliferation were increased at least 1.5 fold after HUCB cell treatment. Uhmk1, Insig1, Mt3, Tspan2, Prdx4, Stmn2, and MOG were purchased from SABiosciences (Frederick, MD; sequences are proprietary). Vcan (Integrated DNA Technologies Coralville, IA) was examined using the following primers:
Reverse 5’ TTT TAG GCA TTG CCC ATC TC
Forward 5’ ATG ACG TCC CCT GCA ACT AC
Total RNA (10 ng/µl) from OL cultures were subjected to qRT-PCR. The RT reaction mixture consisted of 3µl Oligo (dT) Primers, 10 µl cDNA Synthesis Master Mix (2X), 1 µl of Affinity Script RT/RNase Block enzyme mixture, and RNase-free H2O to a total volume of 20 µl (Stratagene, La Jolla, CA). The reaction was incubated at 25°C for 5 min to allow primer annealing, then incubated at 42°C for 45 min to allow cDNA synthesis followed by 5 min incubation at 95°C to terminate the cDNA synthesis reaction.
Complementary DNA from the RT reaction was added to a PCR reaction mix consisting of 1 µl cDNA, 12.5 µl 2X Brilliant 490 SYBR Green QPCR Master Mix (Stratagene), 2 µl primer, and nuclease-free PCR grade H2O to a total volume of 25 µl. The samples were amplified using a BioRad ICycler (Bio-Rad Laboratories, Hercules, CA) with the following protocol: heating to 95°C for 15 min followed by 40 cycles of 30 sec denaturation at 95°C, 30 sec annealing at 55 °C, and 30 sec of elongation at 72°C. GADPH was selected as a reference gene and was used to calculate the mean normalized expression.
Determination of Promoter Response Elements
Accession numbers of OL genes shown by microarray and confirmed by qRT- PCR to increase expression were entered into Genomatix software (ElDorado/Gene2Promoter v4.7.0;Genomatix Software Inc, Ann Arbor, MI). The promoter regions of selected genes were investigated for common transcription factor binding sites. Transcription factor families were determined and transcription factor binding sites conserved across the promoter regions of all selected genes were identified.
Laser Doppler Blood Flow Measurement
Prior to MCAO surgery, animals were anesthetized with 5% isofluorane/O2 in an induction chamber. Rats were treated prophylactically with Ketoprofen (10 mg/kg s.c.), atropine (0.25 mg/kg s.c.) and Baytril (20 mg/kg i.m.) in accordance with IACUC guidelines. Ketoprofen injections were continued 3 days post-MCAO to minimize pain and discomfort. A constant flow of anesthesia was supplied with an interfaced scavenging system (3–4% isofluorane, flow rate 1 L/min) throughout the procedure. For Doppler insertion, the head was shaved and an incision was made lateral to the midline of the dorsal plates of the skull. The skin was spread and tissue covering the skull bone was pushed aside with a cotton-tipped applicator. Using a micro-drill, a small hole was drilled into the skull at 1 mm posterior and 4 mm lateral to bregma. A hollow stainless steel guide screw was positioned into the hole and a fiber optic filament (500 µm) was inserted through the screw guide and secured with Vetbond (3M, St. Paul, MN). Blood perfusion in the brain was monitored using the Moor Instruments (Devon, England) Ltd laser Doppler with Moor LAB proprietary Windows-based software. When surgery was complete, the screw guide was removed, bone wax placed in the burr hole and the scalp incision was sutured. Rats that did not show ≥ 60% reduction in blood perfusion during MCAO were excluded from the study (Hall et al., 2009)
MCAO and HUCB Cell Treatment
MCAO surgeries were performed as previously described (Butler et al., 2002; Hall et al., 2009; Vendrame et al., 2004). Following implantation of the Doppler probe, the external carotid artery was exposed and isolated from the vagus nerve using blunt dissection. The artery was then ligated and transected near the bifurcation of the internal and external carotid arteries. The stump of the external carotid was then used as a guide to advance a monofilament through the internal carotid to the origin of the middle cerebral artery. The filament was then sutured secure and the incision closed. For sham surgeries, the Doppler probe was inserted and the external carotid exposed, but no filament inserted.
To determine whether HUCB cells were protective against stroke-induced injury, rats were injected (i.v, penile vein) with either HUCB cells (1×10⁶ HUCB cells in 500 PBS (pH 7.4 + DNase) or vehicle (500 µL PBS + DNase only) 48 hrs after MCAO surgery. Sham-operated animals also received vehicle. Animals were then sacrificed 54, 72 and 96 hrs post-stroke and transcardially perfused with 0.9% NaCl followed by 4% paraformaldehyde in PBS. The brains were removed and saturated with 4% paraformaldehyde in PB followed by increasing concentrations of sucrose in PBS (20%, 30%). Brains were then sectioned at 30 µm on a cryostat to include bregma 1.7mm through bregma −3.3, thaw mounted onto slides and stored at −20°C.
Fluoro-Jade Histochemistry
Brain sections were thawed, dried and rehydrated with 100% EtOH for 3 min, 70% EtOH for 1min, and 1min in ddH2O. Using a 0.06% KMnO4 solution, sections were oxidized for 15 min. After 3×1 min washes in ddh2O, brain sections were placed in a 0.001% solution of Fluoro-Jade (Histochem, Jefferson, AR) in 0.1% acetic acid for 30 min. Following incubation, sections were washed 4×3min in ddH2O, dried, cleared in xylene, and cover-slipped with DPX mounting medium (VWR International Ltd, Poole, England).
Immunohistochemistry
For peroxidase detection, brain tissue sections were washed with PBS for 5 min and incubated in 3% hydrogen peroxide for 20 min. Sections were then washed 3 times in PBS, incubated for 1 hr in permeabilization buffer (2% serum, 0.3% Triton X-100 and 0.3% 1M lysine in PBS) and incubated overnight at 4°C with primary antibody in antibody solution (2% goat serum, 0.3% Triton X-100 in PBS). The following day, sections were washed with PBS and incubated 1 hr at room temperature with secondary antibody in antibody solution (2% serum, 0.3% Triton X-100 in PBS). Sections were then washed in PBS, incubated in Avidin-Biotin Complex (ABC; Vector Laboratories Inc, Burlingame, Ca) mixture for 1hr, washed again and visualized using a DAB/peroxide solution (Vector Laboratories Inc). After 3 final washes, sections were dried, dehydrated with increasing concentrations of EtOH (70%, 95%, 100%), cleared with xylene and cover-slipped with DPX. Antibodies consisted of the following: mouse anti-MOG (Abcam, Cambridge, MA; 1:250), rabbit anti-Uhmk1 (Protein tech group, Chicago IL; 1:50), rabbit anti-Prdx4 (Abcam; 1:250), goat anti-Vcan (Santa Cruz Biotechnology Inc, Santa Cruz, CA; 1:50), rabbit anti-Tspn2 (Sigma-Aldrich), goat anti-Insig1 (Santa Cruz Biotechnology Inc; 1:50), and rabbit anti-Mt3 (Sigma-Aldrich; 1:50). Secondary detection was achieved using biotinylated secondary antibodies (Vector Laboratories; 1:300) corresponding to the respective species of primary antibodies.
For fluorescent labeling, tissue sections and cultured OLs were subjected to the same method used for peroxidase detection, prior to the secondary antibody incubation, except that fluorescence samples were not incubated in hydrogen peroxide. Double-label immunohistochemistry was achieved by co-incubating the tissues or cells with primary antibodies raised in two distinct species, followed by co-incubation with secondary antibodies conjugated to distinct fluorophores. Following secondary antibody incubation, sections were washed and cover-slipped using VectaShield Hard Set with DAPI (Vector Laboratories). Antibodies used for fluorescent detection consisted of the following: mouse anti-RIP (Millipore, Temecula, CA; 1–5000), rabbit anti-Prdx4 (Abcam; 1:500), mouse anti-O4 (Chemicon, Temecula, CA; 1:1000), mouse anti-OX-42 (AbD Serotec, Kidlington, Oxford, UK; 1:1000), rat anti-MBP (Abcam; 1:1000), rabbit anti-NG2 (Chemicon; 1:500), rabbit anti-Uhmk1 (Protein tech group; 1:50), goat anti-Insig1 (Santa Cruz Biotechnology Inc; 1:50), rabbit anti-Mt3 (Sigma-Aldrich; 1:50), and mouse anti-GFAP (Chemicon; 1:1000). Secondary antibodies used were Alexa Fluor 488 and 594 (Molecular Probes, Eugene, OR; 1:1000). Negative controls were labeled in the absence of primary antibody corresponding with respective secondary, as discussed previously.
Image Analyses
For in vivo image analyses, brain sections from ≥ 3 animals per group were used. Coronal brain sections encompassing the striatum (Bregma coordinates +1.7 through −0.3) were taken from each animal. Images were generated using a Zeiss Axioskop2 microscope controlled by Openlab (Improvision Ltd, Lexington, MA) software. Images were captured with a Zeiss Axiocam Color camera. The ImageJ 1.410 program (National Institutes of Health, USA) was used to measure relative total intensity ratios of ipsilateral vs. contralateral hemispheres. Ratios were calculated for each animal due to ipsilateral brain swelling caused by edema. The group mean total intensity ratio for each experimental treatment group was used for comparisons across treatments. Total intensity analysis was conducted where treatment groups were blinded.
Statistical Analyses
Data from all experiments were quantified and analyzed using GraphPad Prism 4.0 (GraphPad Software, La Jola, CA) software. Main effects were determined using one-way ANOVAs, followed by Dunnett’s post hoc tests to detect significant differences across treatment groups. When two variables were present, two-way ANOVAs were used followed by Bonferroni post hoc tests. A “p” value < 0.05 was used as the threshold for significant differences.
Acknowledgements
This work was supported in part by the National Institutes of Health (R01 NS052839), the American Heart Association (0715096B to A.A.H.), and the University of South Florida Department of Molecular Pharmacology and Physiology. The authors also thank Dr. Javier Cuevas and the H. Lee. Moffitt cancer center Microarray core for their contributions.
Abbreviations
- OL
oligodendrocyte
- HUCB
human umbilical cord blood
- OGD
oxygen glucose deprivation
- Uhmk1
U2AF homology motif kinase 1
- Insig1
insulin induced gene 1
- Mt3
metallothionein 2
- Tspan2
tetraspanin 2
- Prdx4
peroxiredoxin 4
- Stmn2
stathmin-like 2
- MOG
myelin oligodendrocyte glycoprotein
- Vcan
versican
- MCAO
middle cerebral artery occlusion
- BDNF
brain derived neurotrophic factor
- NGF
nerve growth factor
- GDNF
glial cell derived neurotrophic factor
- IGF-1
insulin like growth factor 1
- DMEM
Dulbecco modified eagle medium
- PDGF-AA
platelet derived growth factor-AA
- LDH
lactate dehydrogenase
- GADPH
glyceraldehyde-3-phosphate dehydrogenase
- NG2
chondroitin sulfate proteoglycan
- O4
Oligodendrocyte marker O4
- MBP
myelin basic protein
- GFAP
glial fibrillary acidic protein
- RIP
Receptor interacting protein
- EVI1
ecotropic viral integration site 1
- MZF1
myeloid zinc finger protein
- GATA1
GATA-binding factor 1
- NK6.1
NK6 homeobox 1
- PAX6
pax-6 paired domain binding site
- Sox-5
SRY (sex determining region Y)-box 5
- SRF
serum response factor
- ROS
reactive oxygen species
- VEGF
vascular endothelial growth factor
- IL-6
interleukin 6
- H-I
hypoxic ischemia
- AU
absorbance units
Footnotes
Publisher's Disclaimer: This is a PDF file of an unedited manuscript that has been accepted for publication. As a service to our customers we are providing this early version of the manuscript. The manuscript will undergo copyediting, typesetting, and review of the resulting proof before it is published in its final citable form. Please note that during the production process errors may be discovered which could affect the content, and all legal disclaimers that apply to the journal pertain.
Disclosure: A.E. Willing is a consultant to Saneron CCEL Therapeutics, Inc. and is an inventor on cord blood related patents.
Contributor Information
D.D. Rowe, Email: drowe@health.usf.edu.
C.C. Leonardo, Email: cleonard@health.usf.edu.
A.A. Hall, Email: ahall@health.usf.edu.
M.D. Shahaduzzaman, Email: mshahad@health.usf.edu.
L.A. Collier, Email: lcollier@health.usf.edu.
K.R. Pennypacker, Email: kpennypa@health.usf.edu.
References
- Arai K, Lo EH. Experimental models for analysis of oligodendrocyte pathophysiology in stroke. Exp Transl Stroke Med. 2009;1:6. doi: 10.1186/2040-7378-1-6. [DOI] [PMC free article] [PubMed] [Google Scholar]
- Baron-Van Evercooren A, Olichon-Berthe C, Kowalski A, Visciano G, Van Obberghen E. Expression of IGF-I and insulin receptor genes in the rat central nervous system: a developmental, regional, and cellular analysis. J Neurosci Res. 1991;28:244–253. doi: 10.1002/jnr.490280212. [DOI] [PubMed] [Google Scholar]
- Barres BA, Schmid R, Sendnter M, Raff MC. Multiple extracellular signals are required for long-term oligodendrocyte survival. Development. 1993;118:283–295. doi: 10.1242/dev.118.1.283. [DOI] [PubMed] [Google Scholar]
- Baumann N, Pham-Dinh D. Biology of oligodendrocyte and myelin in the mammalian central nervous system. Physiol Rev. 2001;81:871–927. doi: 10.1152/physrev.2001.81.2.871. [DOI] [PubMed] [Google Scholar]
- Belmont LD, Mitchison TJ. Identification of a protein that interacts with tubulin dimers and increases the catastrophe rate of microtubules. Cell. 1996;84:623–631. doi: 10.1016/s0092-8674(00)81037-5. [DOI] [PubMed] [Google Scholar]
- Birling MC, Tait S, Hardy RJ, Brophy PJ. A novel rat tetraspan protein in cells of the oligodendrocyte lineage. J Neurochem. 1999;73:2600–2608. doi: 10.1046/j.1471-4159.1999.0732600.x. [DOI] [PubMed] [Google Scholar]
- Braughler JM, Duncan LA, Chase RL. The involvement of iron in lipid peroxidation. Importance of ferric to ferrous ratios in initiation. J Biol Chem. 1986;261:10282–10289. [PubMed] [Google Scholar]
- Butler TL, Kassed CA, Sanberg PR, Willing AE, Pennypacker KR. Neurodegeneration in the rat hippocampus and striatum after middle cerebral artery occlusion. Brain Res. 2002;929:252–260. doi: 10.1016/s0006-8993(01)03371-6. [DOI] [PubMed] [Google Scholar]
- Chiellini C, Grenningloh G, Cochet O, Scheideler M, Trajanoski Z, Ailhaud G, Dani C, Amri EZ. Stathmin-like 2, a developmentally-associated neuronal marker, is expressed and modulated during osteogenesis of human mesenchymal stem cells. Biochem Biophys Res Commun. 2008;374:64–68. doi: 10.1016/j.bbrc.2008.06.121. [DOI] [PubMed] [Google Scholar]
- Chua SJ, Bielecki R, Yamanaka N, Fehlings MG, Rogers IM, Casper RF. The effect of umbilical cord blood cells on outcomes after experimental traumatic spinal cord injury. Spine (Phila Pa 1976) 2010;35:1520–1526. doi: 10.1097/BRS.0b013e3181c3e963. [DOI] [PubMed] [Google Scholar]
- Connor JR, Menzies SL. Relationship of iron to oligodendrocytes and myelination. Glia. 1996;17:83–93. doi: 10.1002/(SICI)1098-1136(199606)17:2<83::AID-GLIA1>3.0.CO;2-7. [DOI] [PubMed] [Google Scholar]
- Dasari VR, Veeravalli KK, Saving KL, Gujrati M, Fassett D, Klopfenstein JD, Dinh DH, Rao JS. Neuroprotection by cord blood stem cells against glutamate-induced apoptosis is mediated by Akt pathway. Neurobiol Dis. 2008;32:486–498. doi: 10.1016/j.nbd.2008.09.005. [DOI] [PubMed] [Google Scholar]
- Dewar D, Underhill SM, Goldberg MP. Oligodendrocytes and ischemic brain injury. J Cereb Blood Flow Metab. 2003;23:263–274. doi: 10.1097/01.WCB.0000053472.41007.F9. [DOI] [PubMed] [Google Scholar]
- Giguere P, Turcotte ME, Hamelin E, Parent A, Brisson J, Laroche G, Labrecque P, Dupuis G, Parent JL. Peroxiredoxin-4 interacts with and regulates the thromboxane A(2) receptor. FEBS Lett. 2007;581:3863–3868. doi: 10.1016/j.febslet.2007.07.011. [DOI] [PubMed] [Google Scholar]
- Gong Y, Lee JN, Lee PC, Goldstein JL, Brown MS, Ye J. Sterol-regulated ubiquitination and degradation of Insig-1 creates a convergent mechanism for feedback control of cholesterol synthesis and uptake. Cell Metab. 2006;3:15–24. doi: 10.1016/j.cmet.2005.11.014. [DOI] [PubMed] [Google Scholar]
- Gottschall PE, Yu X, Bing B. Increased production of gelatinase B (matrix metalloproteinase-9) and interleukin-6 by activated rat microglia in culture. J Neurosci Res. 1995;42:335–342. doi: 10.1002/jnr.490420307. [DOI] [PubMed] [Google Scholar]
- Hall AA, Guyer AG, Leonardo CC, Ajmo CT, Jr, Collier LA, Willing AE, Pennypacker KR. Human umbilical cord blood cells directly suppress ischemic oligodendrocyte cell death. J Neurosci Res. 2009;87:333–341. doi: 10.1002/jnr.21857. [DOI] [PMC free article] [PubMed] [Google Scholar]
- Hofmann B, Hecht HJ, Flohe L. Peroxiredoxins. Biol Chem. 2002;383:347–364. doi: 10.1515/BC.2002.040. [DOI] [PubMed] [Google Scholar]
- Hozumi I, Inuzuka T, Tsuji S. Brain injury and growth inhibitory factor (GIF)--a minireview. Neurochem Res. 1998;23:319–328. doi: 10.1023/a:1022401315721. [DOI] [PubMed] [Google Scholar]
- Hwang YP, Kim HG, Han EH, Jeong HG. Metallothionein-III protects against 6-hydroxydopamine-induced oxidative stress by increasing expression of heme oxygenase-1 in a PI3K and ERK/Nrf2-dependent manner. Toxicol Appl Pharmacol. 2008;231:318–327. doi: 10.1016/j.taap.2008.04.019. [DOI] [PubMed] [Google Scholar]
- Jang HH, Lee KO, Chi YH, Jung BG, Park SK, Park JH, Lee JR, Lee SS, Moon JC, Yun JW, Choi YO, Kim WY, Kang JS, Cheong GW, Yun DJ, Rhee SG, Cho MJ, Lee SY. Two enzymes in one; two yeast peroxiredoxins display oxidative stress-dependent switching from a peroxidase to a molecular chaperone function. Cell. 2004;117:625–635. doi: 10.1016/j.cell.2004.05.002. [DOI] [PubMed] [Google Scholar]
- Jin MH, Lee YH, Kim JM, Sun HN, Moon EY, Shong MH, Kim SU, Lee SH, Lee TH, Yu DY, Lee DS. Characterization of neural cell types expressing peroxiredoxins in mouse brain. Neurosci Lett. 2005;381:252–257. doi: 10.1016/j.neulet.2005.02.048. [DOI] [PubMed] [Google Scholar]
- Johns TG, Bernard CC. The structure and function of myelin oligodendrocyte glycoprotein. J Neurochem. 1999;72:1–9. doi: 10.1046/j.1471-4159.1999.0720001.x. [DOI] [PubMed] [Google Scholar]
- Juurlink BH. Response of glial cells to ischemia: roles of reactive oxygen species and glutathione. Neurosci Biobehav Rev. 1997;21:151–166. doi: 10.1016/s0149-7634(96)00005-x. [DOI] [PubMed] [Google Scholar]
- Juurlink BH, Thorburne SK, Hertz L. Peroxide-scavenging deficit underlies oligodendrocyte susceptibility to oxidative stress. Glia. 1998;22:371–378. doi: 10.1002/(sici)1098-1136(199804)22:4<371::aid-glia6>3.0.co;2-6. [DOI] [PubMed] [Google Scholar]
- Kang SW, Rhee SG, Chang TS, Jeong W, Choi MH. 2-Cys peroxiredoxin function in intracellular signal transduction: therapeutic implications. Trends Mol Med. 2005;11:571–578. doi: 10.1016/j.molmed.2005.10.006. [DOI] [PMC free article] [PubMed] [Google Scholar]
- Kaplan MR, Meyer-Franke A, Lambert S, Bennett V, Duncan ID, Levinson SR, Barres BA. Induction of sodium channel clustering by oligodendrocytes. Nature. 1997;386:724–728. doi: 10.1038/386724a0. [DOI] [PubMed] [Google Scholar]
- Kursula P. Structural properties of proteins specific to the myelin sheath. Amino Acids. 2008;34:175–185. doi: 10.1007/s00726-006-0479-7. [DOI] [PubMed] [Google Scholar]
- Liu Y, Chen L, Ko TC, Fields AP, Thompson EA. Evi1 is a survival factor which conveys resistance to both TGFbeta- and taxol-mediated cell death via PI3K/AKT. Oncogene. 2006;25:3565–3575. doi: 10.1038/sj.onc.1209403. [DOI] [PubMed] [Google Scholar]
- Lloyd-Jones D, Adams R, Carnethon M, De Simone G, Ferguson TB, Flegal K, Ford E, Furie K, Go A, Greenlund K, Haase N, Hailpern S, Ho M, Howard V, Kissela B, Kittner S, Lackland D, Lisabeth L, Marelli A, McDermott M, Meigs J, Mozaffarian D, Nichol G, O'Donnell C, Roger V, Rosamond W, Sacco R, Sorlie P, Stafford R, Steinberger J, Thom T, Wasserthiel-Smoller S, Wong N, Wylie-Rosett J, Hong Y. Heart disease and stroke statistics--2009 update: a report from the American Heart Association Statistics Committee and Stroke Statistics Subcommittee. Circulation. 2009;119:480–486. doi: 10.1161/CIRCULATIONAHA.108.191259. [DOI] [PubMed] [Google Scholar]
- Lyons SA, Kettenmann H. Oligodendrocytes and microglia are selectively vulnerable to combined hypoxia and hypoglycemia injury in vitro. J Cereb Blood Flow Metab. 1998;18:521–530. doi: 10.1097/00004647-199805000-00007. [DOI] [PubMed] [Google Scholar]
- McCarthy KD, de Vellis J. Preparation of separate astroglial and oligodendroglial cell cultures from rat cerebral tissue. J Cell Biol. 1980;85:890–902. doi: 10.1083/jcb.85.3.890. [DOI] [PMC free article] [PubMed] [Google Scholar]
- Miller AK, Alston RL, Corsellis JA. Variation with age in the volumes of grey and white matter in the cerebral hemispheres of man: measurements with an image analyser. Neuropathol Appl Neurobiol. 1980;6:119–132. doi: 10.1111/j.1365-2990.1980.tb00283.x. [DOI] [PubMed] [Google Scholar]
- Miyazaki I, Asanuma M, Higashi Y, Sogawa CA, Tanaka K, Ogawa N. Age-related changes in expression of metallothionein-III in rat brain. Neurosci Res. 2002;43:323–333. doi: 10.1016/s0168-0102(02)00057-3. [DOI] [PubMed] [Google Scholar]
- Moeenrezakhanlou A, Shephard L, Lam L, Reiner NE. Myeloid cell differentiation in response to calcitriol for expression CD11b and CD14 is regulated by myeloid zinc finger-1 protein downstream of phosphatidylinositol 3-kinase. J Leukoc Biol. 2008;84:519–528. doi: 10.1189/jlb.1207833. [DOI] [PubMed] [Google Scholar]
- Morales-Ruiz M, Fulton D, Sowa G, Languino LR, Fujio Y, Walsh K, Sessa WC. Vascular endothelial growth factor-stimulated actin reorganization and migration of endothelial cells is regulated via the serine/threonine kinase Akt. Circ Res. 2000;86:892–896. doi: 10.1161/01.res.86.8.892. [DOI] [PubMed] [Google Scholar]
- Nakamura S, Okinaka K, Hirano I, Ono T, Sugimoto Y, Shigeno K, Fujisawa S, Shinjo K, Ohnishi K. KIS induces proliferation and the cell cycle progression through the phosphorylation of p27Kip1 in leukemia cells. Leuk Res. 2008;32:1358–1365. doi: 10.1016/j.leukres.2008.02.012. [DOI] [PubMed] [Google Scholar]
- Neuhoff S, Moers J, Rieks M, Grunwald T, Jensen A, Dermietzel R, Meier C. Proliferation, differentiation, and cytokine secretion of human umbilical cord blood-derived mononuclear cells in vitro. Exp Hematol. 2007;35:1119–1131. doi: 10.1016/j.exphem.2007.03.019. [DOI] [PubMed] [Google Scholar]
- Newcomb JD, Ajmo CT, Jr, Sanberg CD, Sanberg PR, Pennypacker KR, Willing AE. Timing of cord blood treatment after experimental stroke determines therapeutic efficacy. Cell Transplant. 2006;15:213–223. doi: 10.3727/000000006783982043. [DOI] [PubMed] [Google Scholar]
- Newman MB, Willing AE, Manresa JJ, Davis-Sanberg C, Sanberg PR. Stroke-induced migration of human umbilical cord blood cells: time course and cytokines. Stem Cells Dev. 2005;14:576–586. doi: 10.1089/scd.2005.14.576. [DOI] [PubMed] [Google Scholar]
- Nguyen AD, McDonald JG, Bruick RK, DeBose-Boyd RA. Hypoxia stimulates degradation of 3-hydroxy-3-methylglutaryl-coenzyme A reductase through accumulation of lanosterol and hypoxia-inducible factor-mediated induction of insigs. J Biol Chem. 2007;282:27436–27446. doi: 10.1074/jbc.M704976200. [DOI] [PubMed] [Google Scholar]
- Noble M, Mayer-Proschel Margot, Miller Robert H. The Oligodendrocyte. Developmental Neurobiology, Vol. New York: Plenum Publisher; 2005. [Google Scholar]
- Riederer BM, Pellier V, Antonsson B, Di Paolo G, Stimpson SA, Lutjens R, Catsicas S, Grenningloh G. Regulation of microtubule dynamics by the neuronal growth-associated protein SCG10. Proc Natl Acad Sci U S A. 1997;94:741–745. doi: 10.1073/pnas.94.2.741. [DOI] [PMC free article] [PubMed] [Google Scholar]
- Sanberg PR, Willing AE, Garbuzova-Davis S, Saporta S, Liu G, Sanberg CD, Bickford PC, Klasko SK, El-Badri NS. Umbilical cord blood-derived stem cells and brain repair. Ann N Y Acad Sci. 2005;1049:67–83. doi: 10.1196/annals.1334.008. [DOI] [PubMed] [Google Scholar]
- Schachner M, Kim SK, Zehnle R. Developmental expression in central and peripheral nervous system of oligodendrocyte cell surface antigens (O antigens) recognized by monoclonal antibodies. Dev Biol. 1981;83:328–338. doi: 10.1016/0012-1606(81)90478-4. [DOI] [PubMed] [Google Scholar]
- Sheng W, Wang G, Wang Y, Liang J, Wen J, Zheng PS, Wu Y, Lee V, Slingerland J, Dumont D, Yang BB. The roles of versican V1 and V2 isoforms in cell proliferation and apoptosis. Mol Biol Cell. 2005;16:1330–1340. doi: 10.1091/mbc.E04-04-0295. [DOI] [PMC free article] [PubMed] [Google Scholar]
- Sim FJ, Lang JK, Ali TA, Roy NS, Vates GE, Pilcher WH, Goldman SA. Statin treatment of adult human glial progenitors induces PPAR gamma-mediated oligodendrocytic differentiation. Glia. 2008;56:954–962. doi: 10.1002/glia.20669. [DOI] [PubMed] [Google Scholar]
- Simons M, Trajkovic K. Neuron-glia communication in the control of oligodendrocyte function and myelin biogenesis. J Cell Sci. 2006;119:4381–4389. doi: 10.1242/jcs.03242. [DOI] [PubMed] [Google Scholar]
- Six I, Kureishi Y, Luo Z, Walsh K. Akt signaling mediates VEGF/VPF vascular permeability in vivo. FEBS Lett. 2002;532:67–69. doi: 10.1016/s0014-5793(02)03630-x. [DOI] [PubMed] [Google Scholar]
- Sommer I, Schachner M. Cell that are O4 antigen-positive and O1 antigen-negative differentiate into O1 antigen-positive oligodendrocytes. Neurosci Lett. 1982;29:183–188. doi: 10.1016/0304-3940(82)90351-2. [DOI] [PubMed] [Google Scholar]
- Uchida Y, Gomi F, Masumizu T, Miura Y. Growth inhibitory factor prevents neurite extension and the death of cortical neurons caused by high oxygen exposure through hydroxyl radical scavenging. J Biol Chem. 2002;277:32353–32359. doi: 10.1074/jbc.M111263200. [DOI] [PubMed] [Google Scholar]
- Valentin F, Field MC, Tippins JR. The mechanism of oxidative stress stabilization of the thromboxane receptor in COS-7 cells. J Biol Chem. 2004;279:8316–8324. doi: 10.1074/jbc.M306761200. [DOI] [PubMed] [Google Scholar]
- Vendrame M, Cassady J, Newcomb J, Butler T, Pennypacker KR, Zigova T, Sanberg CD, Sanberg PR, Willing AE. Infusion of human umbilical cord blood cells in a rat model of stroke dose-dependently rescues behavioral deficits and reduces infarct volume. Stroke. 2004;35:2390–2395. doi: 10.1161/01.STR.0000141681.06735.9b. [DOI] [PubMed] [Google Scholar]
- Wang M, Yang Y, Yang D, Luo F, Liang W, Guo S, Xu J. The immunomodulatory activity of human umbilical cord blood-derived mesenchymal stem cells in vitro. Immunology. 2009;126:220–232. doi: 10.1111/j.1365-2567.2008.02891.x. [DOI] [PMC free article] [PubMed] [Google Scholar]
- Wegiel B, Bjartell A, Culig Z, Persson JL. Interleukin-6 activates PI3K/Akt pathway and regulates cyclin A1 to promote prostate cancer cell survival. Int J Cancer. 2008;122:1521–1529. doi: 10.1002/ijc.23261. [DOI] [PubMed] [Google Scholar]
- Wilkins A, Majed H, Layfield R, Compston A, Chandran S. Oligodendrocytes promote neuronal survival and axonal length by distinct intracellular mechanisms: a novel role for oligodendrocyte-derived glial cell line-derived neurotrophic factor. J Neurosci. 2003;23:4967–4974. doi: 10.1523/JNEUROSCI.23-12-04967.2003. [DOI] [PMC free article] [PubMed] [Google Scholar]
- Wood PM, Bunge RP. The origin of remyelinating cells in the adult central nervous system: the role of the mature oligodendrocyte. Glia. 1991;4:225–232. doi: 10.1002/glia.440040214. [DOI] [PubMed] [Google Scholar]
- Yang Z, Watanabe M, Nishiyama A. Optimization of oligodendrocyte progenitor cell culture method for enhanced survival. J Neurosci Methods. 2005;149:50–56. doi: 10.1016/j.jneumeth.2005.05.003. [DOI] [PubMed] [Google Scholar]
- Yu YL, Chiang YJ, Chen YC, Papetti M, Juo CG, Skoultchi AI, Yen JJ. MAPK-mediated phosphorylation of GATA-1 promotes Bcl-XL expression and cell survival. J Biol Chem. 2005;280:29533–29542. doi: 10.1074/jbc.M506514200. [DOI] [PMC free article] [PubMed] [Google Scholar]


