Abstract
A quadrature digital receiver and associated signal estimation procedure are reported for L-band electron paramagnetic resonance (EPR) spectroscopy. The approach provides simultaneous acquisition and joint processing of multiple harmonics in both in-phase and out-of-phase channels. The digital receiver, based on a high-speed dual-channel analog-to-digital converter, allows direct digital down-conversion with heterodyne processing using digital capture of the microwave reference signal. Thus, the receiver avoids noise and nonlinearity associated with analog mixers. Also, the architecture allows for low-Q anti-alias filtering and does not require the sampling frequency to be time-locked to the microwave reference. A noise model applicable for arbitrary contributions of oscillator phase noise is presented, and a corresponding maximum-likelihood estimator of unknown parameters is also reported. The signal processing is applicable for Lorentzian lineshape under nonsaturating conditions. The estimation is carried out using a convergent iterative algorithm capable of jointly processing the in-phase and out-of-phase data in the presence of phase noise and unknown microwave phase. Cramér-Rao bound analysis and simulation results demonstrate a significant reduction in linewidth estimation error using quadrature detection, for both low and high values of phase noise. EPR spectroscopic data are also reported for illustration.
Keywords: EPR, Digital Detection, Overmodulation, Linewidth Estimation, Multiple Harmonics, Oximetry
1. Introduction
Electron paramagnetic resonance (EPR) is a spectroscopic method capable of detecting free radicals. Over the past several decades, EPR has found numerous applications in biology, chemistry, physics, and medicine [1]. For biological applications, such as in vivo oximetry [2, 3, 4], there exists a pressing need to speed up the data acquisition process for EPR spectroscopy and imaging [5].
For EPR, the data are collected by measuring the absorption of electromagnetic radiation, usually in the microwave range, by paramagnetic species in the presence of an external magnetic field. For imaging applications, an additional magnetic field, in the form of a linear magnetic field gradient, is applied to provide spatial encoding. Recent efforts to accelerate EPR data collection include both hardware and algorithm developments. For example, overmodulation [6], fast scan [7], rapid scan [8], pulsed EPR [9, 10], parametric modeling [11], adaptive and uniform data sampling [12, 13], and multisite oximetry [14, 15] have shown potential to accelerate the acquisition process.
The microwave signal reflected from the EPR sample cavity, also called resonator, experiences changes in both amplitude and phase upon magnetic resonance. These changes encode the absorption and dispersion components of the EPR spectra. To avoid 1/f noise, associated with both the microwave source and the diode detector commonly employed to demodulate the EPR signal to baseband, it is a common practice to apply field modulation. The process of EPR signal extraction then reduces to diode detection followed by phase sensitive detection (PSD) [16]. Inclusion of automatic frequency control (AFC), in its typical configuration [17], allows capturing an absorption harmonic. Other AFC configurations allow collection of a dispersion harmonic instead [18].
Homodyne detection, involving magnetic field modulation and PSD, remains the most prevalent configuration for CW EPR spectrometers. An obvious limitation of homodyne detection is the inability to collect multiple field modulation harmonics simultaneously. For cases where the field modulation amplitude approaches or exceeds the intrinsic linewidth of the paramagnetic specie, a significant fraction of energy resides in higher harmonics. Therefore, quadrature detection across multiple harmonics can reduce the data collection time, or, equivalently, can improve the signal-to-noise ratio (SNR).
Hyde et al. [19] were the first to demonstrate a technique, using digital heterodyne reception, to simultaneously collect absorption and dispersion spectra across multiple harmonics. Several prototypes were presented [20] to implement the digital receiver. The basic configuration included: (i) down-conversion of the microwave signal (reflected from the sample cavity) to an intermediate frequency (IF), (ii) time-locked subsampling of the IF signal without inducing aliasing, and (iii) digital matched filtering. In 2008, Yen [21] reported linewidth estimation error analysis for jointly processing multiple quadrature harmonics of a Lorentzian lineshape. More recently, Tseitlin et al. [22, 23] reported implementation of a digital heterodyne receiver to collect multiple harmonics of absorption and used nonlinear curve fitting to estimate Lorentzian linewidth information.
In this work, we present a direct digital receiver design and briefly outline its implementation. The receiver utilizes a high-speed dual-channel analog-to-digital converter (ADC) to simultaneously sample the bandpass signals from both the microwave source and the circulator which carries the reflected signal from the sample cavity. Direct digital conversion avoids noise and nonlinear distortion associated with analog mixers. Further, this configuration does not require the sampling frequency to be time-locked to the microwave reference [19]. Unlike previously reported work [22], which processed the absorption data alone, we present a framework to jointly process multiple harmonics for quadrature channels. In addition, our proposed processing is capable of handling unequal noise powers between the quadrature channels, for instance due to phase noise of the microwave source. Other benefits of the proposed receiver and processing include modeling and recovery of nuisance parameters including microwave phase, baseline distortion, and magnetic field drift.
The remainder of the paper is organized as follows: Section 2 describes the instrumentation and the processing approach to jointly estimate unknown parameters including linewidth, spin density, microwave phase, baseline offset and slope, center field, and modulation amplitude; Section 3 presents results from simulation and an L-band spectroscopy experiment; Section 4 includes discussion; Section 5 summarizes the conclusions; and A provides derivation of an EPR noise model applicable to cases with nonnegligible phase noise contributions.
2. Methodology
Digital detection offers several advantages over the traditional homodyne detection, including collection of multiple harmonics and flexibility of retrospective signal processing. However, implementation of a digital receiver poses unique technical challenges. In this section, we briefly overview the proposed digital receiver design, highlighting its differences from existing designs. Also, we present a convergent iterative processing scheme for maximum-likelihood estimation of the unknown parameters under nonideal conditions, such as in the presence of phase noise, unknown microwave phase, and baseline drift.
2.1. Receiver Overview
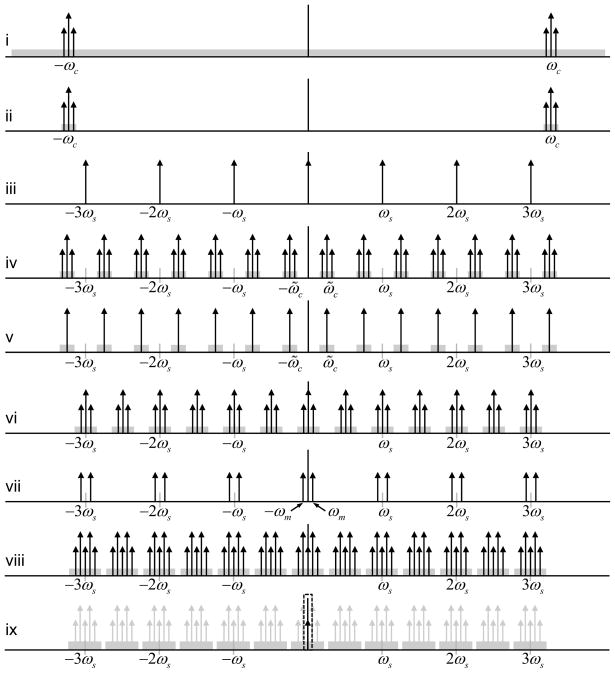
The basic operation of digital down-conversion via sub-Nyquist sampling of a bandpass signal is illustrated in Fig. 1. The microwave signal reflected from the resonator (Fig. 1(i)) is amplified and bandpass filtered before it is sampled in channel 1 of the ADC. The signal is bandpass in that it has bandwidth of approximately 2π ×3×106 rad/s while the accompanying noise is bandpass with 2π × 75 × 106 rad/s bandwidth defined by the bandpass filter. The signal, along with the noise, is centered on the carrier frequency, ωc. By sampling at a rate, ωs, below ωc, aliases of the bandpass signal are replicated periodically, as depicted in Fig. 1(iv). An appropriate selection of ωs ensures that the replicas, called images, of the signal are disjoint in frequency, and hence that aliasing artifacts are avoided. For example, with ωc = 2π × 1.283 × 109 rad/s and ωs = 2π × 400 × 106 rad/s, an image of the original bandpass microwave signal is centered at 2π × 83 × 106 rad/s (i.e., ωc − kωs for k = 3); so, the 2π × 75 × 106 rad/s bandwidth of the filtered microwave signal fits easily within the unaliased Nyquist zone, 0 to ωs/2. Thus, sampling effectively provides demodulation to a digital IF signal. (This is an example of sampling a bandpass signal in the seventh Nyquist zone [24].)
Figure 1.
Frequency domain illustration of digital detection. Reflected EPR signal along with the noise shown in gray (i); reflected signal after bandpass filtering (ii); sampling frequency generated by AWG (iii); sampled bandpass reflected signal (iv); sampled bandpass microwave signal from the microwave source (v); baseband signal SI (or SQ, depending on the phase of microwave signal) obtained by point-by-point time-domain multiplication of iv and v (vi); sampled field modulation signal (vii); point-by-point time-domain multiplication of vi and vii (viii); digital lowpass filtering to obtain one sample of the I1 (or Q1) (ix). For simplicity, only one harmonic is displayed around the microwave carrier.
The microwave source signal is likewise bandpass filtered and is sampled in channel 2, thereby providing a reference for eventually digital demodulation from IF to baseband as shown in Fig. 1. Specifically, the contents of channel 1 (C1) are digitally multiplied with the contents of channel 2 (C2) and its Hilbert transform, (C̆2) to generate in-phase (SI) and out-of-phase (SQ) baseband channels, respectively. While the two channels of the ADC are time-locked by virtue of a common sampling clock, the sampling clock is not time-locked to the microwave source in this architecture. Both (SI) and (SQ) are then digitally cross-correlated with sinusoidal waveforms at the modulation frequency ωm and its multiples to extract individual harmonics I1, I2, I3…, and Q1, Q2, Q3…, respectively. The sampled data streams, C1 and C2, from each scan are decomposed into small blocks, and all the postprocessing is carried out on a block-by-block basis. The block size is chosen sufficiently small such that the swept magnetic field is approximately constant across a single block. In experiments reported here, 1024 blocks, each 38 ms in duration, were used to provide a total sweep width of 10 G in 3.9 s.
2.2. Hardware Layout
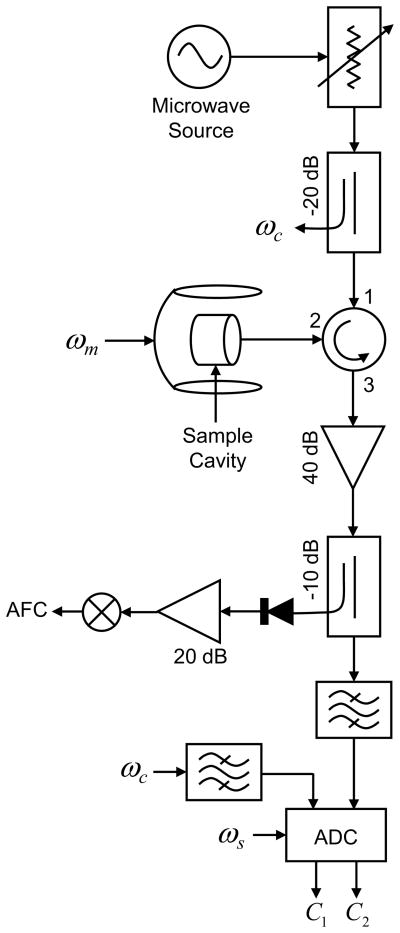
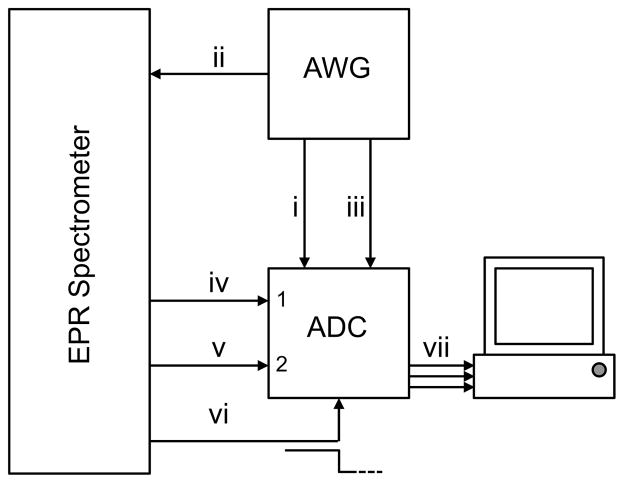
Figures 2 and 3 show the block diagram of the digital receiver and its interface with a CW EPR spectrometer, respectively. The microwave signal from the circulator is amplified using a 40 dB low-noise amplifier (LNA) and bandpass filtered using an analog filter with 2π × 75 × 106 rad/s bandwidth before being fed to channel 1 of the ADC. The signal from the microwave source, a cavity oscillator in this case, is bandpass filtered using a similar analog filter before being fed to channel 2 of the ADC. The sampling and field modulation waveforms are phase-locked via generation by a common arbitrary waveform generator (AWG). An output from the AWG indicating the periodic zero-crossing of the field modulation waveform is also fed to the ADC (connection iii in Fig. 3). This signal encodes the true phase of the field modulation, and is used to synthetically generate a field modulation waveform and its harmonics; the individual harmonics of the EPR spectrum are extracted by matched filtering SI and SQ with the synthetically generated field modulation waveforms. Traditional AFC circuitry [17], employing PSD, is used to lock ωc to the resonant frequency of the cavity,ω0. The time-constant of the AFC is kept large enough to ensure that there is no AFC response to ωm or any of its multiples. Typical design parameters for the digital receiver are summarized in Table 1, and specifications of the major components are reported in Table 2.
Figure 2.
Block diagram of CW spectrometer capable of direct digital detection.
Figure 3.
Basic layout for a digital receiver. Sampling signal (i); field modulation waveform (ii); trigger indicating the zero-crossing of the field modulation waveform (iii); reflected EPR signal to channel 1 of the ADC (iv); microwave signal to channel 2 of ADC (v); trigger from the Bruker (Billerica, MA) field controller to initiate data acquisition (vi); and sampled channel 1 (C1), sampled channel 2 (C2), and sampled trigger for the field modulation (vii).
Table 1.
Typical parameter values for the designed L-band digital receiver.
| Parameter | Symbol | Value |
|---|---|---|
| Microwave Frequency | ωc | 2π × 1.283 × 109 rad/s |
| Sampling Frequency | ωs | 2π × 400 × 106 rad/s |
| Modulation Frequency | ωm | 2π × 100 × 103 rad/s |
| AFC Frequency | 2π × 76.8 × 103 rad/s | |
| Microwave Power | 2 mW |
Table 2.
Digital receiver components specifications.
| Component | Vendor and Specification |
|---|---|
| BPF | K & L Microwave (custom made), center=2π × 1.282 ×109 rad/s, bandwidth=2π ×75 ×106 rad/s |
| LNA | HD Communications (HD 24410), gain=40 dB |
| ADC | Ultraview Corp. (AD12-500×2-8GB), upto 500 MS/s, 12 bit vertical resolution, and 8 GB RAM |
| Resonator | Home built reentrant resonator, 12 mm diameter, 12 mm length, ω0 = 2π × 1.283 × 109 rad/s |
| Oscillator | Englemann Microwave (CC-12), cavity oscillator, ωc = 2π × (1 − 2) × 109 rad/s |
| Field Controller | Bruker ER 032M |
| AWG | Tektronix (AWG7122B) |
| Computer | Ultraview Corp., Intel dual core 2.66 GHz, 8 GB RAM, 1 TB hard drive |
No reference arm was used in our design. Since the reference signal (C1) was not fed to the AFC diode, the design solely relied on the reflected microwave energy in C2 to bias the diode. To ensure an adequate energy in C2 for biasing, the spectrometer was operated under suboptimal condition of either overcoupling or undercoupling. Too much departure from the critical coupling (β0 = 1), however, was troublesome in a number of ways. First, it decreased the overall sensitivity of the system. Second, it threatened to saturate the LNA. Lastly, it reduced the effective vertical resolution of the ADC because the EPR signal became increasingly smaller than the dynamic range of the ADC defined by the stronger microwave carrier. Therefore, the coupling was kept as close to the critical value as allowed by the AFC locking capability. However, the requirement of over- or undercoupling can be avoided altogether by using a different AFC design. For example, a quadrature AFC design with its own phase-insensitive reference arm [25] can handle this shortcoming.
Unlike time-locked subsampling [19], a strict adherence to ωs values that generate four samples in an odd number of cycles is not required in our design. Any value of ωs that result in nonoverlapping replicas of the bandpass microwave signal is a viable option. Although it is possible to use lower sampling frequency, a higher frequency, even when it is below the Nyquist rate, offers advantages. The most important benefit of a high sampling rate is its positive effect on the antialiasing bandpass filter design. A large value of ωs alleviates the requirement of sharp transition from pass-band to stop-band. Also, it allows for filters with lower quality-factor, which are easier to design and possess favorable characteristics such a uniform amplitude and group delay across the bandwidth of the EPR signal. Another advantage of high ωs is the increase in effective vertical resolution of the ADC [26]. The only downside of a high sampling frequency is the amount of data generated. For our design, the two ADC channels collectively generated 6 GB of data for a four second scan. Although the PCI express-based ADC board itself is capable of real-time streaming, the actual data transfer from the ADC on-board memory to the computer took 40 s, primarily due to slow write speed of the hard drive. This limitation, however, can be overcome by using commercially available fast storage systems. For example, PCI express host adapter (ExpressSAS H6F0) by Atto Technology (Amherst, New York) is capable of handling up to 600 MB/s bandwidth for each of its 16 external ports.
2.3. Signal and Noise Model
Phase noise, defined by the random additive variations in the phase of the microwave signal, is invariably present in the output of any oscillator. Depending on the type of resonator, type of oscillator, and microwave power, the phase noise may become the dominant noise source in the EPR spectra. Several solutions have been proposed by the EPR community to counter the effects of phase noise. Some common remedies include: avoiding the phase noise prone dispersion component altogether; using a low-phase noise Gunn diode oscillator [27]; using a low quality-factor loop-gap resonator [18]; reducing the incident microwave power; and using a bimodal resonator [28, 29]. Our approach does not eliminate or suppress the phase noise itself, but instead exploits a quadrature receiver to reliably estimate EPR lineshape parameters in the presence of phase noise. Also, the approach, which is capable of handling unknown microwave phase, is an attractive alternative to adjusting the phase by manual tuning [30].
Because the two inputs arriving at the ADC are not phase-locked, the harmonics generated by the SI and SQ channels are not purely absorption and dispersion but instead are a combination given by
| (1) |
where H0 represents the external magnetic field; φ0 denotes the unknown microwave phase discrepancy between the two channels of the ADC; Ih and Qh represent the hth harmonic extracted from SI and SQ, respectively; and ah(H0) and bh(H0) represent absorption and dispersion lineshapes [6] for the hth harmonic.
In the presence of noise, including phase noise, Eq. 1 can be modified to
| (2) |
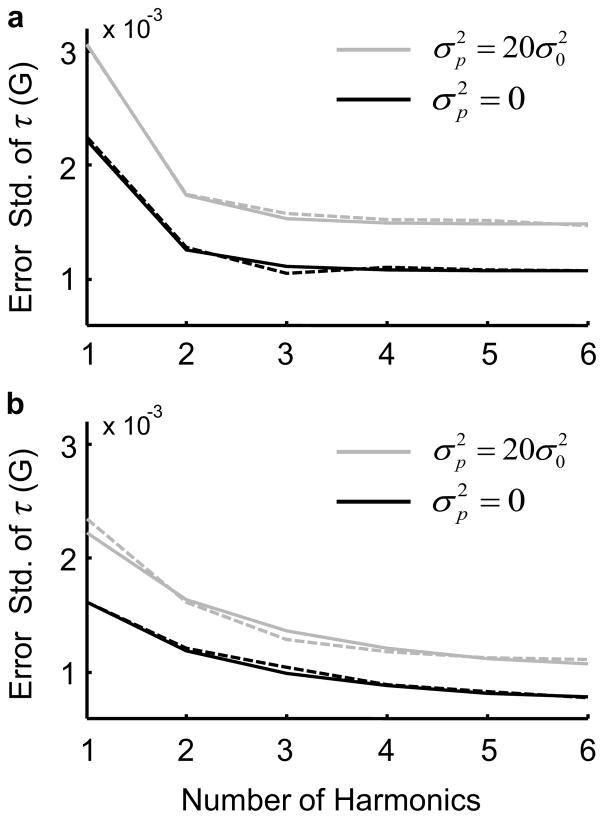
where p represents phase noise and has uncorrelated zero-mean Gaussian entries with variance . The sampled noise values in u and v represent collective noise from all other sources (primarily amplifiers) in the in-phase and out-of-phase channels, respectively. Both u and v are independent and identically distributed Gaussian [11] random variables with variance . For the derivation of Eq. 2, see A. For φ0 = 0, Fig. 4 shows Cramér-Rao lower bound (CRLB) and corresponding simulation results displaying the impact of collecting multiple harmonics on the estimation error of full-width half-maximum (FWHM) linewidth τ for varying degrees of phase noise.
Figure 4.
Simulation (dotted line) and CRLB (solid line) results showing the impact of multiple harmonics with (gray) and without (black) the phase noise. FWHM linewidth τ = 1 G and field modulation amplitude Hm = 1 G (a) and Hm = 3 G (b). For each parameter set, 500 trial runs are considered for the simulation.
The digital receiver considered here provides quadrature detection with respect to the microwave phase but only a single-channel (in-phase) detection with respect to the field modulation phase. Under nonsaturating conditions, the out-of-phase field modulation channel contains negligible energy and hence can be ignored.
2.4. Parameter Estimation
For the spectroscopic data, the unknown parameters include linewidth τ, spin density d, microwave phase φ0, baseline offset (one per each harmonic component), baseline slope (one per each harmonic component), center field, and modulation amplitude Hm. For φ0 ≠ 0, the absorption (ah) and dispersion (bh) components get mixed (Eq. 2) and so does the phase noise. If is not negligible compared to , the contamination from phase noise can adversely affect the SNR of both Ih and Qh components. Therefore, in order to best estimate linewidth, it is important to estimate and adjust the nuisance parameter φ0.
In this work, we have adopted a postprocessing approach, termed as iterative phase-rotation estimation (IPRE), to compute the unknown parameters by jointly processing the multiple harmonics. A pseudo code for the IPRE implementation is as follows:
Initialization
Iteration
-
for j = 1 : J
end
where represents phase-rotation of by , MF represents digital matched filtering, WLS represents weighted least-squares curve fitting, and j indicates the iteration number. Note, for .
In the first iteration of the IPRE, a weighted least-squares curve fitting is performed on the quadrature harmonics, and , extracted from the original data C1 and C2. The estimated microwave phase from iteration 1 is denoted by . In the second iteration, is rotated by , and this phase-rotated version of C2 is denoted by . Both and are reconstructed by multiplication of C1 with phase-rotated and , respectively. To yield individual harmonics, and are matched filtered with the synthetically generated modulation waveform and its harmonics. The iterative process is repeated until a convergence criterion is reached.
When approaches zero, the corresponding and approximate pure absorption and dispersion lineshapes of the hth harmonic, respectively. In each iteration, the curve fitting is performed using nonlinear weighted least-squares, with weighting of and proportional to and , respectively. Since the true values of and may not be known, approximate values can be estimated from the tails of the Fourier transform of and . Alternatively, the process of least-squares can be performed twice within each iteration, such that and estimated from the residuals of the first unweighted least-squares curve fitting are used in the second weighted least-squares curve fitting.
For the simulation and experimental studies reported in this work, we terminated the IPRE after only two iterations. We observed a very rapid convergence of the IPRE, and increasing the number of iterations beyond two did not provide further improvement. For cases where slow convergence is expected, for example in extremely low SNR, it is possible to increase the number of iterations. The parameters estimated by the IPRE are locally convergent to a maximum-likelihood estimate for the signal model in Eq. 1. Although it is possible to phase-rotate the reconstructed harmonics Ih and Qh directly, such a procedure would only further mix the various noise terms and generate a suboptimal solution.
3. Results
3.1. Simulation
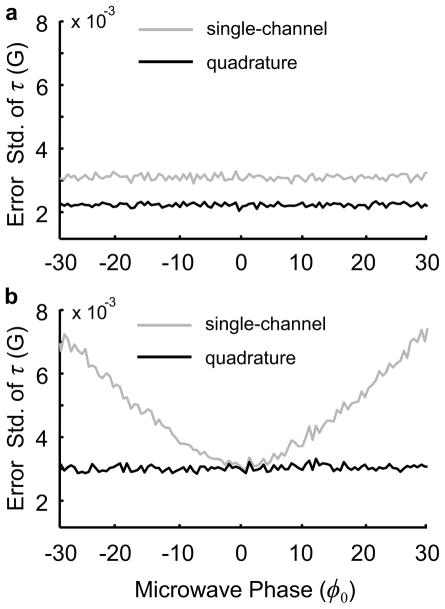
The purpose of this simulation study is to establish the benefit of quadrature detection in comparison to the previously reported single-channel detection [22]. For , adding the second channel provides approximately 3 dB SNR gain irrespective of the φ0 value. On the other hand, for phase noise power which is comparable to or larger than , the benefit of adding a second channel lies not in an explicit 3 dB gain in SNR but rather in the ability to accurately estimate φ0. Even a small φ0, if unaccounted, can result in a degraded estimation of τ. Figure 5 compares the performance of a quadrature receiver with that of a single-channel receiver, for varying values of φ0. For a single-channel receiver, a complex Lorentzian signal model [31] was used to estimate τ, while for a quadrature receiver the proposed IPRE was used for the estimation.
Figure 5.
Impact of collecting two channels for (a) and for (b). First six harmonics are considered for τ = 1 G and Hm = 1 G for both single-channel and quadrature estimations. Five hundred trial runs are considered for every one degree increment in φ0.
3.2. L-band Spectroscopy
A spectroscopy experiment was conducted on an L-band system equipped with the proposed digital receiver. The related parameters of the system are reported in Table 1 and 2. The sample was made from a single small crystal of LiNc-BuO [32] sealed in a capillary tube under anoxic conditions. A previously measured anoxic τ was observed to be 0.658 G.
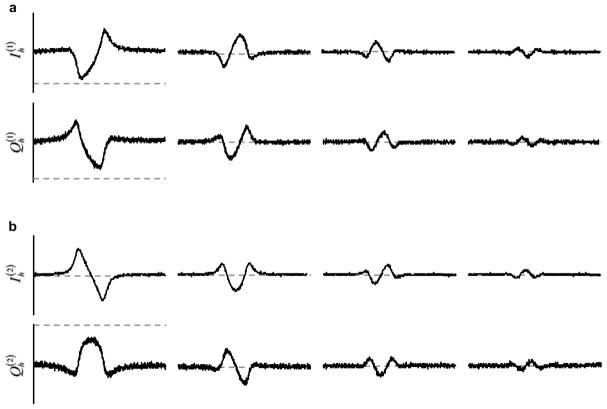
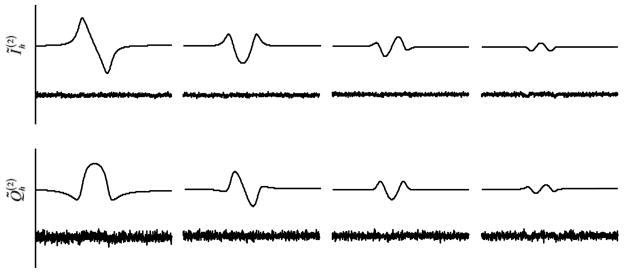
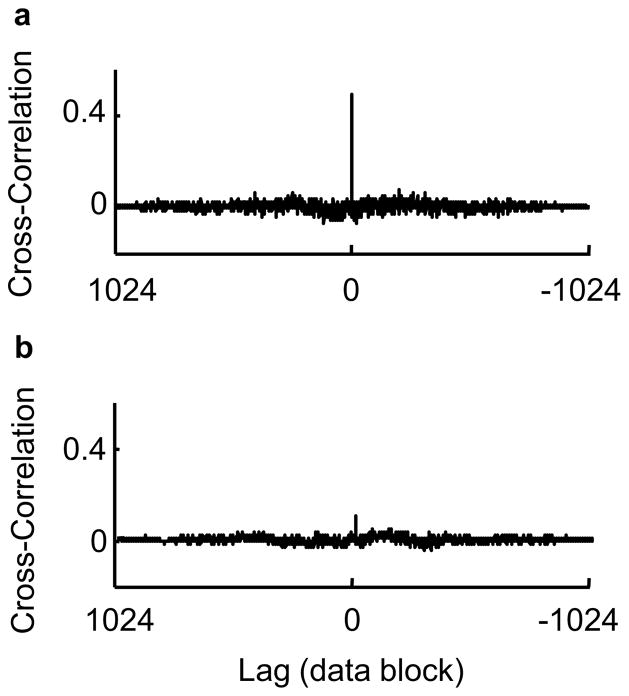
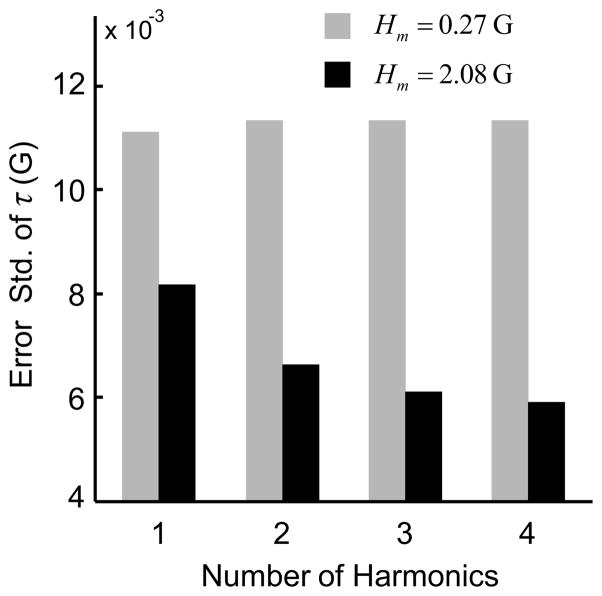
Two datasets were collected with nominal field modulation values of 0.25 G and 2.0 G, respectively. After two iterations of the IPRE, the actual field modulation values were found to be 0.27 G and 2.08 G, respectively. Each dataset was comprised of 12 repeated identical scans. The scan time was 3.9 s with a sweep width of 10 G. Figure 6 shows the effect of microwave phase-rotation on Ih and Qh harmonics. Figure 7 shows the fitting results from iteration 2 of the IPRE. Figure 8 displays the noise correlation between and and also between and . Figure 9 compares the standard deviation of estimated τ based on first harmonic with the estimation based on the first four harmonics.
Figure 6.
In-phase (Ih) and out-of-phase (Qh) harmonics before (a) and after (b) the second iteration of the IPRE. From left to right, four harmonics are shown for Hm = 2.08 G. The data were collected on an L-band CW spectrometer equipped with the proposed digital receiver. The dashed-line indicates x-axis.
Figure 7.
The fitted curves and and the two times magnified residuals corresponding to Fig. 6b
Figure 8.
Impact of C2 phase-rotation on the correlation of noise across Ih and Qh. Noise cross-correlation between and (a) and between and (b) computed from the residuals shown in the Fig. 7.
Figure 9.
Impact of collecting multiple harmonics on standard error of τ estimation. The experiment was conducted on a L-band CW EPR system equipped with the proposed quadrature digital receiver. Twelve scans were collected for each modulation amplitude.
4. Discussion
The phase noise, originating from the microwave source, does not affect the absorption and dispersion equally. The frequency fluctuations due to phase noise enter as a first-order effect for the dispersion and a second-order effect for the absorption [33]. Therefore, when present in moderation, the phase noise manifests itself almost exclusively in the dispersion. The noise from the other sources, such as the noise from the LNA and the thermal noise from the resonator, however, tends to affect both absorption and dispersion equally. Therefore, for the noise model considered (Eq. 2), Ih and Qh components have equal and independent noise terms, u and v respectively, as well as a shared noise term, p, arising from the phase noise.
The relocation of phase-noise exclusively to the out-of-phase channel requires knowledge of the microwave phase, φ0. The digital detection, with its retrospective digital data processing capabilities, allows for an accurate estimation and compensation of φ0, eliminating the requirement of manual tuning or additional hardware development. The proposed IPRE relocates the phase noise to the out-of-phase channel by iteratively estimating φ0 and phase-rotating C2. Figure 5 compares, for the simulated data, the performance of a quadrature receiver and the IPRE processing to that of a signal-channel receiver. Figure 5a suggests an approximately 3 dB gain in SNR for adding the second channel when the phase noise is negligible. For cases with considerable phase noise, Fig. 5b shows a microwave phase-independent performance of the IPRE as compared to a single-channel detection whose performance heavily relies on the φ0 value. Different selections of τ and Hm yielded similar trends. For the simulation, we chose because in the preliminary testing of our digital receiver we consistently encountered values which were 10 to 20 times depending on the microwave power level.
Figure 6 displays one of the measured datasets before and after the second iteration of IPRE, highlighting the transfer of the phase noise from the in-phase to the out-of-phase channel. For the dataset shown in Fig. 6, the noise variances were 5.06 ×10⁻⁴ and 8.95 ×10⁻⁴ in and , respectively, and 1.60 ×10⁻⁴ and 12.2 ×10⁻⁴ in and , respectively. Fig. 8 displays the noise correlation, computed from residuals of the curve fitting, after the first and second iterations of the IPRE. A considerable decrease in the correlation is a direct consequence of . The cross-correlation shows the noise is uncorrelated across time, in support of the model in Eq. 2. Additionally, the zero-lag noise correlation between the Ih and Qh components shows marked decrease after one iteration of the IPRE, illustrating proper rotation of the microwave phase to yield the Qh components as purely dispersion. For the experimental data, the estimated value of in degrees was 0.026 ± 0.38.
Figure 9 illustrates the benefit of collecting multiple harmonics. The standard error of estimation based on the first four harmonics is 29% lower than that of first harmonic alone collected at 2.08 G field modulation, which translates to approximately 50% reduction in the acquisition time. Further speed up is possible by considering more harmonics and by optimizing the field modulation amplitude. As expected, adding more harmonics for small Hm does not improve the estimation of τ while for high Hm the estimation of τ progressively improves by using more harmonics.
All postprocessing was performed in Matlab (Mathorks, MA) on a computer equipped with 2.66 GHz dual core Intel CPU, 8 GB RAM, and 64-bit CentOS operating system. The sampled data, C1 and C2, from each scan were decomposed into 1024 data blocks with each block corresponding to 38 ms of scan time. A decomposition into 4096 blocks (data not shown) produced similar results. The reconstruction of four absorption and four dispersion harmonics, which involved two iterations of the IPRE, took nearly 35 min. Because the computationally expensive processing is conducted block-by-block, parallelization of the implementation is trivial. Likewise, use of a field programmable gate array can accelerate the processing. In the presence of the AFC and field modulation, the instantaneous frequency of C2 continuously varied along the scan, making the synthesis of a potentially cleaner digital version of C2 difficult. We observed that using experimentally observed C2 instead of a digitally estimated replica tone produced better results.
The baseline drift, possibly due to microphonics, was most prominent in the first harmonic. The problem was handled by estimating two unknowns, one for the offset and one for the slope, for each harmonic component. Also, the other nuisance parameters of field modulation amplitude and center field were likewise jointly estimated with the parameters of interest, i.e., linewidth and spin density.
5. Conclusions
A quadrature digital receiver and associated signal estimation procedure are reported for L-band EPR spectroscopy. The data acquisition and processing of multiple harmonics in both in-phase and out-of-phase channels are presented. The receiver allows direct digital down-conversion, with heterodyne processing using digital capture of the microwave reference signal. Thus, the receiver avoids noise and nonlinearity associated with analog mixers. The retrospective signal processing is suitable for arbitrary microwave phase and arbitrary levels of oscillator phase noise. The proposed processing scheme is applicable for Lorentzian lineshape under nonsaturating conditions but can be extended to other parametric families of lineshapes. Simulation and experimental data illustrate the application and relative merits of our design. For the settings shown, the receiver provided 50% reduction in acquisition time when comparing results from first four harmonics to those of first harmonic alone. Even higher accelerations, under different parameter settings, are possible.
A new EPR digital receiver design to collect and process multiple harmonics.
The design avoids noise and nonlinearity associated with analog mixers.
The receiver can handle arbitrary microwave phase and oscillator phase noise.
For the settings shown, the receiver provided 50% reduction in acquisition time.
Acknowledgments
We thank Prof. Emre Ertin for loan of the Tektronix arbitrary waveform generator. This work was supported by NIH Grant EB008836.
A
Here, we develop a simple noise model for field modulated CW EPR spectra. This model is particularly useful when contributions of phase noise originating from the microwave source, in comparison to contributions from other sources of noise, are not negligible. While developing this model we have made following assumptions: (i) the phase noise is additive, i.e., it can be represented by adding a random process to the phase of the microwave signal; (ii) all other sources of noise can be represented by adding random processes to the signals from the circulator and the microwave source; (iii) frequency fluctuations of the source due to phase noise are comparable to or smaller than the frequency fluctuations due to the magnetic resonance; (iv) magnetic field value varies slowly and can be approximated by a constant across each data block; and (v) oscillator phase noise spectrum is centered around ωc and is bandlimited [34] with a bandwidth ≪ ω̃c, with ω̃c defined later in the Appendix. This noise model, along with the Robinson-Mailer model [6] that defines the EPR lineshape in the presence of field modulation, is then used in a weighted least-squares curve fitting of the measured EPR data.
The majority of CW EPR spectrometers employ a reflection cavity. The microwave signal reflected from the sample cavity encodes the EPR information. A change in complex magnetic susceptibility χ, due to magnetic resonance, changes the reflection coefficient Γ of the cavity, creating a small change in the amplitude and phase of the reflected power. This variation in the reflected signal, upon detection, is converted to an EPR signal. The reflection coefficient, in the absence of magnetic resonance, can be expressed as,
| (3) |
where coupling parameter β0 and normalized frequency mismatch ξ0 are defined as [35]
| (4) |
In the above expression, the unloaded quality-factor, q0, is proportional to the ratio of the energy stored in the cavity to the energy lost in the cavity; the radiation quality-factor, qT, is proportional to the ratio of energy stored in the cavity to the energy lost into the transmission line; ωc represents the frequency of the oscillator (microwave source); ω0 represents the resonant frequency of the cavity; and subscript “0” indicates that the value is observed in the absence of magnetic resonance.
Upon magnetic resonance, a change in the imaginary component of magnetic susceptibility Δχi translates to a change in q0, giving rise to the absorption signal, while a change in the real component of magnetic susceptibility Δχr translates to a change in ω0, generating the dispersion signal. Therefore, in the presence of magnetic resonance, which varies with the external magnetic field H0, we get [35],
| (5) |
where Δχi (H0) and Δχr (H0) are connected by Kramers-Kronig relation and describe the absorption and dispersion components of EPR spectrum. In the presence of magnetic resonance, Eqs. 3 and 4 can be written as,
| (6) |
For brevity, we will use β, ξ, and ω to represent β(H0), ξ(H0), and ω(H0), respectively.
From Eqs. 3 and 6, the real part of Γ (H0) can be expressed as
| (7) |
which in the presence of additive phase noise [36], φ (t), becomes,
| (8) |
where Δωc (t) = d(φ(t))/dt is the equivalent frequency noise defined as the variation in the instantaneous frequency ωc of the microwave signal. In terms of the Taylor series with respect to Δωc (t)/ω, we can write
| (9) |
By neglecting the higher order terms, denoted by O (), Eq. 9 can be simplified to
| (10) |
For values of |Δωc| which are comparable to or smaller than max {|ω − ωc|}, the second term on the right hand side of Eq. 10 is negligible compared to the maximum variation, due to magnetic resonance, in the first term for typical parameter values for an L-band spectrometer. Therefore, Eq. 10 can be approximated by
| (11) |
For dispersion, an expression equivalent to Eq. 8 can be written as
| (12) |
Approximating Eq. 12 with the first two terms of the Taylor series with respect to Δωc (t)/ω yields,
| (13) |
For values of |Δωc| which are comparable to max {|ω − ωc|}, the second term on the right hand side of Eq. 13 is not negligible when compared to the maximum variation, due to magnetic resonance, in the first term for typical parameter values for an L-band spectrometer. Therefore, Eq. 13 can be approximated by
| (14) |
where constant k1 = 4β0q0/(ω0 (1 + β0)2).
The reflection coefficient affects both magnitude and phase of the reflected microwave signal. The real part Γr generates the in-phase (with respect to the incident microwave phase) component and the imaginary part Γi generates the out-of-phase component of the reflected signal C1. Therefore, we can write,
| (15) |
Here, without the loss of generality, the incident microwave signal is assumed to be of unit peak amplitude.
Phase noise is not the only source of noise present. Other sources of noise, such as noise from the amplifiers, are also present. We represent all other noise sources by an added term z1 (t).
| (16) |
In digital detection, only the sampled version of the signal is available. If the sampling frequency ωs does not meet the Nyquist criteria then the signal C1 is copied at {ωc − Nωs} for all integers N. For a bandpass signal, however, bandpass filtering and a proper selection of ωs ensures that the subsampling does not generate aliasing artifacts, yielding,
| (17) |
where ω̃c = min {|ωc − Nωs|} with N = 0 ± 1 ± 2…, n = mT with m = 0 ± 1 ± 2…, and T is the sampling interval.
To obtain in-phase and out-of-phase baseband signals, the reflected sampled signal C1 is multiplied with the microwave source signal C2 and its Hilbert transform. Like C1, the signal C2 is also bandpass filtered and sampled at ωs. If SI and SQ represent the in-phase and out-of-phase channels, we can write
| (18) |
where z2 [n] represents additive noise in C2, gI [n] represent higher frequency terms, zI [n] represents a composite noise term which is the summation of all terms involving z1 [n] and z2 [n], and φ̃ [n] is the time-delayed version of φ [n], and Δφ [n] = φ̃ [n] − φ [n]. Using truncated power series, Eq. 18 can be approximated by,
| (19) |
Usually Δφ [n] is negligible, especially for time correlated frequency noise, as compared to the k1Δωc [n] term. However, for overcoupling β0 > 1 and undercoupling 0 < β0 < 1, a considerable fraction of microwave energy is reflected back which dwarfs the small variations in the reflected energy due to magnetic resonance. Since ωc ≈ ω0 for systems equipped with AFC, Γr [H0, n] ≫ Γi [H0, n] and . For such cases, the term Γr [H0, n] Δφ [n] sin φ0 may not be negligible and SI [H0, n] becomes,
| (20) |
, where k [n] = k1Δωc [n] + k2Δφ [n] represents the phase noise. We can write an equivalent expression for the out-of-phase channel SQ,
| (21) |
where C̆2 represents the Hilbert transform of C2, gQ [n] and zQ [n] are equivalent to gI [n] and zI [n]. For a phase noise with bandwidth ≪ ω̃c, the microwave phase varies gradually with time, and hence C2 maintains its local fidelity to a sinusoid. Therefore, C̆2 ≈ sin (ω̃cn + φ0 + φ̃ [n]) + z̆2 [n]
In the case of field modulation, with amplitude Hm and frequency ωm, we can write H [n] ≡ H0 + Hm cos ωmn. The process of harmonic extraction is done block-by-block, i.e., the incoming data are broken down to smaller blocks each corresponding to a fixed H0 and the each block is digitally matched filtered with cos (ωmn) and its harmonics. The hth harmonic can be extracted by,
| (22) |
where the summation is performed over each data block. For a large enough block size, the contamination from the gI [n] terms can be neglected. By defining,
| (23) |
the expression for in-phase, (I), and out-of-phase, (Q), harmonics can be simplified as,
| (24) |
Footnotes
Publisher's Disclaimer: This is a PDF file of an unedited manuscript that has been accepted for publication. As a service to our customers we are providing this early version of the manuscript. The manuscript will undergo copyediting, typesetting, and review of the resulting proof before it is published in its final citable form. Please note that during the production process errors may be discovered which could affect the content, and all legal disclaimers that apply to the journal pertain.
References
- 1.Eaton SS, Eaton GR, Berliner LJ, editors. Biomedical EPR, Part A: Free Radicals, Metals, Medicine and Physiology. Kluwer Academic; New York: 2004. [Google Scholar]
- 2.Swartz H. In Vivo EPR (ESR): Theory and Applications. Kluwer Academic; New York: 2003. [Google Scholar]
- 3.Elas M, Bell R, Hleihel D, Barth E, McFaul C, Haney C, Bielanska J, Pustelny K, Ahn K, Pelizzari C, Kocherginsky M, Halpern H. Electron paramagnetic resonance oxygen image hypoxic fraction plus radiation dose strongly correlates with tumor cure in FSa fibrosarcomas. Int J Radiat Oncol Biol Phys. 2008;71:542–549. doi: 10.1016/j.ijrobp.2008.02.022. [DOI] [PMC free article] [PubMed] [Google Scholar]
- 4.Ahmad R, Kuppusamy P. Theory, instrumentation, and applications of electron paramagnetic resonance oximetry. Chem Rev. 2010:3212–3236. doi: 10.1021/cr900396q. [DOI] [PMC free article] [PubMed] [Google Scholar]
- 5.Subramanian S, Krishna M. Dancing with the electrons: time-domain and CW in vivo EPR imaging. Magn Reson Insights. 2008;2:4374. doi: 10.4137/mri.s1131. [DOI] [PMC free article] [PubMed] [Google Scholar]
- 6.Robinson B, Mailer C, Reese A. Linewidth analysis of spin labels in liquids: I. Theory and data analysis. J Magn Reson. 1999;138:199–209. doi: 10.1006/jmre.1999.1737. [DOI] [PubMed] [Google Scholar]
- 7.Sato-Akaba H, Kuwahara Y, Fujii H, Hirata H. Half-life mapping of nitroxyl radicals with three-dimensional electron paramagnetic resonance imaging at an interval of 3.6 seconds. Anal Chem. 2009;81:7501–7506. doi: 10.1021/ac901169g. [DOI] [PubMed] [Google Scholar]
- 8.Joshi J, Ballard J, Rinard G, Quine R, Eaton S, Eaton G. Rapid-scan EPR with triangular scans and Fourier deconvolution to recover the slow-scan spectrum. J Magn Reson. 2005;175:44–51. doi: 10.1016/j.jmr.2005.03.013. [DOI] [PubMed] [Google Scholar]
- 9.Quine R, Rinard G, Eaton S, Eaton G. A pulsed and continuous wave 250 MHz electron paramagnetic resonance spectrometer. Concepts Magn Reson. 2002;15:59–91. doi: 10.1002/cmr.b.21384. [DOI] [PMC free article] [PubMed] [Google Scholar]
- 10.Subramanian S, Matsumoto K, Mitchell J, Krishna M. Radio frequency continuous-wave and time-domain EPR imaging and Overhauser-enhanced magnetic resonance imaging of small animals: instrumental developments and comparison of relative merits for functional imaging. NMR Biomed. 2004;17:263–294. doi: 10.1002/nbm.897. [DOI] [PubMed] [Google Scholar]
- 11.Som S, Potter L, Ahmad R, Kuppusamy P. A parametric approach to spectral-spatial EPR imaging. J Magn Reson. 2007;186:1–10. doi: 10.1016/j.jmr.2006.12.018. [DOI] [PMC free article] [PubMed] [Google Scholar]
- 12.Ahmad R, Vikram D, Clymer B, Potter L, Deng Y, Srinivasan P, Zweier J, Kuppusamy P. Uniform distribution of projection data for improved reconstruction quality of 4D EPR imaging. J Magn Reson. 2007;187:277–287. doi: 10.1016/j.jmr.2007.05.012. [DOI] [PMC free article] [PubMed] [Google Scholar]
- 13.Deng Y, Kuppusamy P, Zweier J. Progressive EPR imaging with adaptive projection acquisition. J Magn Reson. 2005;174:177–187. doi: 10.1016/j.jmr.2005.01.019. [DOI] [PMC free article] [PubMed] [Google Scholar]
- 14.Grinberg O, Smirnov A, Swartz H. High spatial resolution multi-site EPR oximetry: The use of a convolution-based fitting method. J Magn Reson. 2001;152:247–258. doi: 10.1006/jmre.2001.2408. [DOI] [PubMed] [Google Scholar]
- 15.Som S, Potter L, Ahmad R, Vikram D, Kuppusamy P. EPR oximetry in three spatial dimensions using sparse spin distribution. J Magn Reson. 2008;193:210–217. doi: 10.1016/j.jmr.2008.05.004. [DOI] [PMC free article] [PubMed] [Google Scholar]
- 16.Poole C., Jr . Electron Spin Resonance: A Comprehensive Treatise on Experimental Techniques. Dover; Mineola: 1997. [Google Scholar]
- 17.Alecci M, McCallum S, Lurie D. Design and optimization of an automatic frequency control system for a radiofrequency electron paramagnetic resonance spectrometer. J Magn Reson. 1995;117:272–277. [Google Scholar]
- 18.Hyde J, Froncisz W, Kusumi A. Dispersion electron spin resonance with the loop-gap resonator. Rev Sci Instrum. 1982;53:1934–1937. [Google Scholar]
- 19.Hyde J, Mchaourab H, Camenisch T, Ratke J, Cox R, Froncisz W. EPR detection by time-locked sub-sampling. Rev Sci Instrum. 1998;69:2622–2628. [Google Scholar]
- 20.Hyde J, Camenisch T, Ratke J, Strangeway R, Froncisz W. Biomedical EPR, Part B: Methodology, Instrumentation, and Dynamics. Springer; New York: 2004. [Google Scholar]
- 21.Yen S. Master’s thesis. Department of Electrical and Computer Engineering, Ohio State University; 2008. Parametric estimation using electron paramagnetic resonance spectral models of over-modulated Lorentzian absorption and dispersion harmonics. [Google Scholar]
- 22.Tseitlin M, Tseitlin O. Using of digital demodulation of multiharmonic overmodulated EPR signals to improve EPR oximetry reliability. Appl Magn Reson. 2009;36:25–34. [Google Scholar]
- 23.Tseitlin M, Iyudin V, Tseitlin O. Advantages of digital phase-sensitive detection for upgrading an obsolete CW EPR spectrometer. Appl Magn Reson. 2009;35:569–580. [Google Scholar]
- 24.Porat B. A Course in Digital Signal Processing. Wiley; New York: 1996. [Google Scholar]
- 25.Hyde J, Gajdzinski J. EPR automatic frequency control circuit with field effect transistor (FET) microwave amplification. Rev Sci Instrum. 1988;59:1352–1356. [Google Scholar]
- 26.Leugn B. The oversampling technique for analog to digital conversion: A tutorial overview. Analog Integr Circ S. 1991;1:65–74. [Google Scholar]
- 27.Strangeway R, Ishii T, Hyde J. Low-phase-noise Gunn diode oscillator design. IEEE Trans Microwave Theory Tech. 1988;36:792–794. [Google Scholar]
- 28.Rinard G, Quine R, Ghim B, Eaton S, Eaton G. Easily Tunable Crossed-Loop (Bimodal) EPR Resonator. J Magn Reson. 1996;122:50–57. [Google Scholar]
- 29.Tseitlin M, Quine R, Rinard G, Eaton S, Eaton G. Combining absorption and dispersion signals to improve signal-to-noise for rapid-scan EPR imaging. J Magn Reson. 2010;203:305–310. doi: 10.1016/j.jmr.2010.01.013. [DOI] [PMC free article] [PubMed] [Google Scholar]
- 30.Quine R, Eaton G. Setting the microwave phase in an EPR spectrometer. J Magn Reson. 1995;119:268–270. [Google Scholar]
- 31.Deng Y, Pandian R, Ahmad R, Kuppusamy P, Zweier J. Application of magnetic field over-modulation for improved EPR linewidth measurements using probes with Lorentzian lineshape. J Magn Reson. 2006;181:254–261. doi: 10.1016/j.jmr.2006.05.010. [DOI] [PMC free article] [PubMed] [Google Scholar]
- 32.Pandian R, Dang V, Manoharan P, Zweier J, Kuppusamy P. Effect of nitrogen dioxide on the EPR property of lithium octa-n-butoxy 2,3-naphthalocyanine (LiNc-BuO) microcrystals. J Magn Reson. 2006;181:154–61. doi: 10.1016/j.jmr.2006.04.004. [DOI] [PubMed] [Google Scholar]
- 33.Feher G. Sensitivity considerations in microwave paramagnetic resonance absorption techniques. Bell Sys Tech J. 1957;36:449–484. [Google Scholar]
- 34.Vanassche P, Gielen G, Sansen W. A generalized method for computing oscillator phase noise spectra. Proc Int Conf Computer-Aided Design. 2003:247–250. [Google Scholar]
- 35.Krymov V, Gerfen G. Analysis of the tuning and operation of reflection resonator EPR spectrometers. J Magn Reson. 2003;162:466–478. doi: 10.1016/s1090-7807(03)00109-5. [DOI] [PubMed] [Google Scholar]
- 36.Stephens D. Phase-Locked Loops for Wireless Communications: Digital, Analog and Optical Implementations. Kluwer Academic; Norwell: 2002. [Google Scholar]


