

SUMMARY
Hereditary fructose intolerance (HFI) is a potentially fatal inherited metabolic disease caused by a deficiency of aldolase B activity in the liver and kidney. Over 40 disease-causing mutations are known in the protein-coding region of ALDOB. Mutations upstream of the protein-coding portion of ALDOB are reported here for the first time. DNA sequence analysis of 61 HFI patients revealed single base mutations in the promoter, intronic enhancer, and the first exon, which is entirely untranslated. One mutation, g.–132G>A, is located within the promoter at an evolutionarily conserved nucleotide within a transcription factor-binding site. A second mutation, IVS1+1G>C, is at the donor splice site of the first exon. In vitro electrophoretic mobility shift assays show a decrease in nuclear extract-protein binding at the g.–132G>A mutant site. The promoter mutation results in decreased transcription using luciferase reporter plasmids. Analysis of cDNA from cells transfected with plasmids harboring the IVS1+1G>C mutation results in aberrant splicing leading to complete retention of the first intron (~ 5 kb). The IVS1+1G>C splicing mutation results in loss of luciferase activity from a reporter plasmid. These novel mutations in ALDOB represent 2% of alleles in American HFI patients, with IVS1+1G>C representing a significantly higher allele frequency (6%) among HFI patients of Hispanic and African-American ethnicity.
INTRODUCTION
Hereditary fructose intolerance (HFI) [MIM 229600] is a rare and potentially fatal inherited metabolic disease resulting from a deficiency of aldolase B (EC 4.1.2.13) activity in the liver and kidneys (Hers and Joassin 1961). Ingested fructose is metabolized in these tissues where aldolase B is required to cleave fructose-1-phosphate (Fru-1-P). HFI is an autosomal recessive disorder (Froesch et al 1963) that affects approximately 1 in 20,000 individuals (Gitzelmann and Baerlocher 1973; James et al 1996), with a carrier frequency estimated at 1 in 50. It is likely that HFI could be more common as many adults are believed to be living undiagnosed in the population (Cox 1988). Symptoms appear in the newborn following weaning when fructose-containing foods are first introduced. Poor feeding, vomiting, and an overall failure to thrive are common presentations, although many ambiguous symptoms have been reported, all of which make diagnosis a challenge. If undiagnosed, the persistent intake of fructose can lead to liver and kidney failure, coma, and death (Morris 1968; Baerlocher et al 1978; Laméire et al 1978; Odièvre et al 1978; Cox 1993; Steinmann et al 2001). An accurate early diagnosis and the exclusion of fructose from the diet are key in alleviating symptoms and preventing morbidity. It is estimated that Americans consume 100 g of this sugar daily (Yudkin et al 1980; Anderson 1982) (http://www.ers.usda.gov/Briefing/Sugar/data.htm#yearbook). For this reason, a diet free from fructose can remain difficult.
Clinical diagnosis of HFI can be made by two methods: either the direct assay of aldolase B activity taken from a liver biopsy of a suspected patient, or by an intravenous (I.V.) fructose challenge (Laméire et al 1978; Steinmann and Gitzelmann 1981). Both of these tests are invasive, carry significant risk, and can cause uncomfortable side effects. Less invasive methods to diagnose HFI include whole-gene sequencing or allele-specific oligonucleotide (ASO) hybridization analysis that requires only a small blood sample (Tolan and Brooks 1992; Coffee et al 2009), and requires knowledge of HFI mutations. Of the known HFI-causing mutations, seven are common and make up 82% of HFI alleles worldwide. Private mutations account for 7%, and over 10% of HFI alleles still remain unknown (Coffee et al 2009). However, in the American HFI population, the percentage of unknown alleles was reported at over 33% (Coffee et al 2009). Furthermore, the percentage of unknown mutations is even higher in non-Caucasian populations, such as Hispanic and African-American populations (nearly 60%). The implementation of a more accurate diagnostic DNA-based genetic screen would benefit from the identification of additional common HFI alleles.
Over 40 mutations have been identified in the aldolase B gene (start of transcription defined by UCSC genome browser as location: chr9:104,198,062) that result in loss of enzyme activity and and HFI (http://www.bu.edu/aldolase/HFI/hfidb/hfidb.html). These include missense mutations, nonsense mutations, splicing mutations, insertions and deletions (ranging from 1–1600 bp). All mutations identified thus far are located in the protein-coding sequence of ALDOB (exons 2–9). It is well documented that mutations in non-coding regions of a gene can result in disease (Crossley and Brownlee 1990; Sakai et al 1991; Koivisto et al 1994; Perez-Tur et al 1995). Stretches of DNA that contain conserved transcription-factor binding sites, such as within the promoter and other regulatory regions, and splice junctions, while not present in the final protein, can nevertheless adversely affect gene transcription and protein biosynthesis.
Recent enumeration of HFI alleles in the American HFI population found that the seven most common mutations in ALDOB account for 65% of HFI alleles, with over a third of the mutations in ALDOB responsible for causing HFI in American patients remain unknown (Coffee et al 2009). The identification of novel mutations in unique regions would help to further define the mutational spectrum of HFI. It was recognized that the non-coding regions of ALDOB, including the promoter, intronic enhancer, and untranslated first exon, had not been investigated as a potential site for HFI-causing mutations. Therefore, DNA sequence analysis of the aforementioned regions was performed in a cohort of clinically diagnosed American HFI patients to uncover novel mutations in 5′-region of ALDOB that underlie the HFI phenotype. Identification and characterization of two novel mutations in these regions that impaired transcription or splicing are reported, with the latter being common among Hispanic and African-American HFI patients.
SUBJECTS AND METHODS
Subjects
DNA was isolated from peripheral leukocytes in 38 HFI patients who were diagnosed by low aldolase B activity in liver biopsy samples, diagnostic response to intravenous (I.V.) fructose challenge, the identification of one HFI allele combined with clinical symptoms, and/or patients of Hispanic descent with typical dietary and clinical histories consistent with HFI. A follow-up analysis by ASO hybridization analysis (see below) was performed on leukocyte DNA from an additional group of suspected patients with one or more symptoms suggestive of HFI.
The specific genotypes of six probands are reported. Patient-34 was diagnosed with HFI by liver biopsy. Patient-50 presented at 1.5 years of age and was diagnosed with HFI by liver biopsy. Patient-249 was a female who presented at six months of age with failure to thrive and fructosemia. Patient-278 presented at three years of age with neonatal giant cell hepatitis of unknown etiology, and was diagnosed with HFI by liver biopsy. Patient-284 was a male who presented at five months of age with lactic acidosis, and was diagnosed with HFI by identification of one HFI allele. Patient-295 was a female who presented at seven months with liver failure following Pedialyte treatment for diarrhea and dehydration, and was diagnosed by identification of one HFI allele and successful exclusion of dietary fructose. This study was approved by the Institutional Review Board and informed consent was obtained from all subjects or their guardians.
Allele-specific oligonucleotide (ASO) Hybridization
Plasmids containing DNA inserts with either wild-type or mutant alleles were constructed from genotyped patient genomic DNA as controls for ASO screening. Each DNA insert was amplified by PCR and cloned into TOPO TA (Invitrogen). All control clones were confirmed by DNA sequencing. Amplified genomic DNA from patient samples and plasmid DNA from control clones (100 ng) were denatured and applied to a Zeta-Probe® GT nylon membrane (Bio-Rad). Blots were used for ASO hybridization analysis for A149P, A174D, N334K, R59Op, Δ4E4, A337V, and L256P as described previously (Coffee et al 2009). For new alleles, ASO probes for wild-type (g.–132wt 5′-ATTTTAAGGACTGGTTG-3′ and IVS1+1wt 5′-CCCAAACTGTAAGTAAA-3′) and mutant alleles (g.–132G>A 5′-ATTTTAAGAACTGGTTG-3′ and IVS1+1G>C 5′-CCCAAACTCTAAGTAAA-3′) were used. High stringency washes were performed at the following discriminatory temperatures: g.–132wt at 54 °C, g.–132G>A at 52 °C, IVS1+1wt at 58 °C, and IVS1+1G>C at 56 °C.
DNA Sequence Determination
Genomic DNA was extracted from leukocytes isolated from whole blood as described previously (Orkin et al 1978). A 982 bp fragment containing the ALDOB proximal promoter and exon 1 was amplified by PCR (Saiki et al 1985) using sense and antisense primers (50 μM) 5′-ACTGCGTACAGACACTATACAAC-3′ and 5′-CATAAGGCAGTAGATATGTA-3′, respectively. PCR was carried out in a buffer containing 16 mM (NH4)2SO4, 67 mM Tris-HCl, pH 8.8, 200 μM dNTPs, 2 mM MgCl2, and 5 U/ml of Taq polymerase. Cycling conditions were as follows: 94 °C for 1.5 min; 60 °C for 1 min; 72 °C for 1 min, repeated for five cycles; 94 °C for 1.5 min, 60 °C for 1 min; 72 °C for 3 min, repeated for 25 cycles; 72 °C for 10 min; hold at 4 °C. A 1.2 kb fragment containing the ALDOB intronic enhancer was amplified similarly by PCR using sense and antisense primers 5′-TAGGATGTAACTTGCAATCC-3′ and 5′-CTGCTCATTGTAGTTGCTCA-3′, respectively. ALDOB exons 2–9 were PCR-amplified as previously described (Coffee et al 2009).
Each PCR product was purified using the NucleoSpin® Extract II silica-membrane columns (Macherey-Nagel) as per manufacturer’s instructions. DNA (0.5 μg) was submitted for sequence determination (≥3 independent times) (GENEWIZ, Inc., South Plainfield, NJ) using several internal primers to ensure overlapping reads along both strands. Sequence results were analyzed using Sequencher® 4.9 software (Gene Codes Corporation).
Plasmid Construction
The pGL3-basic luciferase reporter plasmid (Promega) was used for generation of reporter plasmids for in vivo studies of expression, and the pcDNA3.1(−) mammalian expression plasmid (Invitrogen) was used for studies of splicing. Genomic DNA from non-HFI subjects was used as a template for PCR amplification of a 2,798 bp region from position −264 to +2534. This included the promoter (264 bp), the first exon (72 bp), and part of the first intron (2,462 bp). Primers were designed with 5′ extensions containing Xma I restriction sites for cloning into pGL3-basic at an Xma I site upstream of the luciferase open reading frame. Additionally, a 96-bp fragment from position +4795 to +4890 containing 87 bp upstream of exon 2 and the first nine bases of exon 2 was PCR-amplified from wild type genomic DNA. These primers were designed with 5′ extensions containing Bgl II restriction sites for cloning into pGL3-basic at a Bgl II site between the Xma I site and the luciferase open reading frame. This luciferase reporter plasmid, pProm2, contained a total of 2,893 bp of wild type ALDOB sequence.
Wild type ALDOB sequence was subcloned into the EcoR I, EcoR V, and BamH I sites of pcDNA3.1(−) mammalian expression vector (Invitrogen) for analysis of the splicing mutation. A 1.4 kb EcoR V/EcoR I fragment was isolated from pEE313 (Tolan and Penhoet 1986). A 3.5 kb EcoR I/BamH I fragment was isolated from pBE313 (Tolan and Penhoet 1986). Both fragments were cloned adjacently into pcDNA3.1(−) resulting in the wild type plasmid, pSplice_wt. The point mutations at g. 132 and IVS1+1 were introduced into pProm2 and pSplice_wt, respectively, using the QuikChange® Site-Directed Mutagenesis Kit (Stratagene) with primers containing 30–34 complementary bases producing p–132G>A and pSplice_mut, respectively.
The luciferase gene was PCR-amplified from pGL3-basic using a forward primer with a 5′ extension containing a BamH I restriction site enabling cloning in frame with the ALDOB translation start codon and a reverse primer complementary to pGL3-basic sequence downstream of a BamH I restriction site in the vector. The 1.8 kb BamH I fragment was cloned into pSplice_mut creating the plasmid pMut_Luc. Sub-cloning a fragment containing the wild-type splice sequence of exon 1 from pSplice_wt into pMut_Luc created the plasmid pWt_Luc. The correct construction of all plasmids was confirmed by DNA sequencing.
Transient Transfection
Human kidney-derived A293 cells were grown in DMEM (Invitrogen) supplemented with 10% fetal bovine serum (FBS) (Invitrogen), 100 U (60 μg) of penicillin, and 100 μg of streptomycin (Invitrogen) at 37 °C with 5% CO2. Cells were seeded in 6-well tissue culture plates and transfected in triplicate when they reached approximately 30% confluence. The media was replaced and DNA was mixed with polyethylenimine (PEI) (1 μg/μl, pH 7.2) (Polysciences Inc, Warrington, PA) at a ratio of 1μg DNA:3μl PEI and added to an aliquot of serum-free media. This DNA mixture was incubated at room temperature for 15 min and then added to the cells. Cells were harvested after 42–48 h.
Reporter Assay
Luciferase activity in transfected A293 cells was measured using the Luciferase Assay System (Promega). Briefly, media was removed and cells were rinsed with phosphate-buffered saline. Reporter Lysis Buffer (Promega) was added to each well and cells were gently scraped and collected. Cells were lysed by freeze thaw, vortexed briefly, and centrifuged for 3 min at 20,800 × g at 4 °C. Supernatant fractions were collected and transferred to a new tube. Luciferase activity was determined by adding 100 μl of Luciferase Reagent (Promega) to 20 μl of cell extract and luminescence was measured for 10 s in a 20/20n Luminometer (Turner BioSystems). Transfection efficiency was measured by adding 20 μl of cell extract to a final volume of 135 μl in a reaction containing 122.5 mM sodium phosphate, pH 7.5, 3 mM O-nitrophenyl-β-D-galactopyranoside, 1.1 mM MgCl2, and 53 mM β-mercaptoethanol and incubated at 37 °C until reactions became yellow. The reactions were stopped by the addition of Na2CO3 to 644 mM and absorbance values were measured at 415 nm. Luciferase values were normalized to transfection levels determined by β galactosidase expression. Error calculated by either standard error of the mean (SEM) from two to four trials as noted. Unpaired Student’s t-test was performed to determine p values.
Preparation of Nuclear Extracts
Human liver-derived HepG2 cells were grown to confluency and cells were collected and resuspended in 0.4 ml of Buffer E (10 mM HEPES, pH 7.9, 10 mM KCl, 0.1 mM EDTA, 0.1 mM EGTA, 1 mM DTT, 1 mM PMSF, and 1 μg/ml pepstatin A). After 10 min at 4 °C, 5% (v/v) NP-40 was added to 0.6%, cells were vortexed briefly, incubated at 4 °C for 15 min, and centrifuged for 30 s at 20,800 × g. The cytoplasm-containing supernatant fraction was removed and the nuclear pellet was resuspended in 0.1 ml of Buffer E and centrifugation was repeated. The pellet was resuspended in 0.1 ml of 20 mM HEPES, pH 7.9, 400 mM NaCl, 1 mM EDTA, 1 mM EGTA, 1 mM DTT, 1 mM PMSF, and 1 μg/ml pepstatin A. Nuclei were vortexed and incubated for 45 min with gentle rocking at 4 °C. The sample was centrifuged for 10 min at 20,800 × g at 4 °C. The supernatant fraction was transferred to a new tube, supplemented with glycerol to a final concentration of 20% (v/v), aliquoted, and stored at −80 °C.
An expression plasmid that contained human C/EBPα cloned into pcDNA3 (Invitrogen) was used for in vitro translation (kind gift from Dr. Geoffrey Cooper). The TNT® Coupled Wheat Germ Extract System (Promega) was used with T7 RNA polymerase to transcribe and translate C/EBP in vitro.
Electrophoretic Mobility Shift Assay (EMSA)
DNA fragments of 24 bp corresponding to the ALDOB promoter from position −144 to −121 relative to the start of transcription were synthesized (Eurofins MWG Operon, Huntsville, AL) with either wild-type sequence or the point mutant at position −132. Complementary oligonucleotides (1 nmol) were annealed by incubating at 95 °C for 10 min and allowed to cool overnight in 10 mM Tris, pH 7.6, 10 mM NaCl, 2 mM MgCl2, and 0.1 mM EDTA. Annealed probes were radioactively labeled at the 5′-end by incubation with γ-[32P ]-ATP and T4 polynucleotide kinase (New England Biolabs) at 37 °C and purified from unincorporated ATP by a Bio-Gel® P-6 DG (Bio-Rad) column. DNA-binding reactions contained 5 μg of nuclear extract, 1 μg poly dI:dC (Sigma), 1 μg BSA (NEB), and 2 × 10⁶ cpm of radiolabelled ALDOB promoter probes in 50 mM Tris, pH 7.4, 250 mM NaCl, 5 mM DTT, 5 mM EDTA, and 20% (w/v) glycerol. Samples were incubated at room temperature for 40 min. DNA-protein complexes were resolved on 5% polyacrylamide gels in 25 mM Tris, 0.19 M glycine, 1 mM EDTA, and 2.5% (v/v) glycerol run at 25 mA at room temperature. Gels were dried for 60 min at 80 °C prior to autoradiography. Relative binding was quantified using ImageJ software (Abramoff et al 2004).
RNA Extraction and cDNA Synthesis
Total RNA was extracted using TRIzol® Reagent (Invitrogen). RNA (5 μg) was incubated with 2 nM poly(T) primer at 70 °C for 5 min and immediately cooled on ice. M-MLV reverse transcriptase (200 U) (Promega), dNTPs (10 mM), and RNasin® (25 U) (Promega) were incubated in 5x M-MLV reaction buffer (Promega) for 2 h at 42 °C. PCR was performed with 5 μl of this cDNA reaction using the T7 primer (5′-TAATACGACTCACTATAGGG-3′), a reverse primer (5′-TCAGCGGTTTAAACTTAAGC-3′), and 2 mM MgCl2 under the following cycling conditions: 94 °C for 4 min; (94 °C for 30 sec; 60 °C for 30 sec; 72 °C for 2 min) repeat for thirty cycles; hold at 4 °C. PCR products were visualized on agarose gels stained with ethidium bromide.
Southern Blot Hybridization
DNA was separated on 1.5% TAE agarose gel and transferred to a nylon membrane under conditions previously described (Tolan and Penhoet 1986). The membrane was incubated in a buffer containing 5x SSC, 20 mM NaH2PO4, pH 7.2, 1 mM EDTA, 7% (w/v) SDS, and 10X Denhardt’s (Ficoll:polyvinylpyrrolidone:BSA (2g each/L)) for 1 h at 37 °C in a rotating hybridization oven. A radiolabeled probe (splice junction 5′-TCCCAAACTATGGCCCAC-3′, exon 1 5′-ACTCTTCTCTCCCAAACT -3′, or exon 2 5′-GGCAATTTCTGAAGAGCT-3′) was added and hybridization proceeded overnight at 37 °C. Blots probed with oligonucleotides for the splice junction, exon 1, and exon 2 were washed with 5x SSC and 0.1% (w/v) SDS at 37 °C, 52°C, and 45 °C, respectively, and autoradiography was performed.
RESULTS
DNA Sequence Analysis
Recent enumeration of HFI alleles in 153 American patients with 268 independent alleles using ASO hybridization showed that seven known mutations (A149P, A174D, N334K, A337V, Δ4E4, R59Op, and L256P) found in exons 5, 9, 4, 3, and 7, respectively, accounted for 65% of the HFI alleles in this group (Coffee et al 2009). Following analysis for these seven mutations, 57 patients remained incompletely genotyped. A 38-patient subset harboring 58 unknown alleles were investigated for mutations at the 5′ end of ALDOB. These patients were diagnosed with HFI by low aldolase B activity in liver biopsy samples, diagnostic response to I.V. fructose challenge, the identification of one HFI allele combined with clinical symptoms, and/or patients of Hispanic descent with dietary histories suggestive of HFI.
Identification of novel and perhaps common mutations in this cohort of patients was accomplished by DNA sequence analysis of the promoter, the first exon, and the intronic enhancer of ALDOB (all non protein-coding regions). Sequence determination of a 981 bp fragment containing both the ALDOB proximal promoter and first exon revealed three mutations (Figure 1). In the promoter, one mutation was identified in a Patient-50 at an evolutionarily conserved site (Berardini et al 1999). The mutation, a G>A transition at position −132 relative to the start of transcription (Berardini et al 1999) was termed g.–132G>A. The location of this mutation was within a protein-binding site identified by DNase footprinting analysis (Tsutsumi et al 1989; Raymondjean et al 1991). A second mutation, a T>A transversion at position − 129 in the promoter was identified in six patients (not shown in Figure 1). This mutation was the same as a known single nucleotide polymorphism (SNP) found in 18% of Caucasian alleles (SNP rs12337537) (http://www.ncbi.nlm.nih.gov/SNP/). A third mutation was identified in two patients (Patients-278 and -295) at the first nucleotide of intron 1 (the donor splice site of exon 1). This mutation was termed IVS1+1G>C. The relative locations of the two potential HFI mutations are shown in Figure 2. A second PCR-amplified product from each of the three patients was cloned and DNA sequencing confirmed the variant.
Figure 1. DNA sequence analysis reveals novel mutations in the 5′-UTR of ALDOB.
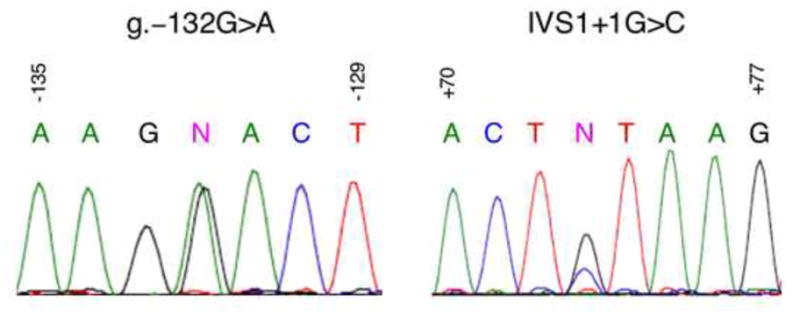
Left, DNA sequence analysis of a 981 bp fragment of the 5′-end of ALDOB performed with the primer 5′-AGCTGTATGACTTAAGGGAACCTCC-3′ revealed a mutation at position −132 in patient 50, indicated by an (N). Right, DNA sequence analysis of a similar fragment from patient 295 performed with the primer 5′-ATCAATCTTGGGCATTTTGCCACCT-3′ revealed a mutation at position IVS1+1, indicated by an (N). The corresponding nucleotide sequence is written above each peak with G (black), A (green), T (red), and C (blue) in corresponding colors.
Figure 2. The DNA sequence of the ALDOB promoter region.

The sequence of human ALDOB from position −246 to +85 is shown with exon 1 capitalized. The start of transcription is indicated with a forward arrow at position +1. Nucleotides within the promoter that are conserved across vertebrates are indicated with an asterisk (*). The boxed sequence represents the TATA box. DNA sequences containing known and proposed cis-elements and their corresponding transcription factors are denoted with brackets under the sequence. Known single nucleotide polymorphisms are indicated with an inverted carrot (v) (from 5′ to 3′: SNP rs35386088, rs12337537, rs17551011, and rs71866381 as defined by NCBI). The novel mutations are indicated with upward arrows showing the nucleotide change.
Analysis of the enhancer sequence in the first intron revealed four mutations at positions IVS1+214, IVS1+1873, IVS1+1887, and IVS1+2379. Three of these were among known SNPs in this region; IVS1+214 (SNP id: rs515313) found in 20–50% of alleles, IVS1+1887 (rs970385) found in 40% of alleles, and IVS1+2379 (rs285470) found in 40–50% of alleles. These nucleotide changes were not characterized further.
Having no definitive clinical diagnosis, but strong indications provided by dietary history, including improved health after the successful exclusion of dietary fructose, 23 additional suspected HFI patients were screened by ASO hybridization analysis for the two novel promoter-region mutations, g.–132G>A and IVS1+1G>C. A 411 bp DNA fragment containing the promoter and first exon was amplified from genomic DNA. Control clones were generated containing fragments of both wild type (g.–132 and IVS1+1) and mutant (g.–132G>A and IVS1+1G>C) sequence amplified from genomic DNA from Patients-50 and -295. The ASO screen identified a third patient with the g.-132G>A promoter mutation (Patient-34) and two additional patients with the IVS1+1G>C splice-site mutation (Patients-249 and -284) (data not shown). The six HFI probands identified with these mutations in the promoter and first exon including method of diagnosis, ethnic background, and the genotypes are listed in Table 1. Further sequence analysis of all protein-coding regions in the six patients did not uncover any additional mutations. Therefore, the classification of g.–132G>A and IVS1+1G>C as HFI-causing alleles was supported by the genetic evidence. To determine whether either of the mutations were common polymorphisms found in the general population, an ASO screen was performed on non-HFI affected samples from various ethnic populations (15 Caucasians, 12 African-Americans, 12 Asians, and 12 Hispanics). The results showed that none of these 51 non-HFI affected individuals were positive for these mutations, indicating they are not common polymorphisms found in the general population and further supporting their classification as HFI mutations (data not shown).
Table 1.
HFI Patient Genotypes
| Patient | Diagnosisa | Ethnicity/Race | Nationality | Methodb | HFI Genotype |
|---|---|---|---|---|---|
| 50 | DNA | Non-Hispanic/Caucasian | American | DNA | g.–132G>C/A149Pc |
| 34 | liver biopsy | Non-Hispanic/Caucasian | German | ASO | g.–132G>C/?d |
| 278 | liver biopsy | Hispanic/Caucasian | American | DNA | IVS1+1G>C/R59Op |
| 295 | DNA | Hispanic/Black | American | DNA | IVS1+1G>C/Δ4E4 |
| 284 | DNA | Non-Hispanic/Black | American | ASO | IVS1+1G>C/N334K |
| 249 | DNA | Hispanic/Caucasian | American | ASO | IVS1+1G>C/? |
liver biopsy means enzymatic analysis; DNA means molecular genetic diagnosis from blood.
method used in this study for identification of mutations in the 5′-end of ALDOB;
Allele nomenclature given as first reported in the literature; see Table 4 for recommended nomenclatures (http://www.hgvs.org/rec.html).
unknown HFI allele.
In vitro EMSA Analysis of the Promoter Mutant g.–132G>A
DNase footprinting analysis using rat liver nuclear extracts identified a protein binding site at −162 to −142 (Tsutsumi et al 1989; Raymondjean et al 1991). Based on alignment with rat DNA sequence (Berardini et al 1999), the human nucleotide at position −132 lies within this binding site. The location of the g.–132G>A mutation at a conserved site in the ALDOB promoter suggests a role for this sequence in transcription factor binding (Figure 2). A SNP has been identified at position −129, at an evolutionarily conserved site three nucleotides downstream of −132 within the same protein-binding site(s). This SNP has no known clinical significance. It was necessary, therefore, to establish what clinical significance, if any, a single nucleotide change at position −132 would have on transcription. The effect of the G>A transition at position −132 on protein binding ability was measured by electrophoretic mobility shift assay (EMSA) using HepG2 and A293 nuclear extracts. Wild-type and mutant probes were radiolableled for EMSA analysis. The mutant probe showed a decrease in protein binding as compared to wild type using nuclear extracts from both HepG2 and A293 cells (Figure 3). The g.–132G>A mutation resulted in an approximate 3-fold decrease (2.8±1.1). This result was confirmed by competition experiments (Figure 3) where approximately 2 to 3-fold more cold mutant competitor was needed to show similar binding. While it has been reported that position −162 to −142 in the rat ALDOB promoter (which shares 72% sequence identity to human ALDOB promoter −146 to −124 (Berardini et al 1999)) is a C/EBP binding site (Raymondjean et al 1991), in vitro translated C/EBP failed to produce binding to either wild type or mutant probes (data not shown).
Figure 3. In vitro EMSA analysis.

Panel A, Nuclear extract (10 μg) prepared from A293 cells was incubated with radiolabelled DNA probes that contained either wild type sequence or g.–132G>A mutant sequence (2 × 10⁵ cpm) indicated at the top. Indicated at the bottom, lanes 1 and 6 contained no nuclear extract. Lanes 2 and 7 contained 0.1 pmole of the labeled oligo. Lanes 3 & 8 and 4 & 9 contained 100x and 200x the amount of cold oligo, respectively. Lanes 5 and 10 contained 100x cold non-self competition. Panel B, same as panel A except using nuclear extract from HepG2 cells. Panel C, HepG2 nuclear extract (5 μg) was incubated with 0.04 pmoles (~1.5 × 10⁵ cpm) of radiolabeled wild type oligo as indicated at top. Lane 1 contained no nuclear extract. Lane 2 contained nuclear extract. Lanes 3–10 were incubated with 10x, 25x, 50x, and 100x amounts of the indicated cold oligo. Autoradiography was performed at −90 °C for 16–20 h.
In vivo Reporter Analysis of the Promoter Mutant g.–132G>A
Given the modest 2-fold effect on nuclear factor binding, the promoter mutant, g.–132G>A, was further assessed for its effect on transcription using a luciferase reporter assay. A reporter plasmid, pProm2, was made that contained 2,798 bp of ALDOB sequence from −264 to +2534. The G>A point mutant at position −132 was introduced by site-directed mutagenesis. Human kidney-derived A293 cells, which are more efficiently transfected than HepG2 cells (data not shown) were transfected with 1 μg of either wild type ALDOB promoter plasmid (pProm2) or mutant ALDOB promoter plasmid (p-132G>A), plus 1 μg of a β-galactosidase transfection control plasmid (pRSV-β-gal). Kidney cells express aldolase B at the same levels as liver (Funari et al 2010). Luciferase activity was measured and normalized to the transfection efficiencies determined by a β-galactosidase assay. As seen in Table 2, wild type ALDOB promoter sequence showed an approximate 3-fold increase in expression of luciferase as compared to a negative control, which is consistent with previous studies (Gregori et al 1991). The g.–132G>A mutation caused a significant (p<0.0001) decrease in luciferase expression, which was not significantly different from the negative control (p=0.3). These studies confirmed that g.–132G>A leads to loss of aldolase B activity due to a loss of transcription from the ALDOB promoter.
Table 2.
Luciferase Activity of the ALDOB-Promoter Mutant g.–132G>A
| Plasmid | Luciferase Activitya | error |
|---|---|---|
| pGL3-basic | 23 | ±4 |
| pProm2 | 100 | ±9 |
| p-132G>A | 30 | ±5 |
The ratio of luciferase activity to β-galactosidase activity was averaged for reactions done in triplicate. The level of relative luciferase activity for pProm2 (average of two trials was 6000) was normalized to 100. Calculated error was from two to four trials as reported as ±SEM.
Analysis of Splicing Mutant by RT-PCR
Mutations occurring at both donor and acceptor splice sites in ALDOB have been found in HFI patients (Cross and Cox 1990; Brooks et al 1991; Ali et al 1994; Ali et al 1996; Esposito et al 2004; Santer et al 2005). While these studies hypothesize that these mutations affect ALDOB expression at the mRNA level, demonstration of the splicing defect is rarely reported. However, because exon 1 is entirely 5′-UTR, knowing the effect of splicing mutations is particularly important. While exon 1 is not included in the final protein, correct splicing at this site is nevertheless required to remove the large first intron (4.8 kb) such that the correct translational start codon in exon 2 is used. In the absence of a wild type consensus donor splice site at the end of exon 1, two consequences could result. One outcome is the use of a downstream cryptic splice site in intron 1 that splices to exon 2, inserting a sequence from intron 1 into the 5′-UTR. If the insert did not contain an ATG sequence, the translational start codon in exon 2 would be used with no effect on ALDOB expression. If the insert contained a start codon that falls in frame with the aldolase B open reading frame (ORF), and in the absence of a premature stop codon, extra amino acids would be added at the amino-terminal end of the protein, likely not disrupting function (Doyle and Tolan 1995; Malay et al 2002). However, if the insert had a start codon that fell out of frame with the ORF, a nonfunctional protein would result. The second possibility is in lieu of splicing at a cryptic donor site, complete retention of the entire first intron (adding a 4,800 bp insertion in the 5′-UTR) could occur. This would result in no aldolase B expression unless there were use of an internal ribosome binding site. Multiple potential ATG start codons lie within this 4.8 kb sequence, and all fall in frame with downstream premature stop codons. Translation from the first ATG in this mRNA would result in a short polypeptide, and would likely induce nonsense-mediated mRNA decay (McGlincy and Smith 2008; Silva and Romao 2009). With multiple possible effects on the protein, ranging from negligible to deleterious, the determination of the effect the IVS1+1G>C mutation has on the transcript was imperative.
An expression plasmid that contained 4.9 kb of ALDOB DNA sequence from position +42 to +4940 was constructed, pSplice_wt, by subcloning from plasmids containing wild type DNA sequence. The IVS1+1G>C point mutant was introduced by site-directed mutagenesis generating the plasmid pSplice_mut. The effect of the IVS1+1G>C mutation on splicing was investigated by transient transfection of A293 cells with wild type and mutant plasmids, followed by extraction of total RNA, and cDNA synthesis. PCR amplification of cDNA from cells transfected with pSplice_wt produced a transcript indicative of correct splicing (248 bp), while cells transfected with pSplice_mut produced a transcript of greater than 5 kb, indicating complete retention of the first intron (Figure 4). This mutant product was similar in size to a non-transfected unspliced control plasmid.
Figure 4. IVS1+1G>C splicing mutant causes intron retention.

A293 cells were transfected with 5 μg of either wild type plasmid (pSplice_wt) or IVS1+1G>C mutant plasmid (pSplice_mut). After 40–48 h, total RNA was extracted and RT-PCR was performed. Transcript size was analyzed by PCR analysis and visualized on a DNA agarose gel used for Southern Blot. Panel A: PCR-amplified cDNA from cells transfected with wild type plasmid (Lane 1) and IVS1+1G>C mutant plasmid (Lane 2). The DNA was transferred to a nylon membrane and probed with oligonucleotides complementary to the splice junction (Panel B), exon 1 (Panel C), and exon 2 (Panel D). Blots were exposed for autoradiography at −90 °C for 3 h, 8 h, and 16 h, respectively. On the left, the lower arrow indicates the position of migration of a 248 bp product expected for a correctly spliced PCR-amplified cDNA synthesized from the pSplice_wt. The upper arrow indicates the position of migration of a >5.0 kb product expected for a PCR-amplified cDNA synthesized from pSplice_mut without splicing.
Further investigation of the transcripts made from these ALDOB plasmids utilized Southern blot hybridization using radiolabeled oligonucleotides that spanned the splice junction between exon 1 and exon 2. Only PCR-amplified cDNA from cells transfected with pSplice_wt annealed to this probe, indicating normal splicing took place. Moreover, normal splicing did not take place from the pSplice_mut (Figure 4). However, radiolabeled oligonucleotides specific to either exon 1 or exon 2 showed that the large PCR-amplified cDNA of pSplice_mut transfected cells was specific to ALDOB (Figure 4). Both probes hybridized specifically to this >5.0 kb fragment, consistent with the retention of the entire first intron. Additional smaller PCR-amplified products from cells transfected with pSplice_wt hybridized to both the exon 1 and exon 2 probes indicating the presence of smaller alternatively spliced transcripts. These transcripts have been observed in various rare ESTs (eg., Accession number BJ994276).
While RT-PCR and Southern hybridization indicated that the IVS1+1G>C splice site mutation causes retention of the first intron, it was necessary to discern whether it was still possible that this transcript could be used for translation resulting in production of aldolase B via an internal ribosome entry site (Lopez-Lastra et al 2005). The luciferase gene was cloned downstream of ALDOB and in frame with the ALDOB ATG translation initiation codon in both pSplice_wt and pSplice_mut, generating the plasmids pWt_Luc and pMut_Luc, respectively. Human kidney-derived A293 cells were transfected with 1 μg of pWt_Luc or pMut_Luc and 1 μg of pRSV-β-gal, and luciferase activity was measured and normalized as described above. Unlike the previous wild type ALDOB plasmid (pProm2), pWt_Luc is under the control of a CMV promoter to maximize expression. As seen in Table 3, luciferase expression from pWt_Luc indicated normal splicing followed by successful translation of the protein occurred. On the contrary, pMut_Luc containing the IVS1+1G>C mutant splice site showed luciferase expression that was not significantly different than the negative control. These studies confirmed that the IVS1+1G>C mutation at the exon 1 donor splice site leads to loss of ALDOB expression due to intron retention.
Table 3.
Test of Internal Ribosome Binding Site in Transcripts from ALDOB-splicing Mutant IVS1+1G>C
| Plasmid | Luciferase Activitya | error |
|---|---|---|
| pGL3-basic | 100 | ±11 |
| pWt_Luc | 58000 | ±2600 |
| pMut_Luc | 100 | ±21 |
Luciferase assays for transfected A293 cell extracts were normalized to β-gal assays (transfection control) and the ratios normalized to the negative control (pGL3-basic) (average of the two trials was 254000) set to 100. Calculated error was from two trials as reported as ± SEM.
DISCUSSION
Two novel mutations in the non-coding sequence of ALDOB in HFI patients were identified and characterized to show that each leads to loss of ALDOB expression. While numerous ALDOB mutations have been identified throughout the protein-coding sequence, this is the first description of mutations occurring in the promoter region that ultimately lead to a loss of aldolase B activity.
Significant work has been performed towards uncovering the transcriptional regulation of the aldolase B gene. The ALDOB proximal promoter is approximately 200 bp in length and contains binding sites for a number of ubiquitous and tissue-specific transcription factors that are required for transcription in hepatocytes and renal cells. In addition to the promoter, transcription of ALDOB requires an enhancer located within the first intron (Gregori et al 1998). Studies using the ALDOB-promoter constructs have shown that it is tissue-specific, but a relatively weak promoter (Gregori et al 1991). The cis-elements and their trans-factors involved in ALDOB regulation have been studied in rat, but remain ill-defined. Binding sites for NFY, HNF1, and HNF3 (see Figure 2) were identified by EMSA analysis and transient transfection assays (Raymondjean et al 1991; Gregori et al 1993; 1994; Vallet et al 1995). The least well-defined transcription factor binding site is within the promoter at position −144 to −127; the region containing the HFI mutation. While DNase footprinting analysis clearly indicated protein(s) binding to this sequence, those factor(s) binding have not been clearly identified. Previous reports have suggested that this region from −144 to −127 could encompass the binding site for C/EBP, DBP, or A1F-C (Gregori et al 1991; Yabuki et al 1993; Berardini et al 1999), but clear demonstration that any of these transcription factors binding to this site is lacking. Sequence alignment of the ALDOB promoter between rat and human showed that this region (−144 to −127) had less conservation (72% identity) compared to other cis-elements (−120 to −111;89% identity and −110 to −85;92% identity), which bind to NFY and HNF1/3, respectively (Berardini et al 1999). Nevertheless, this new promoter mutation at g.–132 occurred at a conserved and clearly important position.
While mutations in promoters of other genes at known transcription-factor binding sites have been identified that result in a disease phenotype (Crossley and Brownlee 1990; Sakai et al 1991; Koivisto et al 1994; Park et al 2009), the ALDOB promoter has not previously been investigated. The novel g.–132G>A mutation causes a decrease in expression from a reporter plasmid likely due to a disrupted transcription factor binding site as determined by EMSA analysis.
While the first exon of ALDOB is not translated, it still plays a role in proper transcript formation. Splice sites at both the donor and acceptor position are highly conserved, and mutations in these consensus sequences can alter splicing and cause disease (Faustino and Cooper 2003). One report estimates that of all point mutants responsible for causing disease, 15% of them are splicing mutations (Krawczak et al 1992). When a consensus splice site is mutated, one possible consequence is that an intron is not appropriately excised and the sequence can remain in the final mRNA transcript causing insertion of amino acids. Besides the addition of unwanted amino acids, another result of intron retention is the induction of nonsense-mediated mRNA decay (McGlincy and Smith, 2008; Silva and Romao, 2009). The machinery can detect when shorter than normal transcripts are being produced, recognize the insertion of a premature stop codon, and can target the mRNA for degradation ensuring no protein is synthesized. It is possible that retention of the first intron caused by IVS1+1G>C induces nonsense-mediated mRNA decay in hepatocytes and renal cells, but without analyzing these tissues directly from patients, this can not be confirmed. Cells transfected with the mutant plasmid retained the >5.0 kb transcript and did not show signs of degradation, although the plasmid was overexpressed.
One important observation arising from this study was the correlation of the ethnic background of the families carrying g.–132G>A or IVS1+1G>C. While g.–132G>A was found in families of Northern European descent, IVS1+1G>C was more common in patients of Hispanic descent. Table 4 compares the frequency of the IVS1+1G>C allele relative to other HFI alleles among Hispanics with HFI and relative to those in all American HFI patients. While this mutation represents 1.5% of all American alleles, there was a significantly (p<0.01) increased frequency among Hispanics of nearly 6%, making it one of the top HFI causing alleles in this population. This would be the first allele identified that could be common to the African-American racial and Hispanic ethnic groups and will be useful for screening in this population.
Table 4.
Allele Frequencies in the Hispanic/African-American HFI Population
| American Population |
Patients | Alleles | A149Pa (c.448G>C; p.A150P) |
A174D (c.524C>A; p.A175D) |
IVS1+1G>C (−) |
Δ4E4 (c.360–363 delCAAA) |
R59Op (c.178C>T; p.R60X) |
L256P (c.770T>C; p.L257P) |
Otherb | Unknown |
|---|---|---|---|---|---|---|---|---|---|---|
| Hispanic/African-American | 36 | 72 | 17% | 10% | 5.5% | 5.5% | 3% | 3% | 2% | 54% |
| Totalc | 155 | 272 | 43% | 9% | 1.5% | 4% | 4% | 1.5% | 5% | 32% |
Allele nomenclature given as first reported in the literature; in parentheses are the recommended nomenclatures for these alleles as per HGVS (http://www.hgvs.org/rec.html); c. is based on the dDNA and p. is based on the protein with amino acid numbering starting at the cleaved methionine (Doyle and Tolan 1995).
Includes all alleles listed on Locus-Specific Database as of April 30, 2010 (http://www.bu.edu/aldolase/HFI/hfidb/hfidb.html).
Based on values reported in Coffee et al 2009.
Supplementary Material
Acknowledgments
The authors would like to thank Marilyn McCorn-St. Fleur, Michelle Garcia, Rachel Gibbons, and Taliesin Lenhart for their contributions in performing DNA sequence analysis. We’d like to thank Dr. Harvey Levy for critical reading of the manuscript. This work was supported in part by National Institutes of Health grant DK-065089 (to DRT).
References
- Abramoff MD, Magelhaes PJ, Ram SJ. Image Processing with ImageJ. Biophoton Internat. 2004;11:36–42. [Google Scholar]
- Ali M, James CL, Cox TM. A newly identified aldolase B splicing mutation (G-->C, 5′ intron 5) in hereditary fructose intolerance from New Zealand. Hum Mutat. 1996;7:155–157. doi: 10.1002/(SICI)1098-1004(1996)7:2<155::AID-HUMU11>3.0.CO;2-1. [DOI] [PubMed] [Google Scholar]
- Ali M, Tunçman G, Cross N, et al. Null alleles of the aldolase B gene in patients with hereditary fructose intolerance. J Med Genet. 1994;31:499–503. doi: 10.1136/jmg.31.6.499. [DOI] [PMC free article] [PubMed] [Google Scholar]
- Anderson TA. Recent trends in carbohydrate consumption. Annu Rev Nutr. 1982;2:113–132. doi: 10.1146/annurev.nu.02.070182.000553. [DOI] [PubMed] [Google Scholar]
- Baerlocher K, Gitzelmann R, Steinmann B, Gitzelmann-Cumarumsay N. Hereditary fructose intolerance in early childhood: a major diagnostic challenge. Helv Paediat Acta. 1978;33:465–487. [PubMed] [Google Scholar]
- Berardini T, Amsden AB, Penhoet EE, Tolan DR. Identification of conserved promoter elements for aldB and isozyme specific residues in aldolase B. Comp Biochem Physiol. 1999;122:53–61. doi: 10.1016/s0305-0491(98)10140-2. [DOI] [PubMed] [Google Scholar]
- Brooks CC, Buist N, Tuerck J, Tolan DR. Identification of a splice-site mutation in the aldolase B gene from an individual with hereditary fructose intolerance. Am J Hum Genet. 1991;49:1075–1081. [PMC free article] [PubMed] [Google Scholar]
- Coffee EM, Yerkes L, Ewen EP, Zee T, Tolan DR. Increased prevalence of mutant null alleles that cause hereditary fructose intolerance in the American population. J Inherit Metab Dis. 2009;33:33–42. doi: 10.1007/s10545-009-9008-7. [DOI] [PMC free article] [PubMed] [Google Scholar]
- Cox TM. Hereditary fructose intolerance. Quart J Med. 1988;68:585–594. [PubMed] [Google Scholar]
- Cox TM. Iatrogenic deaths in hereditary fructose intolerance. Arch Dis Childhood. 1993;69:423–415. doi: 10.1136/adc.69.4.413. [DOI] [PMC free article] [PubMed] [Google Scholar]
- Cross NC, Cox TM. Partial aldolase B gene deletions in hereditary fructose intolerance. Am J Hum Genet. 1990;47:101–106. [PMC free article] [PubMed] [Google Scholar]
- Crossley M, Brownlee GG. Disruption of a C/EBP binding site in the factor IX promoter is associated with haemophilia B. Nature. 1990;345:444–446. doi: 10.1038/345444a0. [DOI] [PubMed] [Google Scholar]
- Doyle SA, Tolan DR. Characterization of recombinant human aldolase B and purification by metal chelate chromatography. Biochem Biophys Res Commun. 1995;206:902–908. doi: 10.1006/bbrc.1995.1128. [DOI] [PubMed] [Google Scholar]
- Esposito G, Santamaria R, Vitagliano L, et al. Six novel alleles identified in Italian hereditary fructose intolerance patients enlarge the mutation spectrum of the aldolase B gene. Hum Mutat. 2004;24:534. doi: 10.1002/humu.9290. [DOI] [PubMed] [Google Scholar]
- Faustino NA, Cooper TA. Pre-mRNA splicing and human disease. Genes Dev. 2003;17:419–437. doi: 10.1101/gad.1048803. [DOI] [PubMed] [Google Scholar]
- Froesch ER, Wolf HP, Baitsch H, Prader A, Labhart A. Hereditary fructose intolerance. An inborn defect of hepatic fructose-1-phosphate splitting aldolase. Am J Med. 1963;34:151–167. doi: 10.1016/0002-9343(63)90050-0. [DOI] [PubMed] [Google Scholar]
- Funari VA, Voevodski K, Leyfer D, Yerkes K, Cramer D, Tolan DR. Quantitative gene-expression profiles in real time from expressed sequence tag database. Gene Expr. 2010;14:321–336. doi: 10.3727/105221610x12717040569820. [DOI] [PMC free article] [PubMed] [Google Scholar]
- Gitzelmann R, Baerlocher K. Vorteile und Nachteile der Frucosein der Nahrung. Padiat Fortbildk Prxis. 1973;37:40–55. [Google Scholar]
- Gregori C, Ginot F, Decaux J-F, et al. Expression of the rat aldolase B gene: a liver-specific proximal promoter and an intronic activator. Biochem Biophys Res Commun. 1991;176:722–729. doi: 10.1016/s0006-291x(05)80244-x. [DOI] [PubMed] [Google Scholar]
- Gregori C, Kahn A, Pichard AL. Competition between transcription factors HNF1 and HNF3, and alternative cell-specific activation by DBP and C/EBP contribute to the regulation of the liver-specific aldolase B promoter. Nucleic Acids Res. 1993;21:897–903. doi: 10.1093/nar/21.4.897. [DOI] [PMC free article] [PubMed] [Google Scholar]
- Gregori C, Kahn A, Pichard AL. Activity of the rat liver-specific aldolase B promoter is restrained by HNF3. Nucleic Acids Res. 1994;22:1242–1246. doi: 10.1093/nar/22.7.1242. [DOI] [PMC free article] [PubMed] [Google Scholar]
- Gregori C, Porteu A, Lopez S, Kahn A, Pichard AL. Characterization of the aldolase B intronic enhancer. J Biol Chem. 1998;273:25237–25243. doi: 10.1074/jbc.273.39.25237. [DOI] [PubMed] [Google Scholar]
- Hers H-G, Joassin G. Anomalie de l’aldolase hepatique dans l’intolerance au fructose. Enzymol Biol Clin. 1961;1:4–14. [PubMed] [Google Scholar]
- James CL, Rellos P, Ali M, Heeley AF, Cox TM. Neonatal screening for hereditary fructose intolerance: frequency of the most common mutant aldolase B allele (A149P) in the British population. J Med Genet. 1996;33:837–841. doi: 10.1136/jmg.33.10.837. [DOI] [PMC free article] [PubMed] [Google Scholar]
- Koivisto UM, Palvimo JJ, Janne OA, Kontula K. A single-base substitution in the proximal Sp1 site of the human low density lipoprotein receptor promoter as a cause of heterozygous familial hypercholesterolemia. Proc Natl Acad Sci USA. 1994;91:10526–10530. doi: 10.1073/pnas.91.22.10526. [DOI] [PMC free article] [PubMed] [Google Scholar]
- Krawczak M, Reiss J, Cooper DN. The mutational spectrum of single base-pair substitutions in mRNA splice junctions of human genes: causes and consequences. Hum Genet. 1992;90:41–54. doi: 10.1007/BF00210743. [DOI] [PubMed] [Google Scholar]
- Laméire N, Mussche M, Baele G, Kint J, Ringoir S. Hereditary fructose intolerance: A difficult diagnosis in the adult. Am J Med. 1978;65:416–423. doi: 10.1016/0002-9343(78)90767-2. [DOI] [PubMed] [Google Scholar]
- Lopez-Lastra M, Rivas A, Barria MI. Protein synthesis in eukaryotes: the growing biological relevance of cap-independent translation initiation. Biol Res. 2005;38:121–146. doi: 10.4067/s0716-97602005000200003. [DOI] [PubMed] [Google Scholar]
- Malay AD, Procious SL, Tolan DR. The temperature dependence of activity and structure for the most prevalent mutant aldolase B associated with hereditary fructose intolerance. Arch Biochem Biophys. 2002;408:295–304. doi: 10.1016/s0003-9861(02)00546-5. [DOI] [PubMed] [Google Scholar]
- McGlincy NJ, Smith CW. Alternative splicing resulting in nonsense-mediated mRNA decay: what is the meaning of nonsense? Trends Biochem Sci. 2008;33:385–393. doi: 10.1016/j.tibs.2008.06.001. [DOI] [PubMed] [Google Scholar]
- Morris RCJ. An experimental renal acidification defect in patients with hereditary fructose intolerance. II. Its distinction from classic renal tubular acidosis: its resemblance to the renal acidification defect associated with the Fanconi syndrome of children with cystinosis. J Clin Invest. 1968;47:1648–1663. doi: 10.1172/JCI105856. [DOI] [PMC free article] [PubMed] [Google Scholar]
- Odièvre M, Gentil C, Gautier M, Alagille D. Hereditary fructose intolerance in childhood: diagnosis, management and course in 55 patients. Am J Dis Child. 1978;132:605–608. doi: 10.1001/archpedi.1978.02120310069014. [DOI] [PubMed] [Google Scholar]
- Orkin SH, Alter BP, Altay C, et al. Application of endonuclease mapping to the analysis and prenatal diagnosis of thalassemias caused by globin-gene deletion. New Engl J Med. 1978;299:166–172. doi: 10.1056/NEJM197807272990403. [DOI] [PubMed] [Google Scholar]
- Park HD, Kim YK, Park KU, Kim JQ, Song YH, Song J. A novel c.-22T>C mutation in GALK1 promoter is associated with elevated galactokinase phenotype. BMC Med Genet. 2009;10:29. doi: 10.1186/1471-2350-10-29. [DOI] [PMC free article] [PubMed] [Google Scholar]
- Perez-Tur J, Froelich S, Prihar G, et al. A mutation in Alzheimer’s disease destroying a splice acceptor site in the presenilin-1 gene. Neurorep. 1995;7:297–301. [PubMed] [Google Scholar]
- Raymondjean M, Pichard A-L, Gregori C, Ginot F, Kahn A. Interplay of an original combination of factors: C/EBP, NFY, HNF3, and HNF1 in the rat aldolase B gene promoter. Nucleic Acids Res. 1991;19:6145–6153. doi: 10.1093/nar/19.22.6145. [DOI] [PMC free article] [PubMed] [Google Scholar]
- Saiki RK, Scharf S, Faloona F, et al. Enzymatic amplification of β-globin genomic sequences and restriction analysis for diagnosis of sickle cell anemia. Science. 1985;230:1350–1354. doi: 10.1126/science.2999980. [DOI] [PubMed] [Google Scholar]
- Sakai T, Ohtani N, McGee TL, Robbins PD, Dryja TP. Oncogenic germ-line mutations in Sp1 and ATF sites in the human retinoblastoma gene. Nature. 1991;353:83–86. doi: 10.1038/353083a0. [DOI] [PubMed] [Google Scholar]
- Santer R, Rischewski J, von Weihe M, et al. The spectrum of aldolase B (ALDOB) mutations and the prevalence of hereditary fructose intolerance in Central Europe. Hum Mutat. 2005;25:594. doi: 10.1002/humu.9343. [DOI] [PubMed] [Google Scholar]
- Silva AL, Romao L. The mammalian nonsense-mediated mRNA decay pathway: to decay or not to decay! Which players make the decision? FEBS Lett. 2009;583:499–505. doi: 10.1016/j.febslet.2008.12.058. [DOI] [PubMed] [Google Scholar]
- Steinmann B, Gitzelmann R. The diagnosis of hereditary fructose intolerance. Helv Paediat Acta. 1981;36:297–316. [PubMed] [Google Scholar]
- Steinmann B, Gitzelmann R, Van den Berghe G. Disorders of Fructose Metabolism. In: Scriver C, Beaudet A, Sly W, Valle D, editors. The Metabolic and Molecular Basis of Inherited Disease. New York: McGraw-Hill, Inc; 2001. pp. 1489–1520. [Google Scholar]
- Tolan DR, Brooks CC. Molecular analysis of common aldolase B alleles for hereditary fructose intolerance in North Americans. Biochem Molec Med. 1992;48:19–25. doi: 10.1016/0885-4505(92)90043-x. [DOI] [PubMed] [Google Scholar]
- Tolan DR, Penhoet EE. Characterization of the human aldolase B gene. Mol Biol Med. 1986;3:245–264. [PubMed] [Google Scholar]
- Tsutsumi K, Ito K, Ishikawa K. Developmental appearance of transcription factors that regulate liver-specific expression of the aldolase B gene. Mol Cell Biol. 1989;9:4923–4931. doi: 10.1128/mcb.9.11.4923. [DOI] [PMC free article] [PubMed] [Google Scholar]
- Vallet V, Bens M, Antoine B, et al. Transcription factors and aldolase B gene expression in microdissected renal proximal tubules and derived cell lines. Exp Cell Res. 1995;216:363–370. doi: 10.1006/excr.1995.1046. [DOI] [PubMed] [Google Scholar]
- Yabuki T, Ejiri S, Tsutsumi K. Ubiquitous factors that interact simultaneously with two distinct cis-elements on the rat aldolase B gene promoter. Biochim Biophys Acta. 1993;1216:15–19. doi: 10.1016/0167-4781(93)90032-9. [DOI] [PubMed] [Google Scholar]
- Yudkin J, Kang SS, Bruckdorfer KR. Effects of high dietary sugar. Br Med J. 1980;281:1396. doi: 10.1136/bmj.281.6252.1396. [DOI] [PMC free article] [PubMed] [Google Scholar]
Associated Data
This section collects any data citations, data availability statements, or supplementary materials included in this article.