

Abstract
The purpose of this study was to investigate the effects of cardiac pulsation in diffusion tensor imaging (DTI) of the rat brain. DTI data were acquired either with or without different cardiac gating delays. For each case, two sets of identical DTI data were acquired for a bootstrap analysis to measure the uncertainty in estimating mean diffusivity (MD), fractional anisotropy (FA) and the primary eigenvector direction. The 95% confidence interval of the primary eigenvectors was substantially reduced (21 ~ 25 %) when cardiac gating with triggering delay of 70 ms (~ half of R-R peak duration) was used in comparison to studies without gating or when gating with a triggering delay of 0 ms was used. Standard deviations of MD and FA estimates were also reduced by 12 – 26 % and 13 – 24 %, respectively. For voxels with mean FA values larger than 0.15 and smaller than 0.95, the decrease in CI and standard deviations of MD and FA by cardiac gating with triggering delay of 70 ms were significant (p < 0.05). These results demonstrate the importance of cardiac gating in acquisition of in vivo high resolution DTI data.
Keywords: diffusion tensor imaging, cardiac gating, rat brain, bootstrap analysis
INTRODUCTION
Diffusion tensor imaging (DTI) has been widely used to study the brain (Le Bihan et al., 2001). While this technique is commonly applied to the human brain, only a limited number of studies of the rat brain in vivo (Xue et al., 1999) or ex vivo (Huang et al., 2004) have been published. In vivo imaging studies of intra-cranial rat brain tumor or other neurological disease models may be important as these studies provide greater experimental control, histological confirmation, and follow-up studies of underlying cellular and molecular mechanisms. However, considering the small size of the rat brain (~1 cc) in comparison to the human brain (~ 1500 cc), in vivo DTI of the rat brain is challenging.
Besides the challenge of imaging the small brain, it is unclear as to whether in vivo DTI of the rat brain benefits from cardiac gating. A number of human DTI studies have demonstrated that cardiac pulsation introduces uncertainties in diffusion tensor orientations as well as in DTI-based metrics, and therefore cardiac gated DTI has been often recommended (Brockstedt et al., 1999; Chung et al., 2010; Jones and Pierpaoli, 2005; Pierpaoli et al., 2003; Skare and Andersson, 2001). Brockstedt et al (Brockstedt et al., 1999) reported that the average standard deviation of the apparent diffusion coefficients (ADC) was significantly higher without cardiac gating than with cardiac gating. Similar benefits of gating have been reported for other DTI metrics (Jones and Pierpaoli, 2005; Pierpaoli et al., 2003; Skare and Andersson, 2001). Chung et al (Chung et al., 2010) reported that by using cardiac gating and partial Fourier acquisition, the 95% confidence interval (CI) of the primary eigenvector in the white matter was 18% smaller than without cardiac gating. While these studies demonstrate the added benefit of cardiac gating in DTI studies, no such studies have been performed in rodents that have much faster heart rates. Hence, the purpose of this study was to investigate the effect of cardiac pulsation on in vivo DTI of the rat brain.
MATERIALS AND METHODS
Animal Models and Preparation
Four- to six-week-old female Fisher rats (n=8) were used to study the effect of cardiac gating. For the imaging study, the animal was mounted on a cradle after general anesthesia was induced using 3% isoflurane in oxygen. The head of the rat was secured in a nose cone and a restraining device with ear pins to minimize motion induced artifacts. In addition, the neck and shoulders were held in place by a restraining device to minimize the effect of any body motion, including respiratory or involuntary jerk motion, on the brain. Subdermal needle electrodes and a rectal thermister were placed and connected to a small animal vital signs monitoring device (SA Instruments, NY, USA) to monitor electrocardiogram and core body temperature. During the scan, anesthesia was maintained with 1.5% isoflurane in oxygen. The animal body temperature was maintained at 37 (±1) °C during the scan by directing a thermostatically controlled warm air source.
Data Acquisition
All MR studies were performed on a 4.7T horizontal bore magnet (Magnex Scientific Inc., Abingdon, Oxon, UK) attached to a Varian Inova console (Varian, Inc., Palo Alto, CA, USA) equipped with 25 G/cm gradients with rise times to full amplitude of 200 μs. A dual coil system; a 7 cm microstrip volume coil to transmit and a 2.5 cm surface coil to receive the RF signal (Insight Neuroimaging Systems, LLC. Worcester, MA, USA) was used for all imaging studies. Twenty axial slices were selected to cover most of the cerebral cortex. In order to minimize the difference in the slice locations between subsequent scans, the center of the imaging slice at the mid-point between the rostral end of cerebrum and the caudal end of the cerebellum detected in the mid-sagittal image was selected. A pulsed gradient spin echo sequence was modified to acquire 2D multi-slice images with diffusion weighting along six directions optimally selected for anisotropy measurement (Jones et al., 1999) in addition to the non diffusion-weighted image. The scan was repeated with diffusion gradients in the opposite direction to reduce the cross-term effect from imaging gradients by taking the geometric average of the two (Neeman et al., 1991). The imaging parameters were TR = 2 s, TE = 35 ms, FOV = 3 cm, slice thickness=1 mm, matrix size = 128 × 128, and number of acquisitions = 2. The strength and duration of diffusion gradients were 12 G/cm and 7 ms, respectively, and diffusion time was 20 ms, resulting in a b-value of approximately 891 s/mm2. Scan time per animal was about 2 hours for each cardiac gating option. Two cardiac gating options per animal were used to measure the effect of cardiac gating as described in the next section.
Cardiac Gating
The effect of cardiac gating on rat brain DTI was assessed using normal rats (n = 8). Five rats were used to compare cardiac triggering delay (from the rising edge of R peak) = 0 and ~ 70 ms corresponding to an acquisition in the middle of two adjacent R-peaks. In the remaining three rats, DTI data were acquired with or without cardiac gating. When gating was used, the triggering delay was 70 ms. In each case, two sets of identical DTI data were acquired for a bootstrap analysis to measure uncertainty in the primary eigenvector direction (Jones, 2003). Briefly, one test DTI data set was generated by randomly selecting diffusion weighted images from two raw data sets. With two data sets of 13 different diffusion weightings (b = 0, 6 diffusion weighting directions, and 6 opposition directions), there are 8192 (213) combinations of raw images as test data sets. We randomly selected 200 test data sets for bootstrap analysis. Each test DTI data set was used to calculate mean diffusivity (MD), fractional anisotropy (FA) and primary eigenvector. For each voxel in the brain, mean and standard deviation (SD) of MD and FA were calculated. The mean primary eigenvector was calculated by averaging the dyadic tensors of 200 bootstrap primary eigenvectors and determining the primary eigenvector of the mean dyadic tensor, using the method suggested by Basser and Pajevic (Basser and Pajevic, 2000). Angular differences between the bootstrap primary eigenvectors and the mean primary eigenvector were calculated. Since the distribution of angular difference is one-tailed, the 95% CI of the primary eigenvector was determined as the angular difference at the 190th position in the sorted angular differences. The analysis was only performed for the voxels with MD ≥ 0.5 and MD ≤ 1.0 μm2/ms, in order to avoid regions with predominantly cerebrospinal fluid or areas that did not include the brain. Wilcoxon rank sum test was used for comparison of median values and t-test was used for comparison of mean values unless specified otherwise. This data analysis was performed using in-house software written in Matlab (The MathWorks, Inc. Natick, MA).
RESULTS
Representative raw images and directionally encoded color (DEC) maps are shown in Fig. 1. For representation, images from slices 2, 5, 8, 13, and 19 are shown. The image slice positions were consistent across all animals as we used the in-house re-positioning and restraining device described in the methods section. Out of 20 slices, the first and last images were excluded from the analysis since they usually had large partial volume effects. Signal to noise ratio (SNR) in the cortical ribbon of the raw images without diffusion weighting was approximately 72. DEC maps show major white matter tracts, such as the corpus callosum (solid arrow), as well as the radial alignment of neurons in the cortical region (block arrows) which was also observed in high resolution ex vivo DTI of the mouse brain (Zhang et al., 2002). Visual inspection of the raw images indicated that all images were free of any noticeable motion artifacts.
Figure 1.
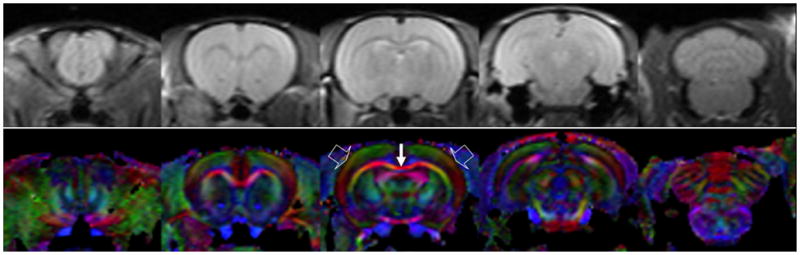
Representative raw images (non-diffusion weighted, top row) and directionally encoded color images (bottom row). From left, the images correspond to slices 2, 5, 8, 13, and 19, respectively. SNR in the cortical ribbon of the raw image was approximately 72. In directionally encoded color images, the signal intensity is weighted by FA and the color represents the orientation of the primary eigenvector; red: left-right, green: dorsal-ventral, blue: caudal-rostral. Major white matter tracts, such as the corpus callosum (solid thin arrow), can be observed clearly. It also shows radial alignment of neurons in the cortical ribbon (block arrows).
Bootstrap analysis was conducted to investigate the effect of cardiac gating in terms of MD, FA, and 95% CI of the primary eigenvectors. Figures 2 and 3 show these parametric maps for a rat brain with a triggering delay (Td) of 0 and 70 ms, respectively. There was no discernable difference between the two figures in terms of mean MD (first row) and mean FA (third row). However, the standard deviations (SD) of MD and FA of Fig. 2 (Td = 0 ms) appeared higher than those of Fig. 3 (Td = 70 ms). CI also appeared higher in Fig. 2 than in Fig. 3. These differences were generally higher near the cortical surface or ventricles, but were also easily noticeable across the entire brain parenchyma.
Figure 2.

Representative maps of DTI metrics and their uncertainties measured using cardiac gating with triggering delay of 0 ms. From left, the images are for slices 2, 4, 6, 8, 10, 12, 14, 16, and 18. The maps are displayed only for the region with MD ≥ 0.5 and MD ≤ 1.0 μm2/ms, in order to avoid regions with cerebrospinal fluid or any other non-brain area. For the scale bars on the right, the units of MD and CI are μm2/ms and degrees, respectively.
Figure 3.

Representative maps of DTI metrics and their uncertainties measured using cardiac gating with triggering delay of 70 ms, for the same rat shown in Fig. 2. From left, the images are for slices 2, 4, 6, 8, 10, 12, 14, 16, and 18. The maps are displayed only for the region with MD ≥ 0.5 and MD ≤ 1.0 μm2/ms, in order to avoid regions with cerebrospinal fluid or any other non-brain area. For the scale bars on the right, the units of MD and CI are μm2/ms and degrees, respectively.
Fig. 4 shows histograms for SD of MD (denoted as SD(MD)), SD of FA (denoted as SD(FA)), and CI from all animals. The histograms on the top row (Fig. 4a, b, and c) compare two different Td; 0 ms (dashed lines) and 70 ms (solid lines). The median of SD(MD) with Td = 0 ms (0.023, interquartile range (IQR): 0.016 – 0.036) was significantly higher (p < 0.01) than that with Td = 70 ms (0. 020, IQR: 0.014 – 0.029). The median of SD(FA) with Td = 0 ms (0.033, IQR: 0.025 – 0.046) was significantly higher (p < 0.01) than that with Td = 70 ms (0.028, IQR: 0.022 – 0.037). The median of CI with Td = 0 ms (18.6 deg, IQR: 10.6 – 39.7) was also significantly larger (p < 0.01) than that with Td = 70 ms (15.2, IQR: 8.9 – 30.0). The histograms on the bottom row (Fig. 4d, e, and f) show comparison between non-gating and gating with Td = 70 ms. The medians without cardiac gating (SD(MD) = 0.024, IQR:0.017 – 0.035; SD(FA) = 0.035, IQR: 0.027 – 0.047; CI = 19.1, IQR: 11.3 – 37.4) were significantly higher (p < 0.01) than those with cardiac gating with Td = 70 ms (SD(MD) = 0.021, IQR: 0.014 – 0.030; SD(FA) = 0.030, IQR: 0.023 – 0.040; CI = 15.8, IQR: 9.3 – 31.0). Thus, using cardiac gating with the appropriate triggering delay reduced the uncertainty in DTI measurements.
Figure 4.

Histograms of the uncertainty measures from all animals (total number of voxels = 150043). The plots in the top row (a, b, and c) are from cardiac gating with Td = 0 ms (thin dashed lines) and Td = 70 ms (thick solid lines). The plots in the bottom row (d, e, and f) are for data without cardiac gating (thin dashed lines) and cardiac gating with Td = 70 ms (thick solid lines).
Fig. 5 shows the uncertainty in DTI metrics as a function of FA. The plots on the top row (Fig. 5a, b, and c) show comparison between Td = 0 ms and 70 ms. All three measures, SD(MD), SD(FA), and CI, were reduced by 26 ± 10 %, 24 ± 9%, and 25 ± 13 %, respectively, when using Td = 70 ms, compared to using Td = 0 ms. The differences between the mean uncertainties of two gating delays were significant for all FA values (p < 0.05). The bottom row presents plots that compare the uncertainties of DTI metrics measured without cardiac gating and with cardiac gating. All three measures, SD(MD), SD(FA), and CI, were reduced by 12 ± 4 %, 13 ± 5%, and 21 ± 4 %, respectively, by using cardiac gating with Td = 70 ms, compared to images acquired without cardiac gating. The differences of the mean uncertainties with and without cardiac gating were significant for all FA values (p < 0.05). Although not shown in Fig. 5, the SDs of eigenvalues with cardiac gating with Td = 70 ms were significantly smaller than those with either Td = 0 ms or no cardiac gating for all FA values (p < 0.05).
Figure 5.

Comparison of the uncertainty measures from all animals as a function of FA. Each FA value on the x-axes represents a range of the given FA ± 0.05. The plots in the top row (a, b, and c) are from cardiac gating with Td = 0 ms (black bars) and Td = 70 ms (white bars). The plots in the bottom row (d, e, and f) are for data without cardiac gating (black bars) and cardiac gating with Td = 70 ms (white bars). The error ranges represent standard deviations.
Fig. 6 shows the average uncertainty measures depending on the imaging slice position. The position of slice 1 corresponds to the back of the eyes and that of slice 20 to the caudal end of the cerebellum. In general, the slice averages of SD(MD), SD(FA), and CI with cardiac gating with Td = 70 ms were lower than those measured with either cardiac gating with Td = 0 ms or no cardiac gating. The average uncertainty measures were lowest near the frontal slices between slice 4 and slice 10, and increased in both rostral and caudal ends of the brain. Particularly slices 2 and 3 along the olfactory bulb showed markedly increased uncertainties. This observation might be due to decrease in the ratio of brain volume to surface area in both ends where the effect of cerebrospinal fluid is relatively larger than the mid slices.
Figure 6.

Comparison of the uncertainty measures from all animals as a function of slice position. Slice 1 is located at the back of the eyes while slice 20 is at the caudal end of the cerebellum. Both slices 1 and 20 were not included in the analysis. The plots in the top row (a, b, and c) are from cardiac gating with Td = 0 ms (thin dashed lines) and Td = 70 ms (thick solid lines). The plots in the bottom row (d, e, and f) are for data without cardiac gating (thin dashed lines) and cardiac gating with Td = 70 ms (thick solid lines). For clarity in presentation, standard errors are displayed as the error ranges.
DISCUSSION
In this study, we observed that the 95% CI of the primary eigenvector was reduced substantially (21 – 25 %) by acquiring the data near diastole using cardiac gating with a triggering delay of 70 ms. It has been suggested that cardiac pulsation in human DTI studies can increase uncertainty in primary eigenvector as well as in DTI-based metrics (Brockstedt et al., 1999; Chung et al., 2010; Jones and Pierpaoli, 2005; Pierpaoli et al., 2003). A single-shot EPI sequence is commonly used in human DTI studies. Since this sequence uses a long echo train after each shot, the benefit of cardiac gating is reduced when full Fourier acquisition is used as shown by Chung et al (Chung et al., 2010). However, in case of partial Fourier acquisition, it has been reported that 95% CI of the primary eigenvector in the white matter was 18% smaller with cardiac gating than without cardiac gating (Chung et al., 2010). These findings are similar to our results as we observed 21 to 25 % smaller CI with cardiac gating using a single-shot spin echo sequence. Since the cardiac pulse duration of the rats in our study was approximately 140 to 160 ms and we used an echo time of 35 ms, it may be possible to use a fast spin echo sequence with two or three echoes per each trigger to increase the signal-to-noise ratio or to minimize the scan time, without being affected by the cardiac pulsation artifact.
Substantial decreases in 95% CI of the primary eigenvectors can also have significant influence in DTI-based tractography, although the current study was not designed to assess this effect on tractography. In order to assess the cardiac pulsation effect on tractography, it will be necessary to acquire data with a much higher spatial resolution than used in the present study. Since multiple DTI data sets with different cardiac gating delays were required for the bootstrap analysis in this study, it was not feasible to increase the scan time further to achieve the necessary spatial resolution. In addition, it is desirable to have more than six diffusion weighting gradient directions if possible, in order to reduce the inherent uncertainty in diffusion tensor estimation. Using a simulated data of tensors with FA = 0.9 and SNR = 15, Jones (Jones, 2004) reported that 95% CI of the primary eigenvector can be around 6 degrees with 6 diffusion weighting directions. The mean CI of the primary vector for 0.85 < FA < 0.95 was 2.8 ~ 4 degrees in our study. Considering the high SNR of our data set (~70 for b = 0), our results are in good agreement with the simulation result reported by Jones (Jones, 2004). The same study by Jones suggested that at least 30 diffusion weighting directions are required for robust estimation of the tensor orientation (Jones, 2004). We have demonstrated that cardiac gating can substantially improve the accuracy in estimating the diffusion tensor orientation even for DTI data with 6 diffusion weighting directions.
Mean diffusivity (MD) and fractional anisotropy (FA), are the most commonly used DTI measures throughout various brain studies, such as stroke (Moseley et al., 1990), tumor (Kim et al., 2008; Moffat et al., 2005; Poptani et al., 1998), multiple sclerosis (Filippi et al., 2001), and brain injury (Inglese et al., 2005). In this study, we also found that the uncertainty in measuring MD and FA was substantially reduced when cardiac gating was used. This was because cardiac pulsation affected not only the orientation of primary eigenvectors, but also all three eigenvalues of diffusion tensor (data not shown). The uncertainty was measured in terms of standard deviation of the estimated MD or FA for same voxels from 200 test data sets. Reduction of uncertainty in measuring DTI metrics can lead to increased sensitivity in detecting early pathological changes and in reducing false positives. The results from the current study with the rat brain and a recent clinical study by Chung et al. (Chung et al., 2010) suggest that more accurate measurement of MD and FA can be made when cardiac gating is used.
Future DTI studies of rat brain may benefit from the recent developments in the MRI hardware and software. Of particular interest is the availability of parallel imaging (Pruessmann et al., 1999; Sodickson and Manning, 1997), which leads to a substantial reduction in image acquisition times. The reduced scan time can be used to increase the imaging quality by allowing more repetitions or to increase the number of diffusion weighting directions toward Q-ball (Tuch, 2004) or diffusion spectrum imaging (Wedeen et al., 2005) methods in order to measure the complete 3D pattern of diffusion. Another potential area of improvement is the improvement in SNR by using a quadrature coil to maximize the efficiency (Kamiryo et al., 1995) or using a cryogenic coil to minimize the thermal noise (Baltes et al., 2009). Improved SNR will allow achieving better spatial resolution for smaller brain structures and also improve the accuracy of diffusion tensor estimation which is sensitive to the noise level. With these exciting technical developments on the horizon, it will become more important to minimize physiological artifacts, such as cardiac pulsation effect presented in this study, for successful in vivo DTI studies of the rodent brain in future.
Research Highlights.
Cardiac gating reduces the 95% confidence interval of primary eigenvector orientation by 21 ~ 25 %.
Cardiac gating reduces standard deviation of mean diffusivity measurement by 12 ~ 26 %.
Cardiac gating reduces standard deviation of fractional anisotropy measurement by 13 ~ 24 %.
Acknowledgments
The authors would like to thank Oliver Hsu for his help in data acquisition. This study was funded by University Research Foundation and NIH R21 HD058237 (HP).
Abbreviations
- DTI
diffusion tensor imaging
- ADC
apparent diffusion coefficient
- CI
confidence interval
- MD
mean diffusivity
- FA
fractional anisotropy
- ROI
region of interest
- DEC
directionally encoded color
- SNR
signal to noise ratio
- SD
standard deviation
- Td
triggering delay
Footnotes
Publisher's Disclaimer: This is a PDF file of an unedited manuscript that has been accepted for publication. As a service to our customers we are providing this early version of the manuscript. The manuscript will undergo copyediting, typesetting, and review of the resulting proof before it is published in its final citable form. Please note that during the production process errors may be discovered which could affect the content, and all legal disclaimers that apply to the journal pertain.
References
- Baltes C, Radzwill N, Bosshard S, Marek D, Rudin M. Micro MRI of the mouse brain using a novel 400 MHz cryogenic quadrature RF probe. NMR Biomed. 2009;22:834–42. doi: 10.1002/nbm.1396. [DOI] [PubMed] [Google Scholar]
- Basser PJ, Pajevic S. Statistical artifacts in diffusion tensor MRI (DT-MRI) caused by background noise. Magn Reson Med. 2000;44:41–50. doi: 10.1002/1522-2594(200007)44:1<41::aid-mrm8>3.0.co;2-o. [DOI] [PubMed] [Google Scholar]
- Brockstedt S, Borg M, Geijer B, Wirestam R, Thomsen C, Holtas S, Stahlberg F. Triggering in quantitative diffusion imaging with single-shot EPI. Acta Radiol. 1999;40:263–9. doi: 10.3109/02841859909175552. [DOI] [PubMed] [Google Scholar]
- Chung S, Courcot B, Sdika M, Moffat K, Rae C, Henry RG. Bootstrap quantification of cardiac pulsation artifact in DTI. Neuroimage. 2010;49:631–40. doi: 10.1016/j.neuroimage.2009.06.067. [DOI] [PubMed] [Google Scholar]
- Filippi M, Cercignani M, Inglese M, Horsfield MA, Comi G. Diffusion tensor magnetic resonance imaging in multiple sclerosis. Neurology. 2001;56:304–11. doi: 10.1212/wnl.56.3.304. [DOI] [PubMed] [Google Scholar]
- Huang H, Zhang J, van Zijl PC, Mori S. Analysis of noise effects on DTI-based tractography using the brute-force and multi-ROI approach. Magn Reson Med. 2004;52:559–65. doi: 10.1002/mrm.20147. [DOI] [PubMed] [Google Scholar]
- Inglese M, Makani S, Johnson G, Cohen BA, Silver JA, Gonen O, Grossman RI. Diffuse axonal injury in mild traumatic brain injury: a diffusion tensor imaging study. J Neurosurg. 2005;103:298–303. doi: 10.3171/jns.2005.103.2.0298. [DOI] [PubMed] [Google Scholar]
- Jones DK. Determining and visualizing uncertainty in estimates of fiber orientation from diffusion tensor MRI. Magn Reson Med. 2003;49:7–12. doi: 10.1002/mrm.10331. [DOI] [PubMed] [Google Scholar]
- Jones DK. The effect of gradient sampling schemes on measures derived from diffusion tensor MRI: a Monte Carlo study. Magn Reson Med. 2004;51:807–15. doi: 10.1002/mrm.20033. [DOI] [PubMed] [Google Scholar]
- Jones DK, Horsfield MA, Simmons A. Optimal strategies for measuring diffusion in anisotropic systems by magnetic resonance imaging. Magn Reson Med. 1999;42:515–25. [PubMed] [Google Scholar]
- Jones DK, Pierpaoli C. Contribution of cardiac pulsation to variability of tractography results. 13th Annual Meeting of the ISMRM; Miami. 2005. [Google Scholar]
- Kamiryo T, Berr SS, Lee KS, Kassell NF, Steiner L. Enhanced magnetic resonance imaging of the rat brain using a stereotactic device with a small head coil: technical note. Acta Neurochir (Wien) 1995;133:87–92. doi: 10.1007/BF01404955. [DOI] [PubMed] [Google Scholar]
- Kim S, Pickup S, Hsu O, Poptani H. Diffusion tensor MRI in rat models of invasive and well-demarcated brain tumors. NMR Biomed. 2008;21:208–16. doi: 10.1002/nbm.1183. [DOI] [PubMed] [Google Scholar]
- Le Bihan D, Mangin JF, Poupon C, Clark CA, Pappata S, Molko N, Chabriat H. Diffusion tensor imaging: concepts and applications. J Magn Reson Imaging. 2001;13:534–46. doi: 10.1002/jmri.1076. [DOI] [PubMed] [Google Scholar]
- Moffat BA, Chenevert TL, Lawrence TS, Meyer CR, Johnson TD, Dong Q, Tsien C, Mukherji S, Quint DJ, Gebarski SS, Robertson PL, Junck LR, Rehemtulla A, Ross BD. Functional diffusion map: a noninvasive MRI biomarker for early stratification of clinical brain tumor response. Proc Natl Acad Sci U S A. 2005;102:5524–9. doi: 10.1073/pnas.0501532102. [DOI] [PMC free article] [PubMed] [Google Scholar]
- Moseley ME, Cohen Y, Mintorovitch J, Chileuitt L, Shimizu H, Kucharczyk J, Wendland MF, Weinstein PR. Early detection of regional cerebral ischemia in cats: comparison of diffusion- and T2-weighted MRI and spectroscopy. Magn Reson Med. 1990;14:330–46. doi: 10.1002/mrm.1910140218. [DOI] [PubMed] [Google Scholar]
- Neeman M, Freyer JP, Sillerud LO. A simple method for obtaining cross-term-free images for diffusion anisotropy studies in NMR microimaging. Magn Reson Med. 1991;21:138–43. doi: 10.1002/mrm.1910210117. [DOI] [PubMed] [Google Scholar]
- Pierpaoli C, Marenco S, Rohde GK, Jones DK, Barnett AS. Analyzing the contribution of cardiac pulsation to the variability of quantities derived from the diffusion tensor. 11th Annual Meeting of the ISMRM; Toronto. 2003. [Google Scholar]
- Poptani H, Puumalainen AM, Grohn OH, Loimas S, Kainulainen R, Yla-Herttuala S, Kauppinen RA. Monitoring thymidine kinase and ganciclovir-induced changes in rat malignant glioma in vivo by nuclear magnetic resonance imaging. Cancer Gene Ther. 1998;5:101–9. [PubMed] [Google Scholar]
- Pruessmann KP, Weiger M, Scheidegger MB, Boesiger P. SENSE: sensitivity encoding for fast MRI. Magn Reson Med. 1999;42:952–62. [PubMed] [Google Scholar]
- Skare S, Andersson JL. On the effects of gating in diffusion imaging of the brain using single shot EPI. Magn Reson Imaging. 2001;19:1125–8. doi: 10.1016/s0730-725x(01)00415-5. [DOI] [PubMed] [Google Scholar]
- Sodickson DK, Manning WJ. Simultaneous acquisition of spatial harmonics (SMASH): fast imaging with radiofrequency coil arrays. Magn Reson Med. 1997;38:591–603. doi: 10.1002/mrm.1910380414. [DOI] [PubMed] [Google Scholar]
- Tuch DS. Q-ball imaging. Magn Reson Med. 2004;52:1358–72. doi: 10.1002/mrm.20279. [DOI] [PubMed] [Google Scholar]
- Wedeen VJ, Hagmann P, Tseng WY, Reese TG, Weisskoff RM. Mapping complex tissue architecture with diffusion spectrum magnetic resonance imaging. Magn Reson Med. 2005;54:1377–86. doi: 10.1002/mrm.20642. [DOI] [PubMed] [Google Scholar]
- Xue R, van Zijl PC, Crain BJ, Solaiyappan M, Mori S. In vivo three-dimensional reconstruction of rat brain axonal projections by diffusion tensor imaging. Magn Reson Med. 1999;42:1123–7. doi: 10.1002/(sici)1522-2594(199912)42:6<1123::aid-mrm17>3.0.co;2-h. [DOI] [PubMed] [Google Scholar]
- Zhang J, van Zijl PC, Mori S. Three-dimensional diffusion tensor magnetic resonance microimaging of adult mouse brain and hippocampus. Neuroimage. 2002;15:892–901. doi: 10.1006/nimg.2001.1012. [DOI] [PubMed] [Google Scholar]