Abstract
Background and objectives: Amyloidosis is a group of disorders characterized by accumulation of extracellular deposition of proteins as insoluble aggregates. The clinical management of amyloidosis is based on identifying the underlying etiology and accurate typing of the amyloid. Ig heavy chain amyloid involving the kidney is poorly recognized and often poses a diagnostic dilemma.
Design, setting, participants, & measures: In this study, we describe the use of laser microdissection (LMD) and mass spectrometry (MS)–based proteomic analysis for the accurate typing of 14 cases of amyloidosis. We also describe the clinicopathologic findings of four problematic cases of renal Ig heavy chain amyloidosis that required LMD/MS proteomic analysis for accurate typing of the amyloid.
Results: LMD/MS proteomic data of four cases of Ig heavy chain renal amyloidosis showed Ig heavy chains with or without light chains. The break up of the Ig heavy chains was as follows: one case showed Igγ1 chain constant region and λ light chains, one case showed Igα chain constant region and κ light chains variable and constant regions, whereas two cases showed Igγ3 chain constant region and heavy chains variable region I and/or III without light chains. We compare the LMD/MS proteomic data of Ig heavy chain renal amyloid with that of other types of amyloid, including Ig light chains, serum amyloid A, fibrinogen A-α chain renal amyloid, and transthyretin amyloid.
Conclusions: We conclude that LMD/MS is a sensitive and specific tool for diagnosis and accurate typing of renal amyloidosis, including Ig heavy chain amyloid.
Amyloidosis is caused by extracellular deposition of proteins in an insoluble β-pleated physical format. Amyloid deposits are identified on the basis of their apple-green birefringence under a polarized light microscope on Congo red stains and the presence of rigid, nonbranching fibrils 7.5 to 10 nm in diameter on electron microscopy (1,2). The most common forms of systemic amyloidosis are Ig light-chain (AL) amyloidosis, and reactive secondary amyloidosis (AA) caused by chronic inflammatory diseases (e.g., rheumatoid arthritis and chronic infections). Hereditary amyloidosis is another group of amyloidosis that is now being diagnosed with increasing frequency and includes the amyloid derived from transthyretin (TTR), fibrinogen A α-chain, lysozyme, and apolipoproteins (3–5).
Ig heavy chain (AH) amyloidosis resulting from deposition of Ig heavy chains is poorly recognized, often pose a diagnostic dilemma, and only few cases have been reported (6–11). In the renal biopsy consultative practice at the Mayo Clinic, we have noted an increasing number of amyloidosis cases that are associated with Ig heavy chain deposition. In some cases, the amyloid is composed of both light and heavy chain components (AL+AH), whereas other cases show AH only. Both AH and AL+AH amyloidosis can be diagnostically extremely challenging. We have recently reported on the technique of laser microdissection (LMD) and tandem mass spectrometry (MS)–based proteomic analysis as a sensitive and specific tool for the diagnosis of amyloidosis (12,13). In this study, we describe the clinicopathologic findings of four cases of Mayo Clinic patients with AL+AH or AH amyloidosis involving the kidney. In all four cases, we used LMD/MS to characterize and type the amyloid. We also describe and discuss the value of LMD/MS as an important ancillary test for both the diagnosis and typing of other forms of renal amyloidosis.
Materials and Methods
Patients
Renal biopsies from four Mayo Clinic patients with renal Ig heavy chain amyloidosis were evaluated. Classification of amyloidosis was difficult in these four cases. For controls, we also performed LMD/MS studies on two cases of TTR amyloid and eight other cases of renal amyloidosis, four of which were AL amyloid, two that were serum amyloid A (SAA) amyloid, and two that were fibrinogen A α-chain amyloid. The Institutional Review Board at the Mayo Clinic approved the study.
Specimen Preparation and LMD/MS Proteomic Analysis
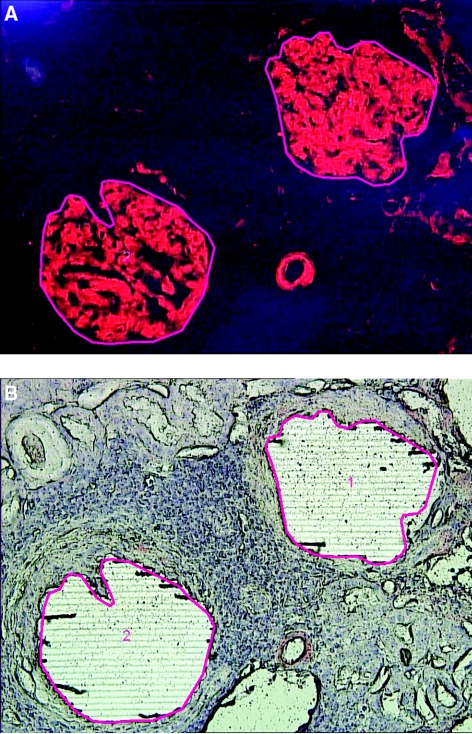
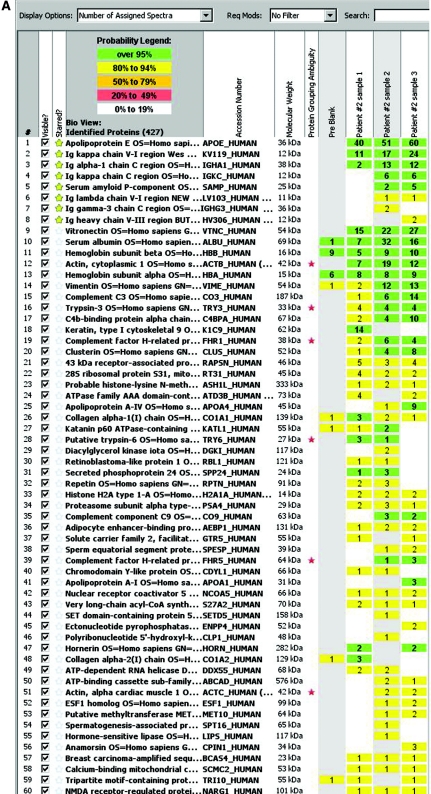
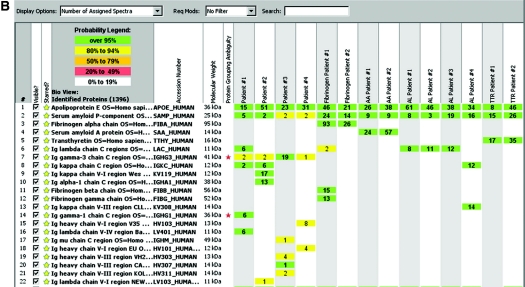
The methods have previously been published (12–14). Briefly, for each case, 10-μm-thick sections of formalin-fixed paraffin-embedded tissues were stained with Congo red. Glomeruli with positive Congo red areas viewed under a fluorescence light source appeared bright red. The Congo red deposits were identified under fluorescence light and microdissected with LMD. Representative figures of LMD are shown in Figure 1. The glomeruli were selected for LMD as shown by the red line (Figure 1A). Following LMD, there is a vacant space on the slide (Figure 1B). Each microdissection contained an area of 50,000 to 60,000 μm2, and two to four microdissections (typically two glomeruli per slide and two slides in each case) were analyzed for each case. The microdissected material was collected into 0.5-ml microcentrifuge tube caps containing 35 μl Tris/EDTA/0.002% Zwittergent buffer. Microdissected fragments were digested into tryptic peptides overnight and analyzed by liquid chromatography electrospray tandem MS. MS raw data files were queried using three different algorithms (Sequest, Mascot, and X! Tandem), and the results were combined and assigned peptide and protein probability scores in Scaffold (Proteome Software, Portland, OR). For each case, a list of proteins based on peptides identified by MS was generated. Peptide identifications were accepted if they could be established at >90.0% probability as specified by the Peptide Prophet algorithm (15–17). Protein identifications below the 90% confidence level and those with single peptide identification were not considered in our analysis. The Spectra value indicates the total number of mass spectrum collected on the mass spectrometer and matched to the protein using the proteomic software. A higher number of mass spectra is indicative of greater abundance and will typically yield greater amino acid sequence coverage. A higher mass spectra value also indicates a higher confidence in protein identification. Our clinical amyloid testing requires a minimum number of four spectra in all samples before the protein identification will be deemed clinically valid. Figure 2A shows the mass spectrometry results in triplicate of patient 2; the proteins are listed according to the abundance they were present in the sample. Figure 2B shows the mass spectrometry results of all cases based on number of assigned spectra.
Figure 1.
Laser microdissection. (A) Representative figure (patient 4) showing Congo red–stained positive glomeruli (1 and 2) to be microdissected. (B) Vacant space on slide after laser microdissection.
Figure 2.
(A) Scaffold readout of all proteins by spectra of patient 2. MS proteomic data are shown from three samples (1, 2, and 3) prepared from three separate LMDs of Congo red–positive glomeruli. The proteomic data show Igα chain constant region and κ light chains variable and constant region with >95% probability. (B) Representative scaffold readout of proteins of interest for 14 cases of amyloidosis by spectra. The cases are as follows (left to right): four cases of Ig heavy chain amyloid (patients 1 through 4), two cases of fibrogen A-α chain amyloid, two cases of SAA amyloid, four cases of AL amyloid, and two cases of TTR amyloid, respectively. The yellow stars indicate proteins of interest, whereas the red stars indicate protein ambiguity when two proteins share conserved areas.
Results
Clinical and Laboratory Findings
During the period of 2008 to 2009, four cases of heavy chain amyloidosis were diagnosed at the Mayo Clinic. The mean age at time of diagnosis was 52.25 years (range, 36 to 64 years). All four cases were male patients. The mean serum creatinine (Scr) at the time of diagnosis was 1.35 mg/dl (range, 1 to 1.9 mg/dl), and the estimated GFR was >60 ml/min per 1.73 m2 in three cases and 36 ml/min per 1.73 m2 in one case. All patients had proteinuria (2.5 to 12.7 g/d) and microscopic hematuria (Table 1).
Table 1.
Clinical and laboratory findings
| Patient | Age | Gender | Serum Creatinine (mg/dl)a | Estimated GFR (ml/min per 1.73 m2) | Serum Albumin (g/dl) | Urine Protein (g/d) | Hematuria |
|---|---|---|---|---|---|---|---|
| 1 | 64 | M | 1 | >60 | 2.6 | 4.1 | Present dRBC >25% |
| 2 | 59 | M | 1.9 | 36 | 3.7 | 2.5 | Present dRBC <25% |
| 3 | 50 | M | 1.2 | >60 | 3.0 | 3 | Present dRBC >25% |
| 4 | 36 | M | 1.3 | >60 | 1.3 | 12.7 | Present dRBC <25% |
dRBC, dysmorphic RBC.
At time of diagnosis.
All four patients had underlying dysproteinemia. Serum protein immunofixation (SIFE) studies showed monoclonal bands in three of the four patients. It was negative in the fourth patient, who had a known history of multiple myeloma. Bone marrow biopsy showed <10% clonal plasma cells in one case, whereas the other three cases had 10% or more clonal plasma cells, consistent with multiple myeloma (Table 2).
Table 2.
Electrophoresis, free light chains, and bone marrow studies
| Patient | SPEP | SIFE | Free Light Chains (κ, λ, κ/λ ratio) | Bone Marrow |
|---|---|---|---|---|
| 1 | Hypogamma-globulinemia | Small monoclonal λ | 2.29, 36.6, 0.06 | 10% plasma cells, λ light chain-restricted |
| 2 | Small abnormality in beta region | Small monoclonal IgA κ | 3.99, 1.55, 2.57 | 25% plasma cells, κ light chain restricted |
| 3 | Negative | Negative | 1.41, 1.39, 1.01 | 30–40% plasma cells, λ light chain restricted |
| 4 | M spike in gamma region | Monoclonal IgG κ | 1.72, 0.37, 4.64 | <5% plasma cells, κ light chain restricted |
Normal values for free light chains: κ, 0.33 to 1.94 mg/dl, λ, 0.57 to 2.63 mg/dl; κ/λ ratio, 0.26 to 1.65. SPEP, serum protein electrophoresis.
Renal Biopsy Results and LMD/MS Results of Ig Heavy Chain Amyloidosis
Patient 1.
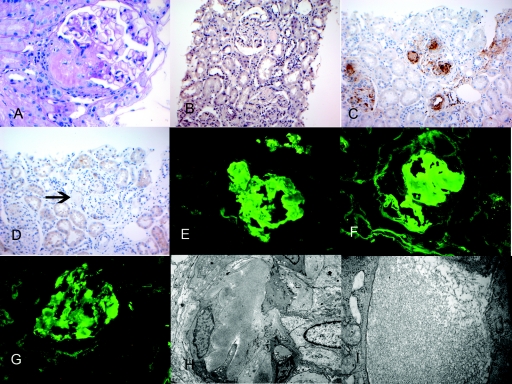
Twenty-one glomeruli were present in the material submitted for light microscopy, of which five were globally sclerosed (Table 3). The glomeruli showed mild segmental mesangial expansion with Periodic acid-Schiff (PAS)–negative material. The vascular pole also contained PAS-negative material. Surprisingly, Congo red stains were only weakly positive. However, immunohistochemistry (IHC) for serum amyloid protein (SAP) was positive, whereas stains for serum amyloid A (SAA) were negative. Immunofluorescence studies showed 2 to 3+ staining for IgG (3+) and λ light chains (3+) in glomeruli and arterial walls. κ light chain staining showed mild patchy (1+) positive staining. Electron microscopy showed accumulation of both glomerular and vascular amyloid. Figure 3 shows the representative light, immunofluorescence, and electron microscopy of patient 1.
Table 3.
Renal biopsy findings
| Patient | Glomeruli: Globally Sclerosed/Total | Tubulo-Interstitial Scarring (%) | Congo Red | Vascular and Interstitial Involvement | Immunofluorescence Microscopy | Electron Microscopy | LMD/MS |
|---|---|---|---|---|---|---|---|
| 1 | 5/21 | 10 | + (weak) | +(V) −(I) | IgG, λ | Amyloid fibrils | Igλ1 + λ |
| 2 | 1/4 | 50 | +++ | +(V) +(I) | IgA, κ | Amyloid fibrils | Igα + κ |
| 3 | 1/7 | 10 | ++ | +(V) −(I) | Not done | Not done | Igλ3 + heavy chains |
| 4 | 2/9 | 10 | +++ | +(V) +(I) | IgA(1+), IgG (1+), IgM (1 to 2+), κ (1+), λ (1+) | Amyloid fibrils | Igλ3 + heavy chains |
V, vessels (arteries and arterioles); I, interstitial.
Figure 3.
Representative biopsy findings of patient 1. (A) Light microscopy showing PAS-negative material at the vascular pole (PAS stain, ×40). (B) Mild positive Congo red stain (×20). (C) Positive SAP stain in the glomeruli and arteriolar walls (×20). (D) Negative SAA stain, arrow points to negative staining (×20); immunofluorescence microscopy shows positive glomerular staining for (E) IgG and (F) λ light chains. (G) κ light chains showed mild (1+) positive staining, and electron microscopy shows randomly oriented amyloid fibrils along arteriolar walls (H) and glomerular capillary walls (I).
LMD/MS analysis of the proteomic profile of patient 1 showed Igγ1 chain constant region and λ light chains constant and variable regions with >95% probability, and six (Igγ1 chain-C region), six (Igλ chain V-IV region), and six (Igλ chain-C region) spectra, respectively (V, variable; C, constant), although a smaller spectra of Igγ3 and Igκ chain-C chain were also noted.
Patient 2.
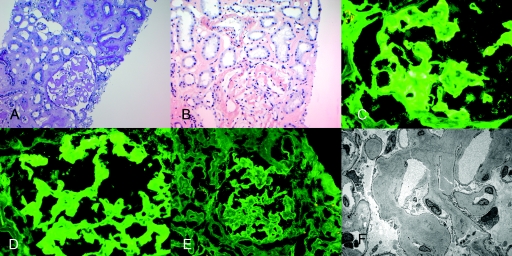
Four glomeruli were present, one of which was globally sclerosed. The glomeruli showed marked acellular mesangial and capillary wall expansion, with PAS-negative material forming mesangial nodules. Congo red stains were positive in the glomeruli, interstitium, and arteries. Immunofluorescence studies showed smudgy mesangial and capillary wall staining for IgA (2 to 3+) and κ light chains (2+), with negative λ light chains. Electron microscopy showed amyloid fibrils in the glomeruli, interstitium, and vessels. Figure 4 shows the representative light, immunofluorescence, and electron microscopy of patient 2.
Figure 4.
Representative biopsy findings of patient 2. (A) Light microscopy showing PAS-negative amyloid material in the glomeruli, interstitium, and vessels (PAS stain, ×20). (B) Positive Congo red stain showing positive staining in the glomeruli, interstitium, and vessels (×20); immunofluorescence microscopy shows positive glomerular staining for (C) IgA and (D) κ light chains. (E) λ light chains are essentially negative. (F) Electron microscopy shows randomly oriented amyloid fibrils in the glomerulus.
LMD/MS analysis of the proteomic profile of patient 2 showed Igα chain constant region and κ light chains variable and constant regions with >95% probability and 13 (Igα-1 chain C region), 17 (Igκ-V-I region), and 6 (Igκ-C region) spectra, respectively.
Patient 3.
Seven glomeruli were present, one of which was globally sclerosed. The glomeruli showed acellular mesangial and capillary wall expansion, with PAS-negative material forming mesangial nodules. Congo red stains were positive in the glomeruli and vessels. Tissue for immunofluorescence and electron microscopy studies was not available. IHC studies showed faint positive staining for SAP, whereas SAA was negative, and no definitive staining was seen for κ or λ light chains.
LMD/MS analysis of the proteomic profile of patient 3 showed Igγ3 chain constant region and heavy chains variable region III with >95% probability and 19 (Igγ3-C region) and 1 (Ιg heavy chain V-III) spectra, respectively.
Patient 4.
Nine glomeruli were present, of which two were globally sclerosed. The glomeruli showed acellular mesangial and capillary wall expansion, with PAS-negative material forming mesangial nodules. Congo red stains were positive in the glomeruli, interstitium, and along vessels. Immunofluorescence microscopy showed mesangial and capillary wall staining for IgA (1+), IgG (1+), and IgM (1 to 2+), whereas κ and λ light chain staining was of equal intensity (1+). IHC studies showed positive staining for SAP, whereas SAA was negative, as were λ and κ light chains. Electron microscopy showed amyloid fibrils in the glomeruli.
LMD/MS analysis of the proteomic profile of patient 4 showed predominantly two different regions of heavy chains variable region I and III and Igγ3 chain constant region and with 94% probability each, with 8 and 4 (Ιg heavy chain V-I region and Ιg heavy chain V-III region, respectively) and 1 (Igγ3 C region) spectra, respectively.
LMD/MS Results of Other Forms of Amyloidosis
For controls, we performed LMD/MS on eight cases of renal amyloidosis and two cases of TTR amyloidosis. The breakup of renal amyloidosis was as follows: two cases of fibrinogen A α-chain amyloidosis, four cases of AL amyloidosis, and two cases of renal SAA amyloid.
The proteomic profile of both the cases of fibrinogen A α-chain amyloidosis (labeled as fibrinogen patients 1 and 2) showed fibrinogen A α-chain, all with >95% probability and 96 and 23 spectra, respectively, and the absence of immunoglobulins and heavy or light chains. In fibrinogen patient 1, fibrinogen β and γ chains were also noted.
The proteomic profile of both cases of SAA amyloidosis (labeled as AA patients 1 and 2) showed serum amyloid protein A, all with >95% probability and 24 and 57 spectra, respectively, and the absence of immunoglobulins and heavy or light chains.
The proteomic profile of AL amyloid patients 1, 2, and 3 showed Ig λ chain constant regions (AL amyloid, λ light chain type), whereas AL amyloid patient 4 showed κ chain constant and variable III regions (AL amyloid, κ light chain type), all with >95% probability, with 8, 11, 12, 12, and 14 unique spectra, respectively.
The proteomic profile of both patients (labeled TTR patients 1 and 2) with TTR amyloid show transthyretin, all with 100% probability and 17 and 35 spectra, respectively, and the absence of immunoglobulins and heavy or light chains. In addition, amyloid P component (SAP), apolipoprotein E, and A-IV (data not shown) were also present in all cases of amyloidosis.
The renal biopsy findings of all four Ig heavy chain amyloid cases are summarized in Table 3. Figure 2A shows the MS proteomic spectra of 60 proteins identified in triplicate samples (each representing one microdissection) in patient 2, whereas Figure 2B compares the representative MS proteomic spectra of amyloid proteins of interest in all 14 amyloid cases, including Ig heavy chain amyloidosis, and all of the control cases.
Renal Biopsy Diagnosis
Patient 1.
Renal amyloidosis, AH (Ig γ1), and AL (λ).
Patient 2.
Renal amyloidosis, AH (Ig α), and AL (κ).
Patient 3.
Renal amyloidosis and AH (Ig γ3 and heavy chain variable region).
Patient 4.
Renal amyloidosis and AH (Ig γ3 and heavy chain variable region).
Treatment and Follow-up
Patient 1.
A bone marrow biopsy showed 10% λ-restricted plasma cells. SIFE showed a monoclonal λ with λ free light chain (FLC) of 36.6 mg/dl and κ FLC of 2.29 mg/dl. The patient was started on bortezomib and dexamethasone. Hematologic complete response was achieved after six doses (λ FLC = 2.41 mg/dl). Serum IgG decreased from 623 to 369 mg/dl (normal, 600 to 1500 mg/dl). Partial renal response was achieved because proteinuria was reduced from 4.1 to 1.8 g/d, whereas Scr remained stable at 1.1 mg/dl. Seven months after diagnosis, he has been off treatment for 2 months, and clinical parameters have remained stable.
Patient 2.
A bone marrow biopsy showed 25% κ-restricted plasma cells. A monoclonal IgAκ was found in the serum and urine. The serum IgA level was 878 mg/dl (normal, 50 to 400 mg/dl) and κ FLC was 3.99 mg/dl with a κ/λ ratio of 2.57 (normal, 0.26 to 1.65). Proteinuria was 2.5 g/d and Scr was 1.9 mg/dl. The patient was treated with autologous stem cell transplantation (ASCT) and achieved a very good partial response hematologically, as his κ plasma cells were reduced to <5% in the bone marrow, and IgA was reduced to 230 mg/dl, with a normalized κ/λ ratio (0.9). He relapsed 11 months after stem cell transplantation and was started on bortezomib and dexamethasone. Hematologic response was achieved, but renal function continued to decline, with the most recent Scr at 6.3 mg/dl.
Patient 3.
A bone marrow biopsy showed 30 to 40% λ-restricted plasma cells. The patient was treated with lenalidomide, bortezomib, and dexamethasone and achieved very good partial response after six cycles. Proteinuria was reduced from 3 to 1 g/d. ASCT was performed, followed by lenalidomide maintenance. Twelve months after diagnosis, proteinuria was down to 0.29 g/d, and Scr was 1.2 mg/dl.
Patient 4.
A bone marrow biopsy showed 5% κ-restricted plasma cells, and a monoclonal IgGκ was identified in the serum and urine. Serum M-spike was 0.4 mg/dl. Proteinuria was 12.7 g/d, and Scr was 1.3 mg/dl. Serum IgG was 735 mg/dl, and κ FLC was 1.72 mg/dl, with a κ/λ ratio of 4.64. Hematologic response was achieved after ASCT, with the κ/λ ratio normalizing to 1.26. Proteinuria was stable at 11.1 g/d, and Scr was 1.0 mg/dl 12 months after ASCT.
Discussion
Accurate typing of amyloid is mandatory because the treatment modalities of various types of amyloid are very different. Renal amyloidosis can at times be easy to classify into AL and AA types depending on immunofluorescence and immunohistochemistry studies. However, typing of some cases of renal amyloidosis can be extremely difficult. In this study, we showed that LMD/MS is a useful and sensitive technique for the diagnosis of amyloid and for accurate typing of the amyloidosis, particularly problematic cases of amyloid.
To show the usefulness of LMD/MS in typing renal amyloidosis, we presented four cases of renal amyloidosis that were diagnostically challenging. The diagnostic problems faced in each case is as follows: patient 1, Congo red stains were only weakly positive, whereas immunofluorescence studies showed IgGλ staining, raising the possibility of a monoclonal immune deposits with fibrillary substructure (or even a fibrillary glomerulonephritis); patient 2, the predominant staining was for IgAκ, and although Congo red stains were strongly positive, amyloid staining for IgA has rarely been reported in the literature (11); patient 3, Congo red stains were positive, but IHC studies showed equal staining for κ and λ light chains; patient 4, Congo red stains were positive, but immunofluorescence studies showed weak (1 to 2+) staining for all immunoglobulins including IgA, IgG, and IgM, with weak (1+) but equal intensity staining for κ and λ light chains. In all four cases, IHC staining for SAA protein was negative, whereas SAP protein was positive. Furthermore, three of the four cases showed monoclonal bands in SIFE studies, whereas patient 3, with negative SIFE studies, had a history of multiple myeloma.
All four cases were further analyzed using LMD/MS methods to determine the subtypes, which showed Ig heavy chain amyloidosis with or without light chains. The heavy chain amyloid consisted of either Igα or Igγ constant region along with heavy chain constant region or variable regions. Thus, by using LMD/MS, we were able to accurately type the four cases of amyloidosis into AH or AL+AH amyloidosis. Regarding treatment of AH or AL+AH amyloidosis, the preliminary results have been encouraging in three of the four patients, with a relapse noted in one patient after ASCT, although hematologic response was achieved with chemotherapy. However, larger studies with longer follow-up are needed.
For controls, we also performed LMD/MS studies in cases of renal AL, SAA, fibrinogen A α-chain renal amyloidosis, and TTR amyloidosis. In AL amyloidosis, as expected, we found light chains (constant or variable regions), whereas in SAA renal amyloid, light or heavy chains were absent; instead, SAA protein was present. On the other hand, proteomic data from patients with fibrinogen A α-chain renal amyloidosis and TTR amyloidosis showed fibrinogen α-chain and TTR, respectively, and the absence of immunoglobulins and heavy or light chains. Thus, LMD/MS is also useful in typing other less common types of amyloid, including fibrinogen A α-chain amyloidosis (5), TTR amyloidosis (12), and leukocyte chemotactic factor 2 amyloidosis (data not shown) (12). Furthermore, in one case of recurrent amyloidosis in the renal allograft, LMD/MS studies were first to show the presence of fibrinogen α chain in the glomeruli of the renal biopsy specimens even before the Congo red stain was positive, suggesting that LMD/MS are very sensitive in detecting early amyloidosis (18).
It should be pointed out the microdissected glomerular tissue does not contain only amyloid fibrils but also contains other glomerular components. However, microdissected samples of normal glomeruli do not contain any of the proteins associated with amyloid, as we have previously shown by microdissecting day 0 post-transplant protocol biopsies (14). Thus, the presence of amyloid proteins such as SAP, SAA, TTR, Apo-lipoproteins, fibrinogen A-α, or leukocyte chemotactic factor 2 should be interpreted as abnormal, and the presence of specific amyloid proteins helps in typing the amyloid. It should also be pointed out that rare hereditary and familial forms of amyloid are easily typed by LMD/MS because of the uniqueness of the proteins present in these forms of amyloidosis. In our routine practice at the Mayo Clinic, we do not typically use LMD/MS for amyloid cases that are easily diagnosed and typed on renal biopsy, such as AL and SAA amyloid. However, we perform LMD/MS studies in cases where the renal biopsy cannot accurately type the amyloid for a variety of reasons. This includes not only the familial and hereditary forms of amyloid but also amyloid with a heavy chain component and in cases where tissue is suboptimal. Because the technique has become easier and more routine, we are performing more LMD/MS studies, often just to confirm the type of amyloid. We had a recent case of SAA amyloid on renal biopsy in an 8-year-old boy with hepatitis B. It was so unusual that we performed LMD/MS studies just to make sure we were not missing anything and whether there was any other form of amyloid present (data not shown).
Fibrillary glomerulonephritis is an entity with fibrillary deposits in the glomeruli. The entity is different from amyloidosis in that the fibrillary deposits are Congo red negative, are typically made up of polyclonal IgG, and measure approximately 18 to 20 nm in thickness (19). Occasionally, it is difficult to distinguish fibrillary glomerulonephritis from amyloidosis. In such cases, LMD/MS is a very useful technique that helps distinguish the two conditions; the presence of SAP proteins, Ig γ (constant region), a heavy chain component with or without a light chain component, and accompanying Apo lipoproteins favor heavy chain amyloidosis over fibrillary glomerulonephritis (data not shown).
Conclusions
To summarize, this study showed that LMD- and MS-based proteomic analysis is a useful and powerful technique for diagnosis and accurate typing of amyloidosis. One of the most practical aspects of LMD/MS studies is that it uses formalin-fixed paraffin-embedded tissue instead of requiring fresh, frozen, or other specially stored tissue samples. As a result, archival material can easily be retrieved for these studies. Problematic amyloid cases, such as those with equivocal Congo red staining (or lack of polarization), equivocal or negative light chain staining by immunofluorescence, amyloid with a heavy chain component, and rare forms including hereditary amyloidosis such as fibrinogen A α-chain amyloidosis, TTR, and leukocyte chemotactic factor 2 amyloidosis fall into a group of amyloidosis that can be accurately typed by LMD/MS. In addition, LMD/MS can be extremely useful in differentiating fibrillary glomerulonephritis from amyloidosis in cases where there are pathologically overlapping features. Finally, LMD/MS is a powerful tool that will not only allow us to accurately type various forms of amyloidosis but will aid in the understanding and diagnosis of other renal diseases (20).
Disclosures
None.
Footnotes
Published online ahead of print. Publication date available at www.cjasn.org.
References
- 1. Dember LM: Amyloidosis-associated kidney disease. J Am Soc Nephrol 17: 3458–3471, 2006 [DOI] [PubMed] [Google Scholar]
- 2. Merlini G, Bellotti V: Molecular mechanisms of amyloidosis. N Engl J Med 349: 583–596, 2003 [DOI] [PubMed] [Google Scholar]
- 3. Gillmore JD, Lachmann HJ, Rowczenio D, Gilbertson JA, Zeng C-H, Liu Z-H, Li L-S, Wechalekar A, Hawkins PN: Diagnosis, pathogenesis, treatment, and prognosis of hereditary fibrinogen A{alpha}-chain amyloidosis. J Am Soc Nephrol 20: 444–451, 2009 [DOI] [PMC free article] [PubMed] [Google Scholar]
- 4. Lachmann HJ, Booth DR, Booth SE, Bybee A, Gilbertson JA, Gillmore JD, Pepys MB, Hawkins PN: Misdiagnosis of hereditary amyloidosis as AL (primary) amyloidosis. N Engl J Med 346: 1786–1791, 2002 [DOI] [PubMed] [Google Scholar]
- 5. Miller DV, Dogan A, Sethi S: New-onset proteinuria with massive amorphous glomerular deposits. Am J Kidney Dis 55: 749–754, 2010 [DOI] [PubMed] [Google Scholar]
- 6. Picken M: Immunoglobulin light and heavy chain amyloidosis AL/AH: Renal pathology and differential diagnosis. Contrib Nephrol 153: 135–155, 2007 [DOI] [PubMed] [Google Scholar]
- 7. Eulitz M, Weiss DT, Solomon A: Immunoglobulin heavy-chain-associated amyloidosis. Proc Natl Acad Sci USA 87: 6542–6546, 1990 [DOI] [PMC free article] [PubMed] [Google Scholar]
- 8. Masahide Y, Tomohisa F, Takahiko T, Fuyuki K, Kanji Y, Masayuki M, Hisashi S, Yoshinobu H, Kei-ichi H, Shu-ichi I: A patient with severe renal amyloidosis associated with an immunoglobulin Î3-heavy chain fragment. Am J Kidney Dis 43: e23–e28, 2004 [DOI] [PubMed] [Google Scholar]
- 9. Solomon A, Weiss DT, Murphy C: Primary amyloidosis associated with a novel heavy-chain fragment (AH amyloidosis). Am J Hematol 45: 171–176, 1994 [DOI] [PubMed] [Google Scholar]
- 10. Nasr SH, Colvin R, Markowitz G: IgG1[lambda] light and heavy chain renal amyloidosis. Kidney Int 70: 7, 2006 [DOI] [PubMed] [Google Scholar]
- 11. Nasr S, Lobritto S, Lauring B, Arend L, D'Agati V, Markowitz G: A rare complication of monoclonal gammopathy. Am J Kidney Dis 40: 867–871, 2002 [DOI] [PubMed] [Google Scholar]
- 12. Vrana JA, Gamez JD, Madden BJ, Theis JD, Bergen HR, III, Dogan A: Classification of amyloidosis by laser microdissection and mass spectrometry-based proteomic analysis in clinical biopsy specimens. Blood 114: 4957–4959, 2009 [DOI] [PubMed] [Google Scholar]
- 13. Rodriguez FJ, Gamez JD, Vrana JA, Theis JD, Giannini C, Scheithauer BW, Parisi JE, Lucchinetti CF, Pendlebury WW, Bergen HR, III, Dogan A: Immunoglobulin derived depositions in the nervous system: novel mass spectrometry application for protein characterization in formalin-fixed tissues. Lab Invest 88: 1024–1037, 2008 [DOI] [PubMed] [Google Scholar]
- 14. Sethi S, Gamez JD, Vrana JA, Theis JD, Bergen HR, III, Zipfel PF, Dogan A, Smith RJH: Glomeruli of dense deposit disease contain components of the alternative and terminal complement pathway. Kidney Int 75: 952–960, 2009 [DOI] [PMC free article] [PubMed] [Google Scholar]
- 15. Choi NH, Nakano Y, Tobe T, Mazda T, Tomita M: Incorporation of SP-40,40 into the soluble membrane attack complex (SMAC, SC5b-9) of complement. Int Immunol 2: 413–417, 1990 [DOI] [PubMed] [Google Scholar]
- 16. Nesvizhskii AI, Keller A, Kolker E, Aebersold R: A statistical model for identifying proteins by tandem mass spectrometry. Anal Chem 75: 4646–4658, 2003 [DOI] [PubMed] [Google Scholar]
- 17. Keller A, Nesvizhskii AI, Kolker E, Aebersold R: Empirical statistical model to estimate the accuracy of peptide identifications made by MS/MS and database search. Anal Chem 74: 5383–5392, 2002 [DOI] [PubMed] [Google Scholar]
- 18. Sethi S, Fervenza F, Miller D, Norby S, Leung N: Recurrence of amyloidosis in a kidney transplant. Am J Kidney Dis 56: 394–398, 2010 [DOI] [PubMed] [Google Scholar]
- 19. Alpers CE, Kowalewska J: Fibrillary glomerulonephritis and immunotactoid glomerulopathy. J Am Soc Nephrol 19: 34–37, 2008 [DOI] [PubMed] [Google Scholar]
- 20. Sedor JR: Tissue proteomic: A new investigative tool for renal biopsy analysis. Kidney Int 75: 876–879, 2009 [DOI] [PubMed] [Google Scholar]


