

Abstract
Cholera toxin (CT) causes the massive secretory diarrhea associated with epidemic cholera. To induce disease, CT enters the cytosol of host cells by co-opting a lipid-based sorting pathway from the plasma membrane, through the trans-Golgi network (TGN), and into the endoplasmic reticulum (ER). In the ER, a portion of the toxin is unfolded and retro-translocated to the cytosol. Here, we established zebrafish as a genetic model of intoxication and examined the Derlin and flotillin proteins, which are thought to be usurped by CT for retro-translocation and lipid sorting, respectively. Using antisense morpholino oligomers and siRNA, we found that depletion of Derlin-1, a component of the Hrd-1 retro-translocation complex, was dispensable for CT-induced toxicity. In contrast, the lipid raft–associated proteins flotillin-1 and -2 were required. We found that in mammalian cells, CT intoxication was dependent on the flotillins for trafficking between plasma membrane/endosomes and two pathways into the ER, only one of which appears to intersect the TGN. These results revise current models for CT intoxication and implicate protein scaffolding of lipid rafts in the endosomal sorting of the toxin-GM1 complex.
Introduction
Cholera toxin (CT) is an AB5-subunit toxin responsible for the massive secretory diarrhea seen in epidemic cholera. As for most toxins, CT must gain access to the cytosol of host cells to cause disease. The strategy employed by CT is to bind ganglioside GM1 in the plasma membrane (PM) via the B-subunit (CTB). GM1 carries the toxin retrograde through endosomes, the trans-Golgi network (TGN), and likely all the way into the ER (1, 2). In the ER, a portion of the A-subunit (CTA), the A1-chain, crosses to the cytosol by co-opting the machinery that retro-translocates terminally misfolded proteins for degradation by the proteasome (termed ER-associated degradation [ERAD]; refs. 3, 4). The A1-chain refolds in the cytosol and activates adenylate cyclase to increase cAMP. The mechanisms for lipid sorting and ERAD usurped by CT are fundamental to eukaryotic cell biology but remain incompletely understood. To explore how CT exploits these pathways in an unbiased way, we used the zebrafish as a model because it is amenable to genetic screens. Here, we show that CT intoxicates zebrafish embryos by hijacking the same basic mechanisms used in mammalian cells and examine the dependence of CT toxicity on two families of proteins implicated in toxin action: the flotillins and Derlins. These proteins have emerged as important components of lipid-based trafficking and ERAD, respectively.
There is evidence that GM1 sorts CT retrograde from PM to ER by association with lipid rafts (2, 5–8). Lipid rafts are cooperative self-assemblies of lipids and proteins that influence various aspects of membrane dynamics and signal transduction (9, 10). The flotillins/reggies are lipid-modified proteins that possess putative hydrophobic membrane-associating domains similar to the caveolins and may operate as scaffold or coat proteins essential for lipid raft structure and function (11). This family of proteins was first identified in regenerating neurons of the optic nerve in fish, where they are referred to as reggies (12) and shortly after found in detergent-resistant membrane fractions from mammalian cells, where they were termed flotillins (13). The flotillins/reggies reside as homo- and hetero-oligomers (14, 15) on the cytosolic leaflet of the PM, PM-proximal vesicles, recycling and late endosomal compartments, multivesicular bodies, lysosomes, and phagosomes of macrophages (14, 16–18). They cofractionate with CTB in detergent-resistant membrane fractions, the biochemical correlate of lipid rafts (11, 13). Depletion of flotillin-1/reggie-2 decreases the internalization of CTB-GM1 complexes by non-clathrin-mediated endocytosis (19), but other mechanisms of toxin endocytosis remain intact, and it is not known whether, or how, the flotillins/reggies affect GM1 (lipid) sorting or CT function.
In the ER, the enzymatically active portion of the A-subunit, the A1-chain, is unfolded, disassociated from the B-subunit, and released into the ER lumen by protein disulfide isomerase (PDI) (20, 21). Presumably, the unfolded A1-chain is targeted back to the ER membrane for transport to the cytosol through a protein-conducting channel, still not yet conclusively identified (4, 21). In yeast, misfolded lumenal proteins are processed for retro-translocation by a core multiprotein complex containing the Derlin-1 homolog Der1p and the E3 ligase Hrd1p (the ERAD-L pathway) (22, 23). In mammalian cells, the pathways for retro-translocation are more diversified (4), but the Derlin and Hrd1/gp78 proteins are required for retro-translocation of all lumenal ERAD substrates so far tested (24, 25). Recent studies, in fact, suggest that Derlin-1 and Hrd1 are required for retro-translocation of the A1-chain (26–28). The CT A1-chain, however, does not follow all of the general rules for retro-translocation (29, 30), and the possibility remains that the A1-chain may use a different pathway.
In this article, we establish the zebrafish as a genetic model for understanding the cellular pathways usurped by CT and discover a function for the flotillin/reggie proteins in trafficking the CT-GM1 complex between PM/endosomes and two pathways to the ER. Unexpectedly, only one pathway appears to intersect the TGN. We also discovered that Derlin-1 and -2 are fully dispensable for retro-translocation of the A1-chain. The results revise current models for intoxication and implicate cytoplasmic protein scaffolds of lipid rafts in the endosomal sorting of the toxin-GM1 complex (31, 32).
Results
CT intoxicates zebrafish by binding GM1 and crossing the ER membrane.
Dechorionated zebrafish embryos exposed to CT from 16–20 hours after fertilization (hpf) until 48 or 72 hpf developed an overt phenotype of swelling of the cardial cavity and digestive tract, heart and circulatory dysfunction, hypermotility, growth stunting, and sometimes curvature of the tail (Figure 1 and data not shown). This phenotype had 100% penetrance within the population and was induced by CT at nanomolar concentrations. Zebrafish were sensitive to CT only when exposed before 20 hpf (Supplemental Figure 1A; supplemental material available online with this article; doi: 10.1172/JCI42958DS1). Toxicity was evident 6–8 hours after intoxication (by 26 hpf; delayed eye and head development and curvature of the tail) and accentuated throughout development to 72 hpf (Supplemental Figure 1B).
Figure 1. CT induces an overt phenotype in zebrafish embryos.
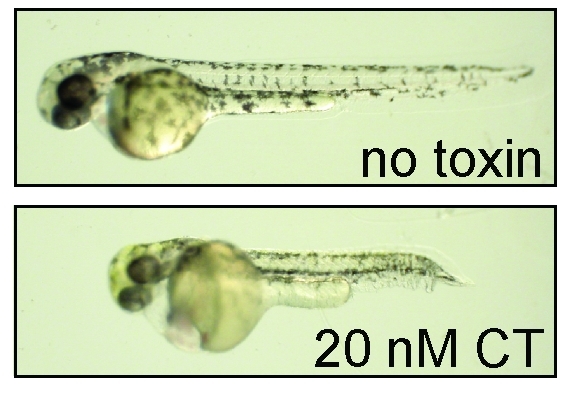
Dechorionated embryos (16-hpf) were incubated in embryo water with or without 20 nM CT for 2 days (n = 72, no toxin; n = 64, CT; each image represents 100% of the population).
Expression of GM1 in zebrafish embryos was confirmed in two ways. First, extracts of embryos exposed to WT CT or to the mutant G33D, which cannot bind GM1 (33), were analyzed for CTB binding by immunoblot. CTB was only detected in protein extracts from embryos exposed to WT CT (Figure 2A, lane 4). Second, thin-layer chromatography of ganglioside extracts from 16-hpf embryos revealed two prominent resorcinol-staining bands that comigrated closely with purified GM1 from bovine brain (Figure 2B, left panel, lane 2, open arrowheads). To show that one or both of these bands are likely GM1 and that they bind CT, we ran the same ganglioside extracts on alumina-backed silica plates and performed ligand blotting using CTB. The overlay with CTB shows strong and specific toxin binding to a single band, now migrating on the silica-backed plates exactly with purified GM1 from bovine brain (Figure 2B right panel, lane 6, arrow). Thus, zebrafish embryos likely express the toxin’s receptor GM1, and it can bind CT. We also performed confocal microscopy on live embryos exposed to fluorophore-labeled CTB and localized the bulk of toxin uptake to surface epithelial mitochondrion-rich cells (MRCs), the depletion of which correlated with toxin resistance (Supplemental Figure 2 and Supplemental Video 1). It is of note that these cells regulate salt and water homeostasis in the embryo (34); however, intoxication of other cell types might contribute to the overall phenotype observed (see below).
Figure 2. Zebrafish embryos model the pathways co-opted by CT to induce toxicity in mammalian cells.

(A) Protein lysates were prepared from pools of five 16-hpf embryos incubated 1 hour with no toxin (control), 5 nM WT CT, or 5 nM G33D and analyzed for CTB and β-actin by immunoblot. Purified CTB was loaded as standard (std). (B) Total gangliosides from 16-hpf zebrafish embryos (embryo extract) or bovine brain gangliosides (BBG) were analyzed by TLC along with GM1 authentic standard (left panel). The GM1 standard and embryo extract were combined and also analyzed (lane 4). Filled arrowheads indicate resorcinol-staining GM1 band in GM1 standard and BBG. A portion of these extracts were subjected to CTB overlay immunoblot analysis (right panel). (C) Embryos (16-hpf) from 3 parental zebrafish strains (AB, Tü, and WIK) were incubated with embryo water alone (control) or with the indicated toxins at 5 nM for 48 hours. Only WT CT produced in V. cholerae or E. coli (CT and rCT, respectively) induced toxicity (asterisks). Toxin schematics at left indicate mutations in the G33D B-subunit and R192G A-subunit. n ≥ 50 for each intoxicated strain; images are representative of at least 95% of the population. (D) Embryos were intoxicated as indicated (5 nM) or mock treated (no toxin) as in C and assayed at 48 hpf for total cAMP content by ELISA. Results from pools of 10 embryos/condition from 3 independent experiments are represented as mean ± SD. (E) Embryos (16-hpf) were treated with vehicle (control; 0.01% DMSO, n = 85) or 10 μM forskolin (n = 57) and imaged at 62 hpf (images representative of 100% of each population).
To test whether toxin action in zebrafish requires transport into the ER and retro-translocation as in mammalian cells, we utilized G33D and the mutant toxin R192G, which contains a WT B-subunit but a mutated A-subunit that cannot unfold in the ER or retro-translocate (20, 35). Only the WT toxins induced toxicity in embryos from 3 different fish strains (Figure 2C, asterisks). Enzymatic action of the A1-chain in the cytosol of CT-treated embryos was confirmed by ELISA assay for total cAMP. Here, zebrafish embryos were exposed to WT CT, CTB, or R192G and analyzed for cAMP content. Only WT CT induced a cAMP response (Figure 2D). We also found that the cAMP agonist forskolin induced an overt phenotype similar to that of WT CT (Figure 2E and Supplemental Figure 1B), suggesting that cAMP mediates the toxicity, presumably by causing pleiotropic dysfunctions during embryonic development. Thus, zebrafish model the intracellular pathways required for intoxication of mammalian cells: CT must bind GM1 to enter the ER, and the A1-chain must cross the ER membrane to activate adenylate cyclase.
Derlin-1 and -2 are not required for CT toxicity in zebrafish embryos and Cos-1 cells.
Zebrafish possess a Derlin-1 homolog 88% identical to the human Derlin-1 protein. Derlin-1 is expressed in zebrafish embryos, as evidenced by the detection in 72-hpf embryos of a single band of approximately 22 kDa by immunoblot using an antibody raised against human Derlin-1 (Figure 3A, lane 1, and see Supplemental Figure 3B). The zebrafish genome also encodes for a Derlin-2 homolog 90% identical to the human protein, but antibodies raised against human Derlin-2 did not react to any specific protein in embryo lysates. We also found no evidence for transcription of derl2 in embryos by RT-PCR or quantitative real-time PCR (qRT-PCR) (data not shown). Thus, zebrafish embryos express Derlin-1 but not Derlin-2.
Figure 3. Derlin-1 is dispensable for CT function in zebrafish embryos and retro-translocation of the A1-chain in mammalian cells.

(A) Protein extracts from 5 controls (Ctrl) or Derlin-1 morphants (72-hpf) were immunoblotted for Derlin-1 and β-actin. (B) Control or Derlin-1 morphants were intoxicated or not with 1.5 nM CT at 16- to 18-hpf and imaged at 72 hpf. Insets to scale with top panels. (C) Protein extracts from Cos-1 cells transfected with the indicated siRNA (Der1* indicates combination of 2 siRNAs) were subject to immunoblot as in A. (D) qRT-PCR for DERL1 from control and Der1 siRNA–treated cells (mean ± SD, n = 3). (E) Cytosolic and membrane fractions were prepared from Cos-1 cells transfected with the indicated siRNA and intoxicated with WT or R192G CT. Immunoblots were probed with CTA, CTB, BiP, or β-actin antibodies. Purified toxin standards, A1-chain, and uncleaved A1/A2-chain complex are indicated. (F) MFI of GFP expression in Cos-1 cells transfected with CFTRΔF508-GFP and control or Der1 siRNA. Maximal CFTRΔF508-GFP accumulation is achieved by treatment with the proteasome inhibitor MG132 (10 μM; Ctrl + MG132), and these values were set to 100% in each experiment. Blue bars indicate means, and error bar indicates variance of Ctrl + MG132 samples. (G) Immunoblot of crude protein extracts from samples in F probed with mAbs against CFTR and β-actin. Filled and open arrowheads represent the immature and mature glycosylated forms of CFTR, respectively. (H) Cells transfected with control, Derlin-2 (Der2), or a combination of Derlin-1 and Derlin-2 siRNA were analyzed for Derlin-1 or -2 by immunoblot. (I) Same as E, except cells were transfected with control, Derlin-2, or both Derlin-1 and -2 siRNA.
Zebrafish were depleted of Derlin-1 by using antisense morpholino oligomers complementary to the translational start site of the derl1 mRNA. Protein extracts from these embryos contained virtually no detectable Derlin-1 protein as assessed by immunoblot (Figure 3A, lane 2 vs. 3). Controls were injected with a nonspecific morpholino. Derlin-1 morphants (morpholino recipients) displayed a slight defect in head development by 60 hpf (Supplemental Figure 3A, upper panels), with more severe pleiotropic abnormalities at 96 hpf (stunted head, eye, and jaw morphology; Supplemental Figure 3A, lower panels). All Derlin-1 morphants died by 7 days after fertilization (dpf), illustrating the dependence on Derlin-1 for normal embryonic development in zebrafish. When exposed to CT, all Derlin-1 morphants displayed severe toxicity by 3 dpf (Figure 3B, lower panels; images representative of entire population for each condition). Similar results were obtained using submaximal doses of CT, and in embryos injected with morpholinos against both derl1 and the putative gene product derl2 (data not shown). Thus, Derlin-1 is dispensable for CT function in zebrafish.
To confirm that this result translates to mammalian cells, we transfected Cos-1 cells with two siRNA oligonucleotides against DERL1. This caused a complete loss of detectable Derlin-1 protein as assessed by immunoblot of cell lysates (Figure 3C), and only 14% of DERL1 mRNA remained, as confirmed by qRT-PCR (Figure 3D). We first assayed for toxicity in Derlin-1–depleted cells by measuring cAMP, but depletion of Derlin-1 enhanced the adenylate cyclase response to forskolin, precluding any reasonable interpretation of the response to CT (data not shown). Therefore, we assayed for effects of Derlin-1 on retro-translocation of the A1-chain, measured as the presence of the A1-chain in cytosolic fractions of cells by immunoblot (methods modified from refs. 26, 35). The results show similar or even slightly elevated levels of A1-chain in the cytosolic fractions of cells lacking Derlin-1 (Figure 3E, upper left panel, compare lanes 2 and 3 with lane 1). The A1-chain detected represents a bona fide retro-translocated product, as almost no A1-chain was detected in the cytosol of cells treated with the R192G mutant that travels to the ER but cannot retro-translocate (Figure 3E, lane 4). Also, CTB, which does not retro-translocate, and the ER lumenal protein BiP were detected only in membrane fractions, indicating that intracellular membrane compartments were not damaged and that only the A1-chain was retro-translocated as expected. Immunoblots of membrane fractions for CTA and CTB showed equal amounts of cellular uptake (Figure 3E, 2 upper-right panels, lanes 5–7). Thus, Derlin-1 appears to be dispensable for retro-translocation of the CT A1-chain.
As a positive control, we tested for effects of Derlin-1 depletion on retro-translocation of the mutant cystic fibrosis transmembrane conductance regulator ΔF508 fused to the reporter molecule GFP (CFTRΔF508-GFP). This molecule folds poorly in the ER and is rapidly retro-translocated to the cytosol and degraded by the proteasome, a process dependant on interaction with Derlin-1 (36, 37). Here, we find that in contrast to CTA, retro-translocation of CFTRΔF508-GFP was attenuated in Cos-1 cells lacking Derlin-1, as assessed by rescue of CFTRΔF508-GFP expression gauged both by flow cytometry for GFP fluorescence (Figure 3F and Supplemental Figure 3C) and by immunoblot against CFTR (Figure 3G). Thus, Derlin-1 suppression, under the conditions used in these studies, affects the retro-translocation of a different ERAD substrate in Cos-1 cells.
Because Derlin-2 might substitute for Derlin-1 in the retro-translocation of some ERAD-L substrates (24), the studies on CT were repeated in Cos-1 cells depleted of Derlin-2 and of Derlin-1 and -2 together. The same results were obtained (Figure 3, H and I), indicating that neither Derlin-1 nor Derlin-2 is required for retro-translocation of the A1-chain.
Flotillin-1 and -2 (reggie-2 and -1) are required for CT toxicity in zebrafish embryos and Cos-1 cells.
Zebrafish possess two reggie-2/flotillin-1 homologs (reggie-2a/flotillin-1a and reggie-2b/flotillin-1b) that are 79% and 78% identical to the human flotillin-1 protein (38). For clarity in this article, we use the reggie/flotillin designation for our studies in zebrafish and the flotillin designation for our studies on mammalian cells. Immunoblot analysis of embryo protein extracts using a mAb against human flotillin-1 revealed a single prominent band migrating at approximately 47 kDa, consistent with the size of mammalian flotillin-1 (Figure 4A). Reggie-2/flotillin-1 was not detected in protein extracts from embryos injected with a morpholino that targets the translational start sites of both zebrafish reggie-2a/flot1a and reggie-2b/flot1b homologs (Figure 4, A and D). In contrast to the Derlin-1 morphants, no overt developmental defects were observed for up to 7 dpf (data not shown). Immunoblots to gauge flotillin-1 depletion in all subsequent assays are shown in Supplemental Figure 4.
Figure 4. Loss of reggie-2/flotillin-1 in zebrafish embryos confers resistance to CT.

(A) An identical approach was used as with Derlin-1 (Figure 3), except that the morpholino was specific to the zebrafish reggie-2a/flot1a and reggie-2b/flot1b homologs, and protein extracts were immunoblotted with an anti–human flotillin-1 mAb (mouse kidney extract is positive control). (B) Control and reggie-2/flotillin-1 morphants (16-hpf) were intoxicated with 5 nM CT and imaged at 3 dpf. Three phenotypic categories were defined: no toxicity, resistant, and full toxicity. Percentages indicate the fraction of the population that segregated into each category. Control, n = 48; reggie-2/flotillin-1: n = 51. (C) In single-blind experiments, observers scored populations of control and reggie-2/flotillin-1 morphants that were intoxicated with a range of CT doses into the 3 categories. The results were averaged and reported as the mean percentage of the population represented by each category for each condition (error bars show SD of observer’s assessments; number of embryos/condition are indicated). Results are representative of 3 independent experiments. (D) Uninjected (No inj), control, or reggie-2/flotillin-1 morphants (16-hpf) were exposed to 5 nM CTB for 48 hours and washed, and crude protein extracts (pools of 5 embryos/condition) were analyzed by immunoblot using flotillin-1, β-actin, and CTB antibodies. (E) Control or reggie-2/flotillin-1 morphants intoxicated with 0.5 nM CT at 16 hpf were followed to 6 dpf and grouped into the three indicated categories (data combined from 2 independent experiments).
Initial studies showed that CT (5 nM) caused only minimal swelling of the cardial cavity and digestive tract regions in 70% of the reggie-2/flotillin-1 morphant population, whereas the vast majority of controls displayed full toxicity (Figure 4B; as described above). This result suggests that the embryos depleted in reggie-2/flotillin-1 were partially resistant to CT action. We next performed a dose response analysis with 4 independent and blinded observers scoring embryo phenotype either as no toxicity, resistant, or full toxicity (Figure 4B). At each toxin dose, a much greater fraction of reggie-2/flotillin-1 morphants were scored as resistant, or with no toxicity, as compared with controls (Figure 4C). The apparent ED50 for the induction of full toxicity in zebrafish lacking reggie-2/flotillin-1 was shifted upward by approximately 1.5 logs. The scoring actually underestimates the reggie/flotillin effect, as within each category, the majority of reggie-2/flotillin-1 morphants appeared healthier than the corresponding controls (see Figure 4B, compare left and right columns).
To confirm specificity for reggie-2/flotillin-1, we used a different set of morpholinos directed against the 5′-UTR region of either reggie-2a/flot1a or reggie-2b/flot1b (divergent sequences, see Methods). In this way, we could deplete both homologs together or each separately (Supplemental Figure 5, A and B). Injection of a mixture of both of these morpholinos resulted in resistance to 1.5 nM CT similar to that seen using the original morpholino that targets both homologs (compare Supplemental Figure 5A with Figure 4C). Injection of each morpholino separately revealed that both genes contribute to overall reggie-2/flotillin-1 protein levels (i.e., they are both expressed; Supplemental Figure 5B), and though suppression of each one alone affected toxicity, depletion of reggie-2b/flotillin-1b had the stronger effect on conferring resistance to CT action (Supplemental Figure 5B, bar graphs). This could be a function of higher reggie-2b/flotillin-1b expression than reggie-2a/flotillin-1a in early developing embryos (39). Also, the differential tissue expression patterns of the two genes in zebrafish (39) means that intoxication of more than one cell type may contribute to the overall observed CT phenotype (presumably, one type being MRCs; see Supplemental Figure 2).
Separate studies showed that the forskolin-induced phenotype was similar in control and reggie-2/flotillin-1 morphants (Figure 4C). Thus, the resistance to CT observed in embryos lacking reggie-2/flotillin-1 cannot be explained by defects in downstream cAMP signaling. Nor can it be explained by loss of GM1, as comparable amounts of CTB were bound to control and reggie/flotillin-depleted embryos (Figure 4D). Confocal microscopy showed that MRC numbers appeared unchanged in the reggie-2/flotillin-1 morphants, ruling out MRC loss as an explanation for inhibition of CT action (Supplemental Figure 2J and accompanying legend).
To see whether the effect of reggie/flotillin depletion on toxin action might be amplified at later stages of development, we followed embryos intoxicated with 0.5 nM CT (as in Figure 4C) to 6 dpf. At 6 dpf, control zebrafish displayed 90% mortality, while only 27% mortality was observed in zebrafish lacking reggie-2/flotillin-1 (Figure 4E). Morbidity was also reduced in the reggie-2/flotillin-1 morphant population. Immunoblots of protein extracts showed that the morpholino suppression of reggie-2/flotillin-1 protein was durable and near complete at 6 dpf (Supplemental Figure 4). We also studied embryos depleted in reggie-1/flotillin-2, or in both reggie-2/flotillin-1 and reggie-1/flotillin-2, and found the same degree of CT resistance as in zebrafish lacking only reggie-2/flotillin-1 (Supplemental Figure 5C). This result is likely explained by the finding that suppression of either reggie/flotillin leads to loss of the other (Supplemental Figure 5D; also shown in mammalian cells below and in refs. 40–42). Together, our data show that the reggies/flotillins play a substantial role in CT action in vivo in zebrafish embryos.
To test whether these results translate to mammalian cells and to identify where the flotillins act on the pathways usurped by CT, we suppressed flotillin expression in Cos-1 cells by siRNA. Immunoblots of total protein extracted from cells transfected with siRNAs against human FLOT1 showed greater than 90% loss of flotillin-1 and approximately 80% loss of flotillin-2 protein, similar to previous reports (40–42) (Figure 5A; also see Supplemental Figure 5D). The mechanism by which suppression of either flotillin-1 or flotillin-2 leads to loss of the other is not understood. It should also be noted that FLOT1 siRNA transfection often resulted in approximately 20% fewer cells per culture after 3 days than control siRNA–treated cells. Unlike cells depleted of Derlin-1, Cos-1 cells lacking flotillin-1 and -2 responded normally to activation of adenylate cyclase by forskolin, allowing for assay of toxin function by measurement of cAMP. At 40 and 80 minutes after exposure to CT, the intracellular levels of cAMP in cells lacking flotillin-1 and -2 were decreased 6- and 7-fold, respectively (~85% inhibition, Figure 5B). Thus, as in zebrafish, Cos-1 cells lacking flotillin-1 and -2 were resistant to CT action.
Figure 5. Flotillins are required for CT function in mammalian cells.

(A) Cos-1 cells were transfected with control or flotillin-1 (Flo-1) siRNA, and knockdown was gauged by immunoblot of crude cell lysates using antibodies against flotillin-1 and -2. (B) Cells treated as in A were incubated with buffer (no toxin) or 1 nM CT for the indicated times prior to analysis of intracellular cAMP by ELISA. Data (mean ± SEM; representative of 3 independent experiments) were normalized to forskolin response (~20% less forskolin-induced cAMP in flotillin-1 sRNA–treated cells as compared with controls; see text). (C) Cells transfected with control and flotillin-1 siRNA were incubated with 20 nM CT holotoxin for 90 minutes, and A1-chain retro-translocation was measured as in Figure 3E, except that a combination of CTA and CTB antibodies was used for immunoblot analysis (upper panel).
We confirmed this result by direct assay for retro-translocation of the A1-chain into the cytosol as described above. About 4-fold less A1-chain was found in the cytosol of cells lacking flotillin-1 and -2 compared with controls (Figure 5C, upper panel, lane 1 vs. 2; representative of 3 independent experiments). CTB and the ER lumenal protein BiP were confined to membrane fractions as expected. Pretreatment of Cos-1 cells with the proteasome inhibitor lactacystin had no effect on the results of the retro-translocation assay, showing that the reduced amount of A1-chain in the cytosol of flotillin-depleted cells cannot be explained by enhanced proteasome activity (data not shown).
Flotillin operates at a step in lipid sorting between PM or endosomes and the ER.
We first tested whether cells depleted of the flotillins had decreased binding of CT to GM1 at the cell surface by immunoblot for the A-subunit. We found no difference in toxin binding to cells depleted or not in flotillin-1 (Figure 6A, lane 1 vs. 2). The binding of CT was specific for GM1, as competition by 500-molar excess of CTB eliminated the CTA signal (lanes 3 and 4; the appearance of the CTB oligomer is due to cross-reactivity with the CTA pAb). Endocytic uptake of CT, measured by immunoblot as the mass of internalized toxin after 2 and 10 minutes at 37°C, was also unaffected by flotillin-1 depletion (Figure 6B, lane 5 vs. 6 and 7 vs. 8), consistent with previous reports (19). We also found that CT colocalizes with flotillin-1–GFP at the PM and in endosomes of Cos-1 cells (Supplemental Video 2).
Figure 6. The flotillins affect sorting of CT into two pathways to the ER, only one intersecting the TGN.

(A) Cos-1 cells transfected with control or flotillin-1 siRNA were incubated with CT or CT plus CTB and protein extracts immunoblotted for CTA. (B) Cells transfected as in A were incubated with CT at 37°C for the indicated times. CTB was immunoprecipitated and immunoblotted using anti-CTB pAb. That no CTB was detected in lanes 3 and 4 indicates that virtually all the CTB was removed from the cell surface. Blank lane indicated by x. (C) Phosphorimage (top panels) of control or flotillin-1–depleted cells intoxicated for the indicated times with CTB-GS. Arrow indicates non-glycosylated CTB-GS and arrowhead the glycosylated form. A fraction of the post-IP eluate was analyzed for CTB by immunoblot (third panel). Intact CTB-GS is indicated by arrow (lower-MW forms are degradation products). (D) Immunoblot of post-ConA eluates from control or flotillin-1 siRNA cells intoxicated with CTB-GS. The glycosylated, higher-MW form is indicated by an arrowhead. Non-glycosylated CTB-GS is also present. (E) A fraction of the post-ConA eluates from D were analyzed by silver stain. (F) Phosphorimage of post-ConA eluates from Ctrl or flotillin-1 siRNA–treated cells preincubated with 35S-sulfate and subsequently intoxicated with CTB-GS. Arrow indicates non-glycosylated CTB-GS and arrowhead the glycosylated form. (G) Samples in F were also analyzed by silver stain. (H) Random, intoxicated cells were analyzed for the percentage of cells demonstrating colocalization of fluorescently labeled CTB and PDI at the NE (mean ± SEM; 6 independent experiments for Cos-1 cells and single experiments shown for Bsc-1 and A431 cells; number of cells imaged [n] is indicated). See Methods and Supplemental Video 3.
We next examined whether flotillin depletion affects trafficking of CT in the retrograde pathway using the toxin mutant CTB-GS, which contains tyrosine-sulfation and N-glycosylation motifs that report on toxin entry into the TGN and ER, respectively (2). Depletion of flotillin-1 and -2 caused a small decrease in 35S-sulfation of CTB-GS after 40 and 120 minutes of toxin uptake, indicating a very modest reduction (between 9% and 30%) in transport from PM into the TGN (Figure 6C, arrow). At 120 minutes, a higher-MW 35S band was also evident (arrowhead, lanes 3 and 4), representing the ER N-glycosylated form of CTB-GS as confirmed by cleavage with the endoglycosidase PNGase F (lanes 5 and 6). TCA precipitation of total protein extracts showed that 35S-sulfotransferase activity was unaffected by depletion of flotillin-1 and -2 (Supplemental Figure 6A). The ratio of N-glycosylated to total 35S-sulfated CTB-GS was similar in control and flotillin-depleted cells intoxicated for 120 minutes (calculated by phosphorimaging to be 0.2 and 0.19, respectively; Figure 6C). Thus, depletion of flotillin-1 and -2 modestly inhibited transport of CTB-GM1 complexes between PM and TGN (<1.4-fold), but once the toxin was in the TGN, transport into the ER was unaffected.
The relatively small decrease in transport of CTB-GS to the TGN in flotillin-depleted cells is not sufficient to explain the 4- to 7-fold inhibition of A1-chain retro-translocation or toxicity (Figure 5, B and C). Because the 35S-sulfation–glycosylation assay measures only the fraction of toxin traversing the TGN, it will not detect toxin moving into the ER by another route. Thus, we modified the approach to measure the total amount of CTB-GS transported to the ER by isolating glycosylated proteins on concanavalin A (ConA) sepharose resin and analyzing for glycosylated CTB-GS by immunoblot. These studies showed approximately 5-fold less glycosylated CTB-GS in flotillin-1–depleted cells (Figure 6D, arrowhead; representative of 3 independent experiments), consistent with the magnitude of inhibition seen in the cAMP and retro-translocation assays. N-glycosylation was confirmed by sensitivity to PNGase F (Supplemental Figure 6B). Comparable amounts of total N-glycosylated protein were isolated from flotillin-depleted and control cell lysates by ConA resin (Figure 6E). Thus, CT appears to follow two pathways from PM to ER, only one intersecting the TGN.
To test this interpretation, we performed the same experiment using ConA to isolate the ER fraction (i.e., the mannosylated toxin) of CTB-GS in cells preincubated with 35S-sulfate to label the fraction of toxin moving to the ER via the TGN. If two pathways exist, one dependent on transit through the TGN but relatively unchanged by flotillin depletion and the other bypassing the TGN and sensitive to flotillin depletion, we should find almost no effect of flotillin depletion on the fraction of 35S-labeled N-glycosylated toxin isolated by ConA. On the other hand, if only one pathway exists, the fraction of 35S-labeled N-glycosylated toxin isolated by ConA should be much smaller in cells lacking flotillin (as in the immunoblot analysis shown in Figure 6D). Our results show that flotillin depletion had almost no effect on the mass of radiolabeled CTB-GS isolated by ConA (Figure 6, F and G; 16% and 21% less from 2 independent experiments), consistent with two pathways from PM to ER, one bypassing the TGN.
We also measured PM to ER transport of CTB in Cos-1 cells by confocal microscopy. Toxin entry into the ER was scored as the fraction of cells with fluorescently labeled CTB staining the entire circumference of the nuclear envelope (NE) and colocalized with immunostaining for PDI (43) (Supplemental Video 3). CTB localized to the NE in only 36% of cells lacking flotillin-1 as compared with 80% of control cells (Figure 6H). Furthermore, the mean signal intensity of CTB where it was detectable at the NE of flotillin-depleted cells was only about half that of control cells (data not shown). Similar results were obtained in two other cell types, Bsc-1 and human A431 cells (Figure 6H and Supplemental Figure 4 for analysis of flotillin-1 depletion). These data are consistent with our biochemical studies and indicate inhibition of transport of CTB from the PM to the ER in cells depleted of flotillin-1 and -2.
Discussion
In this article, we establish the zebrafish as a genetic model for the study of the mechanisms of intoxication by CT and present evidence for the mechanism of toxin action that revise current models for toxin entry into host cells.
First, we find that Derlin-1 and -2 are dispensable for retro-translocation of the A1-chain. So far, all ERAD-L substrates in mammalian cells require Derlin for retro-translocation, and this result raises the interesting question of how, or even whether, the A1-chain is recognized as an ERAD-L substrate, as presumed. The A1-chain has a hydrophobic domain already proposed to be involved in retro-translocation (44, 45), and perhaps this domain can enter the ER membrane to interact directly with Hrd1, as for Hmg2p in yeast (46). How Hrd1 might then transfer the A1-chain to the other putative retro-translocation channel Sec61 (47) remains unclear.
Two previous studies suggested a dependence on Derlin-1 for A1-chain retro-translocation (26, 28). One of these studies found that suppression of Derlin-1 in Vero cells caused a loss in toxin function as assessed by cAMP measurement, but this study did not control for the possibility of confounding effects of Derlin-1 depletion on adenylate cyclase activity as we observed here. The other study found that expression of a dominant-negative Derlin-1–YFP fusion protein inhibited retro-translocation of the A1-chain in 293T cells by approximately 80% and 50% after 45 and 90 minutes of intoxication, respectively (26). We also found a modest, approximately 30% inhibition of A1-chain retro-translocation using the Derlin-1–YFP mutant in Cos-1 cells, but only at the early time point (Supplemental Figure 3, D and E). In contrast, suppression of endogenous Derlin-1 and -2 in vitro, and Derlin-1 in vivo, had no effect. Based on these results, we conclude that the Derlins are dispensable for A1-chain retro-translocation. Our view is that overexpression of the dominant-negative Derlin-1–YFP mutant in cultured cells acts on A1-chain retro-translocation either by disrupting the Hrd-1 complex or by nonspecifically disrupting ER function as originally considered (26).
We also discovered a critical function for the flotillin/reggie proteins in sorting the CT-GM1 complex from the PM to the ER. Because trafficking into the TGN was decreased, the sorting step(s) affected by flotillin are localized to the PM or endosome, consistent with the subcellular distribution of the flotillins in mammalian cells (14, 16). Depletion of flotillin-1 does not inhibit the bulk of toxin endocytosis (ref. 19 and this study, but see ref. 48), but it does decrease uptake of CTB into a specialized subset of non-clathrin-dependent endocytic vesicles (19). Thus, it is possible that the flotillins act at the PM to capture a subset of toxin-GM1 complexes for transport through endosomes all the way to the ER, presumably in distinct and stable microdomains that require entry into the cell by non-clathrin-mediated mechanisms. On the other hand, because both clathrin-dependent and clathrin-independent endocytic vesicles deliver cargo to a common early endosomal compartment (49), it is also possible that the decisive sorting step(s) affected by the flotillins in retrograde transport originate within endosomal compartments instead; or that the flotillins act at both locations in the endocytic pathway. Supporting the idea that the flotillins might operate in the endosomal compartment is that ultrastructural studies performed by Glebov et al. showed no evidence for toxin concentration (or for GPI-anchored protein concentration) in flotillin-1–enriched regions of the PM (ref. 19, but see ref. 50 for cross-linked Thy-1 data). With respect to CT, this result may also reflect the fact that not all GM1 molecules can move efficiently retrograde from PM to ER (our unpublished observations).
Importantly, our studies on the flotillins show that CT apparently takes two pathways from the PM to ER, only one intersecting the TGN. We reach this conclusion based on the discrepancy between the large effect of flotillin depletion on toxin entry into the ER and the much smaller effect on entry into the TGN. Thus, it appears that the TGN is not essential for retrograde transport for CT. This was an unexpected result, as most studies on the AB5 toxins indicate that transport through the TGN is required to access the ER (51). Such a direct pathway from endosome to ER would, however, be fully consistent with the GM1-dependent pathway taken by SV40 virus to infect host cells (52) and with emerging evidence for direct membrane trafficking between the endosome and ER (53–55).
In contrast to our results, a new study reports that depletion of the flotillins enhances toxicity of the similar AB5 subunit Shiga toxin (40). While we have always presumed otherwise, it is possible that CT and Shiga toxin utilize different mechanisms to access the ER, and perhaps different pathways, as Shiga toxin appears to require transit through the TGN.
The dependence on flotillin for retrograde sorting of CT into the ER provides evidence for the requirement of protein scaffolds in lipid raft–based lipid and membrane trafficking (11, 31, 32). The flotillins are conserved across kingdoms, and in each case they fractionate with biochemical correlates of lipid rafts (11, 13) and may affect lipid raft functions (19, 56). Flotillin-1 and -2 associate with the cytosolic leaflet of membranes via N-terminal appended acyl chains and perhaps also by the PHB/SPFH domain, which might adopt a hairpin structure in the membrane bilayer capable of interacting directly with membrane lipids so as to induce or maintain raft structure (11, 57). Thus, the flotillins could affect trafficking of CT by scaffolding lipid rafts containing GM1 and linking them to sorting machinery in the cytosol, or by interacting directly with the ceramide chain of GM1 for inclusion into specific lipid rafts or vesicles specifying ER retrograde transport.
Methods
Reagents and antibodies.
Vibrio cholerae CT and CTB were purchased from Calbiochem; all other toxins were prepared as previously described (G33D, ref. 33; CTB-GS, ref. 2; R192G, ref. 58). CTB–Alexa Fluor 488 and Mitotracker Red were purchased from Invitrogen. Protease Complete (–EDTA) was from Roche Diagnostics; PNGase F was from New England Biolabs; Con A Sepharose was from GE Healthcare; 35S–sodium sulfate was from PerkinElmer. Rabbit polyclonal antisera to CTB and CTA were as previously described (59). Rabbit polyclonal antibodies against human Derlin-1 and -2 were gifts from Yihong Ye (NIH, Bethesda, Maryland, USA). Mouse anti–human flotillin-1 and -2 were from BD Transduction Laboratories and Cell Signaling Technology, respectively; goat anti-BiP was from Santa Cruz Biotechnology Inc. Mouse anti–β-actin, rabbit anti-PDI, HRP-labeled secondary antibodies, and forskolin were purchased from Sigma-Aldrich. Anti-GFP was from Invitrogen. Mouse anti-CFTR was from Millipore. Derlin-1–HA (26) and Derlin-1–YFP (26) plasmids were gifts from Bill Tsai (University of Michigan, Ann Arbor, Michigan, USA). HBSS, pH 7.4, was used for all manipulations with live mammalian cells.
Zebrafish embryo intoxication.
The maintenance and handling of zebrafish (Danio rerio) were reviewed and approved according to IACUC guidelines by the Animal Care and Use Committee of Children’s Hospital Boston. Zebrafish embryos (16- to 18-hpf) were dechorionated either manually or by protease treatment and then placed into 96-well plates (5/well) in 200 μl standard embryo water with or without toxin and containing 0.5× Protease Complete. The latter was necessary to inhibit proteolysis of cholera toxin (data not shown), presumably caused by proteases secreted by the developing embryo. All recombinant toxins were trypsin-nicked as previously described (60). Embryos were imaged using a Leica S8APO stereomicroscope.
Modulation of MRC density.
One-cell-stage embryos were transferred from fresh water to either normal or high-salt medium (0.4 and 2.0 g/l Instant Ocean sea salt in distilled water, respectively). After 18 hours at 24°C, embryos were dechorionated and either intoxicated and imaged as above, or incubated a further 24 hours in the respective medium, washed in normal embryo medium, and incubated with 1 μM MitoTracker for 10 minutes.
Ganglioside analysis and CTB overlay blot.
Gangliosides were extracted from approximately 3,500 18-hpf embryos using a protocol modified from Folch et al. (61). Embryos were homogenized in 6 ml chloroform-methanol (2:1, v/v), transferred to glass tubes containing 2.87 ml 2:1 chloroform-methanol, and bath-sonicated for 5 minutes. After centrifugation (2,500 g, 10 minutes, 4°C), the insoluble pellet was re-extracted as above; all supernatants were combined, and KCl was added to a final concentration of 0.88%. The aqueous phase containing gangliosides was aspirated to a new tube, and the organic phase re-extracted with 4.86 ml chloroform-methanol–0.1 M KCl (3:48:47; v/v/v). Pooled aqueous phases were desalted with a Bond-Elut 500 mg LRC C18 column (Agilent Technologies) (62) and eluted with methanol. Bovine brain gangliosides and purified GM1 were from Avanti Polar Lipids. Gangliosides were analyzed by high-performance thin-layer chromatography (HPTLC) (solvent was chloroform-methanol–0.25% CaCl2 [60:35:8; v/v/v]) and visualized by resorcinol spray (2 mg/ml resorcinol in 4.8 N HCl, 0.25 mM CuSO4) after heating to 100°C for 30 minutes. For overlay experiments, chromatographic separation was performed as detailed above, except that aluminum-backed rather than glass-backed HPLTC plates were used (Merck). Immunodetection of CTB on HPTLC plates was performed using rabbit polyclonal anti-CTB (1:1,000) and goat anti-rabbit HRP (1:5,000; Sigma-Aldrich).
Fluorescence microscopy in live embryos and Cos-1, Bsc-1, and A431 cells.
Embryos (40-hpf) were incubated in embryo water containing 20 nm CTB–Alexa Fluor 488 for 50 minutes, and then a further 10 minutes with 1 μM MitoTracker (labels MRCs), thought to regulate salt and water homeostasis in the zebrafish embryo (34). Embryos were washed and anesthetized (50 μg/ml MS-222) prior to imaging. Cos-1 cells were incubated with 20 nM CTB–Alexa Fluor 488 in HBSS at 37°C for 2 hours, washed, fixed in 4% PFA for 15 minutes, and processed for immunofluorescence microscopy using standard methods (1:200 PDI rabbit pAb). Embryos and mammalian cells were imaged using a Nikon Eclipse TE2000-E inverted microscope equipped with a CSU-10 spinning disk confocal head (PerkinElmer) and an Orca ER cooled CCD camera (Hamamatsu Photonics). For confocal imaging, the excitation source used was 50-mW solid-state lasers (473 nm [CrystaLaser] and 561 nm [Cobolt]), and intensity was controlled by an acoustic-optical tunable filter. In fluorescence images displaying the entire embryo, wide-field 3D stacks were captured using a ×10 objective (plan apochromat, NA 0.3), and maximum intensity projections were merged. Higher-magnification images of embryos are single confocal planes captured using a ×60 oil objective (plan apochromat, NA 1.4). 2D confocal sections of Cos-1 cells were captured using a ×100 oil objective (plan apochromat, 1.4 NA; Nikon). Images were captured and analyzed using Slidebook 4.2 software (Intelligent Imaging Innovations). The ER trafficking assays shown in Figure 6H were analyzed as follows: the fraction of cells showing CTB present in the ER was evaluated by visual inspection of confocal sections of control and flotillin-1 siRNA–treated samples. Briefly, we counted cells that exhibited an above-background signal of CTB following the outline of the NE as defined by PDI immunostaining. Cells showing no detectable CT signal over the NE were considered defective in transport of CT to the ER. This method of analysis does not discern between degrees of CTB-positive NE, only presence or absence. Positive/negative scoring for CTB transport to the NE is shown for 2 representative Cos-1 cells in Supplemental Video 3.
cAMP ELISA.
Single or pools of 10 embryos intoxicated with various toxins (5 nM) were washed, lysed, and analyzed for total cAMP content using a cAMP Biotrak EIA assay kit according to the manufacturer’s protocol (catalog RPN225, protocol 4; GE Healthcare). Cos-1 cAMP analysis was similar to that previously described (8), except 1 nM CT was used and all samples were normalized to the forskolin response of parallel samples (10 μM, 15 minutes).
Immunoblot analysis.
SDS-PAGE, standard immunoblotting methodologies, and chemiluminescence detection were as previously described (59). Primary antibodies were as follows: protein G–purified rabbit anti-CTB, 1:1,500; rabbit anti-CTA, 1:2,500; mouse anti–β-actin, 1:4,000; mouse anti–flotillin-1, 1:200; rabbit anti–flotillin-2, 1:800; affinity-purified rabbit anti–Derlin-1, 1:500; rabbit anti–Derlin-2, 1:5,000; goat anti-BiP (GRP78), 1:500; rabbit anti-HSP90, 1:500; rabbit anti-GFP, 1:2,000; mouse anti-CFTR, 1:100. In Figure 3C, cells were preintoxicated for 90 minutes with 10 nM CT before preparation of extracts for Derlin-1 immunoblot analysis, because CT has been shown to upregulate Derlin-1 (28) and we wanted to be sure that Derlin-1 expression was undetectable under the conditions used in the A1-chain retro-translocation assay (Figure 3E). It should be noted that zebrafish and Cos-1 cell lysates were heated to 65°C for 10 minutes when immunoblots for Derlin-1 or -2 were to be performed. The ER extract in Figure 3A was prepared from bovine liver microsomes as positive control for Derlin-1. Densitometry was performed on digital scanned images of X-ray film using NIH ImageJ software (bands used were in the linear range as determined using a range of exposure times).
Morpholino injections.
Tü WT embryos were used for morpholino studies, and all target gene sequences were confirmed by genomic DNA sequencing prior to morpholino design. Translation-blocking morpholino sequences (GeneTools LLC) targeting the zebrafish mRNA for derl1, reggie-2/flot1, and reggie-1/flot2 were as follows: derl1: 5′-ATATGACTGGAGATCCTGGAGATTC-3′; reggie-2/flot1 (targets both flot1a [100% base pair complementation] and flot1b [2 base pair mismatch]) homologs: 5′-CATTGGGACCGCAGGTATAAAACAT-3′; reggie-2a/flot1a: 5′-GCAGAATACAGTTACAATCACTAGG-3′; reggie-2b/flot1b: 5′-TTTAAAAGGCACCAGTCACTAGATC-3′; reggie-1/flot2: 5′-GTCCTACCGTGTAGCAATTCCCCAT-3′. Morpholino sequences targeting the theoretical translational start site or transcriptional splice site between exon 4 and intron 4 for the putative gene derl2 were: 5′-CATCACCTGAGCAAGCGAATGAAGG-3′ and 5′-TTTCGAGCAATAGTGAAGGATACAG-3′, respectively. A standard nonspecific morpholino designed against human β-globin mRNA served as a negative control for all experiments (GeneTools). All morpholinos were injected into 1-cell-stage fertilized embryos.
siRNA transfection.
Cos-1 cells were seeded in 6-well plates at a density of 5 × 10⁴ to 8 × 10⁴ cells per well 1 day prior to transfection. Transfection was performed with Lipofectamine 2000 reagent for biochemical assays or Oligofectamine for microscopy analyses per the manufacturer’s protocol (Invitrogen). For each well, 4 μl Lipofectamine 2000 and 0.40 pmol of FLOT1–specific (19) or control siRNA oligomers (Santa Cruz Biotechnology Inc.) were used. siRNA against DERL1 and DERL2 (Ambion) were as follows: DERL1 #1 sense 5′-GCUUAGCAAUGGAUAUGCAtt-3′, antisense 5′-UGCAUAUCCAUUGCUAAGCca-3′; DERL1 #2 sense 5′-GAGGCUCGGUAAUCAAUGAtt-3′, antisense 5′-UCAUUGAUUACCGAGCCUCcg-3′; DERL2 sense 5′-GGAUCCAAAUUACAAUCCAtt-3′, antisense 5′-UGGAUUGUAAUUUGGAUCCtc-3′.
Quantitative real-time PCR.
Total RNA was extracted with RNeasy mini kit (QIAGEN). RT-PCR was performed using SuperScriptTM III reverse transcriptase (Invitrogen) following the manufacturer’s instructions. The sequences of the specific primers for human DERL1 were as follows: forward, 5′-GATCACGCGCTATTGGTTCG-3′; reverse, 5′-GGACCCACAGGGAAATAAAAGGT-3′. GAPDH was amplified under identical conditions to serve as an internal control for normalization using the primers forward, 5′-CCACCCATGGCAAATTCCATGGCA-3′; reverse, 5′-TCTAGACGGCAGGTCAGGTCC ACC-3′. Real-time PCR was performed using the SYBR Green QRT-PCR Master Mix Kit according to the manufacturer’s protocol (Bio-Rad). PCR conditions included polymerase activation at 95°C for 10 minutes, followed by 40 cycles at 95°C for 30 seconds, 60°C for 30 seconds, and 72°C for 30 seconds. The threshold cycle (Ct) of each sample was recorded as a quantitative measure of the amount of PCR product in the sample using a Bio-Rad iQ real-time PCR detection system. Sample triplicates were analyzed in each assay.
A1-chain retro-translocation assay.
This assay is modified from refs. 26, 35. Briefly, Cos-1 cells grown in 6-well plates were incubated with 20 nM CT (without or with 10 μM lactacystin for some experiments) in HBSS for 90 minutes at 37°C, detached from wells with 0.25% trypsin (+EDTA), counted using a Roche Innovatis CASY TT cell counter, and normalized to approximately 0.6 × 10⁶ cells/sample. Cells were washed, suspended in 100 μl HN buffer (50 mM HEPES pH 7.5, 150 mM NaCl, protease inhibitors), incubated on ice for 10 minutes, then centrifuged at 250,000 g in a Beckman TLA 100 rotor for 10 minutes at 4°C. The supernatant was collected, protein content determined by BCA assay, and the membrane pellet suspended in 100 μl HN buffer. Laemmli sample buffer was added, and samples were analyzed by SDS-PAGE and immunoblot.
Toxin binding and endocytosis assays.
To gauge specificity for GM1 binding to CTB in zebrafish, 16-hpf embryos were incubated for 1 hour with no toxin, 5 nM WT CTB, or G33D and extensively washed in embryo water, and pools of 5 embryos/condition were lysed in 80 μl lysis buffer (TBS, pH 7.2; 2% SDS; 1% β-mercaptoethanol; 1× Protease Complete) for 10 minutes at 100°C. Supernatants were mixed with Laemmli sample buffer and analyzed by SDS-PAGE and immunoblot. Alternatively, 24-hpf dechorionated embryos were incubated with 100 nM unlabeled CTB, CT-G33D, or BSA at 28°C. After 40 minutes, 10 nM CTB–Alexa Fluor 488 was added and the embryos incubated for 3 hours, rinsed, and imaged by confocal microscopy as described below. In Cos-1 cells, CTB binding and competition were as previously described (8), except that 3 nM CT holotoxin was applied to Cos-1 cells and a 500-fold molar excess of CTB was utilized (1.5 μM). Toxin endocytosis in Cos-1 cells transfected with control and flotillin siRNAs was as previously described (8) with the following modifications: Cos-1 cells grown in one 10-cm2 well/sample were incubated with 1 nM CT for 75 minutes on ice, washed of excess toxin, and kept on ice or warmed to 37°C for 0, 2, or 10 minutes to promote endocytosis. Three rounds of acid stripping was performed by incubating cells with 2 ml of 100 mM glycine, pH 2.0, for 5 minutes and then with HBSS, pH 7.4, for 5 minutes. All acid-stripped samples were subsequently incubated with 37°C HBSS, pH 7.4, for 10 seconds to promote release of remaining surface-bound toxin. To determine maximal surface-bound CT, parallel samples were washed only with 4°C HBSS, pH 7.4 (no acid strip; note 7-fold fewer of these samples were loaded in Figure 6B). Cell lysis, immunoprecipitation, and immunoblotting were as previously described (8).
TGN/ER trafficking assays.
The mutant toxin CTB-GS, harboring glycosylation and sulfation motifs appended to the C terminus of the B-subunit, was used to gauge entry into the TGN and ER of Cos-1 cells as previously described (2). For isolation of total N-glycosylated CTB-GS independent of TGN trafficking, Cos-1 cells transfected with control or flotillin-1 siRNA were intoxicated with 10 nM CTB-GS in HBSS for 3 hours at 37°C (one 6-well plate/condition). Cells were washed, and ConA Sepharose resin was used to isolate glycosylated proteins from cell lysates as previously described (60). This ConA affinity isolation protocol was also performed in the experiments shown in Figure 6, F and G, with the exception that Cos-1 cells were first incubated with 35S-sulfate as previously described (2) before pooling 5 wells from a 6-well plate/condition (control and flotillin-1 siRNA). Post-ConA resin eluate from parallel control cells was treated with PNGase F per the manufacturer’s protocol (New England Biolabs). All samples were separated by SDS-PAGE and were analyzed by immunoblot, phosphorimaging, or Silver Stain Plus (Bio-Rad).
Flow cytometry.
Suspensions of 106 Cos-1 cells (parental or expressing CFTRΔF508-GFP) that were transfected with control or Derlin-1 siRNA were run on a FACS CantoII flow cytometer (BD Biosciences). Data were collected using FACS Diva software (BD Biosciences) and analyzed with FlowJo software (TreeStar Inc.).
Statistics.
All data are representative of at least 3 independent experiments unless otherwise indicated. Data are mean ± SEM for all graphs unless otherwise indicated; statistical significance was determined by unpaired 2-tailed Student’s t test where indicated (P values of less than 0.05 were considered to be significant).
Supplementary Material
Acknowledgments
We thank Marian Neutra for critical reading of the manuscript, Tom Rapoport for helpful discussions, Ashley Pollock for tissue culture help, Wolfram Goessling for phenotype screening, Marc-Andre Wurbel for help with flow cytometry, and Chris Lawrence and Jason Best for help with zebrafish husbandry. This study was funded by NIH grants R01 DK48106, R01 DK084424, and DK0484424 (to W.I. Lencer); K01 DK073480 (to D.E. Saslowsky); F32 DK083894 (to J.A. Cho); R01 DK070838, P01 HL032262, P30 DK072437, and by the March of Dimes (to B.H. Paw); Harvard Digestive Diseases Center P30 DK34854.
Footnotes
Conflict of interest: The authors have declared that no conflict of interest exists.
Citation for this article: J Clin Invest. 2010;120(12):4399–4409. doi:10.1172/JCI42958.
References
- 1.Lencer WI, Tsai B. The intracellular voyage of cholera toxin: going retro. Trends Biochem Sci. 2003;28(12):639–645. doi: 10.1016/j.tibs.2003.10.002. [DOI] [PubMed] [Google Scholar]
- 2.Fujinaga Y, et al. Gangliosides that associate with lipid rafts mediate transport of cholera toxin from the plasma membrane to the ER. Mol Biol Cell. 2003;14(12):4783–4793. doi: 10.1091/mbc.E03-06-0354. [DOI] [PMC free article] [PubMed] [Google Scholar]
- 3.Tsai B, Ye Y, Rapoport TA. Retro-translocation of proteins from the endoplasmic reticulum into the cytosol. Nat Rev Cell Biol. 2002;3(4):246–255. doi: 10.1038/nrm780. [DOI] [PubMed] [Google Scholar]
- 4.Brodsky JL, Wojcikiewicz RJ. Substrate-specific mediators of ER associated degradation (ERAD). Curr Opin Cell Biol. 2009;21(4):516–521. doi: 10.1016/j.ceb.2009.04.006. [DOI] [PMC free article] [PubMed] [Google Scholar]
- 5.Kirkham M, et al. Ultrastructural identification of uncoated caveolin-independent early endocytic vehicles. J Cell Biol. 2005;168(3):465–476. doi: 10.1083/jcb.200407078. [DOI] [PMC free article] [PubMed] [Google Scholar]
- 6.Orlandi PA, Fishman PH. Filipin-dependent inhibition of cholera toxin: evidence for toxin internalization and activation through caveolae-like domains. J Cell Biol. 1998;141(4):905–915. doi: 10.1083/jcb.141.4.905. [DOI] [PMC free article] [PubMed] [Google Scholar]
- 7.Wolf AA, Jobling MG, Wimer-Mackin S, Madara JL, Holmes RK, Lencer WI. Ganglioside structure dictates signal transduction by cholera toxin in polarized epithelia and association with caveolae-like membrane domains. J Cell Biol. 1998;141(4):917–927. doi: 10.1083/jcb.141.4.917. [DOI] [PMC free article] [PubMed] [Google Scholar]
- 8.Saslowsky DE, Lencer WI. Conversion of apical plasma membrane sphingomyelin to ceramide attenuates the intoxication of host cells by cholera toxin. Cell Microbiol. 2008;10(1):67–80. doi: 10.1111/j.1462-5822.2007.01015.x. [DOI] [PubMed] [Google Scholar]
- 9.Lingwood D, Simons K. Lipid rafts as a membrane-organizing principle. Science. 2010;327(5961):46–50. doi: 10.1126/science.1174621. [DOI] [PubMed] [Google Scholar]
- 10.Simons K, Toomre D. Lipid rafts and signal transduction. Nat Rev Mol Cell Biol. 2000;1(1):31–39. doi: 10.1038/35036052. [DOI] [PubMed] [Google Scholar]
- 11.Morrow IC, Parton RG. Flotillins and the PHB domain protein family: rafts, worms and anaesthetics. Traffic. 2005;6(9):725–740. doi: 10.1111/j.1600-0854.2005.00318.x. [DOI] [PubMed] [Google Scholar]
- 12.Schulte T, Paschke KA, Laessing U, Lottspeich F, Stuermer CA. Reggie-1 and reggie-2, two cell surface proteins expressed by retinal ganglion cells during axon regeneration. Development. 1997;124(2):577–587. doi: 10.1242/dev.124.2.577. [DOI] [PubMed] [Google Scholar]
- 13.Bickel PE, Scherer PE, Schnitzer JE, Oh P, Lisanti MP, Lodish HF. Flotillin and epidermal surface antigen define a new family of caveolae-associated integral membrane proteins. J Biol Chem. 1997;272(21):13793–13802. doi: 10.1074/jbc.272.21.13793. [DOI] [PubMed] [Google Scholar]
- 14.Langhorst MF, Reuter A, Stuermer CA. Scaffolding microdomains and beyond: the function of reggie/flotillin proteins. Cell Mol Life Sci. 2005;62(19-20):2228–2240. doi: 10.1007/s00018-005-5166-4. [DOI] [PMC free article] [PubMed] [Google Scholar]
- 15.Babuke T, et al. Hetero-oligomerization of reggie-1/flotillin-2 and reggie-2/flotillin-1 is required for their endocytosis. Cell Signal. 2009;21(8):1287–1297. doi: 10.1016/j.cellsig.2009.03.012. [DOI] [PubMed] [Google Scholar]
- 16.Frick M, Bright NA, Riento K, Bray A, Merrified C, Nichols BJ. Coassembly of flotillins induces formation of membrane microdomains, membrane curvature, and vesicle budding. Curr Biol. 2007;17(13):1151–1156. doi: 10.1016/j.cub.2007.05.078. [DOI] [PubMed] [Google Scholar]
- 17.Langhorst MF, et al. Preformed reggie/flotillin caps: stable priming platforms for macrodomain assembly in T cells. FASEB J. 2006;20(6):711–713. doi: 10.1096/fj.05-4760fje. [DOI] [PubMed] [Google Scholar]
- 18.Dermine JF, et al. Flotillin-1-enriched lipid raft domains accumulate on maturing phagosomes. J Biol Chem. 2001;276(21):18507–18512. doi: 10.1074/jbc.M101113200. [DOI] [PubMed] [Google Scholar]
- 19.Glebov OO, Bright NA, Nichols BJ. Flotillin-1 defines a clathrin-independent endocytic pathway in mammalian cells. Nat Cell Biol. 2006;8(1):46–54. doi: 10.1038/ncb1342. [DOI] [PubMed] [Google Scholar]
- 20.Tsai B, Rodighiero C, Lencer WI, Rapoport T. Protein disulfide isomerase acts as a redox-dependent chaperone to unfold cholera toxin. Cell. 2001;104(6):937–948. doi: 10.1016/S0092-8674(01)00289-6. [DOI] [PubMed] [Google Scholar]
- 21.Tsai B, Rapoport T. Unfolded cholera toxin is transferred to the ER membrane and released from protein disulfide isomerase upon oxidation by Ero1. J Cell Biol. 2002;159(2):207–215. doi: 10.1083/jcb.200207120. [DOI] [PMC free article] [PubMed] [Google Scholar]
- 22.Carvalho P, Goder V, Rapoport TA. Distinct ubiquitin-ligase complexes define convergent pathways for the degradation of ER proteins. Cell. 2006;126(2):361–373. doi: 10.1016/j.cell.2006.05.043. [DOI] [PubMed] [Google Scholar]
- 23.Denic V, Quan EM, Weissman JS. A luminal surveillance complex that selects misfolded glycoproteins for ER-associated degradation. Cell. 2006;126(2):349–359. doi: 10.1016/j.cell.2006.05.045. [DOI] [PubMed] [Google Scholar]
- 24.Oda Y, Okada T, Yoshida H, Kaufman RJ, Nagata K, Mori K. Derlin-2 and Derlin-3 are regulated by the mammalian unfolded protein response and are required for ER-associated degradation. J Cell Biol. 2006;172(3):383–393. doi: 10.1083/jcb.200507057. [DOI] [PMC free article] [PubMed] [Google Scholar]
- 25.Okuda-Shimizu Y, Hendershot LM. Characterization of an ERAD pathway for nonglycosylated BiP substrates, which require Herp. Mol Cell. 2007;28(4):544–554. doi: 10.1016/j.molcel.2007.09.012. [DOI] [PMC free article] [PubMed] [Google Scholar]
- 26.Bernardi KM, Forster ML, Lencer WI, Tsai B. Derlin-1 facilitates the retro-translocation of cholera toxin. Mol Biol Cell. 2008;19(3):877–884. doi: 10.1091/mbc.E07-08-0755. [DOI] [PMC free article] [PubMed] [Google Scholar]
- 27.Bernardi KM, et al. The E3 Ubiquitin Ligases Hrd1 and gp78 Bind to and Promote Cholera Toxin Retro-translocation. Mol Biol Cell. 2009;21(1):140–151. doi: 10.1091/mbc.E09-07-0586. [DOI] [PMC free article] [PubMed] [Google Scholar]
- 28.Dixit G, Mikoryak C, Hayslett T, Bhat A, Draper RK. Cholera toxin up-regulates endoplasmic reticulum proteins that correlate with sensitivity to the toxin. Exp Biol Med (Maywood). 2008;233(2):163–175. doi: 10.3181/0705-RM-132. [DOI] [PubMed] [Google Scholar]
- 29.Kothe M, et al. Role of p97 AAA-ATPase in the retrotranslocation of the cholera toxin A1 chain, a non-ubiquitinated substrate. J Biol Chem. 2005;280(30):28127–28132. doi: 10.1074/jbc.M503138200. [DOI] [PubMed] [Google Scholar]
- 30.Rodighiero C, Tsai B, Rapoport TA, Lencer WI. Role of ubiquitination in retro-translocation of cholera toxin and escape of cytosolic degradation. EMBO Rep. 2002;3(12):1222–1227. doi: 10.1093/embo-reports/kvf239. [DOI] [PMC free article] [PubMed] [Google Scholar]
- 31.Magal LG, et al. Clustering and lateral concentration of raft lipids by the MAL protein. Mol Biol Cell. 2009;20(16):3751–3762. doi: 10.1091/mbc.E09-02-0142. [DOI] [PMC free article] [PubMed] [Google Scholar]
- 32.Hancock JF. Lipid rafts: contentious only from simplistic standpoints. Nat Rev Mol Cell Biol. 2006;7(6):456–462. doi: 10.1038/nrm1925. [DOI] [PMC free article] [PubMed] [Google Scholar]
- 33.Jobling MG, Holmes RK. Analysis of structure and function of the B subunit of cholera toxin by the use of site-directed mutagenesis. Mol Microbiol. 1991;5(7):1755–1767. doi: 10.1111/j.1365-2958.1991.tb01925.x. [DOI] [PubMed] [Google Scholar]
- 34.Esaki M, et al. Mechanism of development of ionocytes rich in vacuolar-type H(+)-ATPase in the skin of zebrafish larvae. Dev Biol. 2009;329(1):116–129. doi: 10.1016/j.ydbio.2009.02.026. [DOI] [PMC free article] [PubMed] [Google Scholar]
- 35.Wernick NL, De Luca H, Kam WR, Lencer WI. N-terminal extension of the cholera toxin A1-chain causes rapid degradation after retro-translocation from ER to cytosol. J Biol Chem. 2010;285(9):6145–6152. doi: 10.1074/jbc.M109.062067. [DOI] [PMC free article] [PubMed] [Google Scholar]
- 36.Sun F, Zhang R, Gong X, Geng X, Drain PF, Frizzell RA. Derlin-1 promotes the efficient degradation of the cystic fibrosis transmembrane conductance regulator (CFTR) and CFTR folding mutants. J Biol Chem. 2006;281(48):36856–36863. doi: 10.1074/jbc.M607085200. [DOI] [PubMed] [Google Scholar]
- 37.Wang B, et al. BAP31 interacts with Sec61 translocons and promotes retrotranslocation of CFTRDeltaF508 via the derlin-1 complex. Cell. 2008;133(6):1080–1092. doi: 10.1016/j.cell.2008.04.042. [DOI] [PubMed] [Google Scholar]
- 38.Malaga-Trillo E, Laessing U, Lang DM, Meyer A, Stuermer CA. Evolution of duplicated reggie genes in zebrafish and goldfish. J Mol Evol. 2002;54(2):235–245. doi: 10.1007/s00239-001-0005-1. [DOI] [PubMed] [Google Scholar]
- 39.von Philipsborn AC, Ferrer-Vaquer A, Rivera-Milla E, Stuermer CA, Malaga-Trillo E. Restricted expression of reggie genes and proteins during early zebrafish development. J Comp Neurol. 2005;482(3):257–272. doi: 10.1002/cne.20423. [DOI] [PubMed] [Google Scholar]
- 40.Pust S, Dyve AB, Torgersen ML, van Deurs B, Sandvig K. Interplay between toxin transport and flotillin localization. PLoS One. 2010;5(1):e8844. doi: 10.1371/journal.pone.0008844. [DOI] [PMC free article] [PubMed] [Google Scholar]
- 41.Chintagari NR, Gou D, Liu L. Knockdown of flotillin-2 inhibits lung surfactant secretion by alveolar type II cells. Cell Res. 2008;18(6):701–703. doi: 10.1038/cr.2008.55. [DOI] [PMC free article] [PubMed] [Google Scholar]
- 42.Vassilieva EV, Ivanov AI, Nusrat A. Flotillin-1 stabilizes caveolin-1 in intestinal epithelial cells. Biochem Biophys Res Commun. 2009;379(2):460–465. doi: 10.1016/j.bbrc.2008.12.118. [DOI] [PMC free article] [PubMed] [Google Scholar]
- 43.Massol RH, Larsen JE, Fujinaga Y, Lencer WI, Kirchhausen T. Cholera toxin toxicity does not require functional Arf6- and dynamin-dependent endocytic pathways. Mol Biol Cell. 2004;15(8):3631–3641. doi: 10.1091/mbc.E04-04-0283. [DOI] [PMC free article] [PubMed] [Google Scholar]
- 44.Zhang R-G, et al. The three-dimensional crystal structure of cholera toxin. J Mol Biol. 1995;251(4):563–573. doi: 10.1006/jmbi.1995.0456. [DOI] [PubMed] [Google Scholar]
- 45.Hazes B, Read RJ. Accumulating evidence suggests that several AB-toxins subvert the endoplasmic reticulum-associated protein degradation pathway to enter target cells. Biochemistry. 1997;36(37):11051–11054. doi: 10.1021/bi971383p. [DOI] [PubMed] [Google Scholar]
- 46.Sato BK, Schulz D, Do PH, Hampton RY. Misfolded membrane proteins are specifically recognized by the transmembrane domain of the Hrd1p ubiquitin ligase. Mol Cell. 2009;34(2):212–222. doi: 10.1016/j.molcel.2009.03.010. [DOI] [PMC free article] [PubMed] [Google Scholar]
- 47.Schmitz A, Herrgen H, Winkeler A, Herzog V. Cholera toxin is exported from microsomes by the sec61p complex. J Cell Biol. 2000;148(6):1203–1212. doi: 10.1083/jcb.148.6.1203. [DOI] [PMC free article] [PubMed] [Google Scholar]
- 48.Ait-Slimane T, Galmes R, Trugnan G, Maurice M. Basolateral internalization of GPI-anchored proteins occurs via a clathrin-independent flotillin-dependent pathway in polarized hepatic cells. Mol Biol Cell. 2009;20(17):3792–3800. doi: 10.1091/mbc.E09-04-0275. [DOI] [PMC free article] [PubMed] [Google Scholar]
- 49.Mayor S, Pagano RE. Pathways of clathrin-independent endocytosis. Nat Rev Mol Cell Biol. 2007;8(8):603–612. doi: 10.1038/nrm2216. [DOI] [PMC free article] [PubMed] [Google Scholar]
- 50.Stuermer CA, Lang DM, Kirsch F, Wiechers M, Deininger SO, Plattner H. Glycosylphosphatidyl inositol-anchored proteins and fyn kinase assemble in noncaveolar plasma membrane microdomains defined by reggie-1 and -2. Mol Biol Cell. 2001;12(10):3031–3045. doi: 10.1091/mbc.12.10.3031. [DOI] [PMC free article] [PubMed] [Google Scholar]
- 51.Johannes L, Popoff V. Tracing the retrograde route in protein trafficking. Cell. 2008;135(7):1175–1187. doi: 10.1016/j.cell.2008.12.009. [DOI] [PubMed] [Google Scholar]
- 52.Pelkmans L, Kartenbeck J, Helenius A. Caveolar endocytosis of simian virus 40 reveals a new two-step vesicular-transport pathway to the ER. Nat Cell Biol. 2001;3(5):473–483. doi: 10.1038/35074539. [DOI] [PubMed] [Google Scholar]
- 53.Saraste J, Dale HA, Bazzocco S, Marie M. Emerging new roles of the pre-Golgi intermediate compartment in biosynthetic-secretory trafficking. FEBS Lett. 2009;583(23):3804–3810. doi: 10.1016/j.febslet.2009.10.084. [DOI] [PubMed] [Google Scholar]
- 54.Saraste J, Goud B. Functional symmetry of endomembranes. Mol Biol Cell. 2007;18(4):1430–1436. doi: 10.1091/mbc.E06-10-0933. [DOI] [PMC free article] [PubMed] [Google Scholar]
- 55.Eden ER, White IJ, Tsapara A, Futter CE. Membrane contacts between endosomes and ER provide sites for PTP1B-epidermal growth factor receptor interaction. Nat Cell Biol. 2010;12(3):267–272. doi: 10.1038/ncb2026. [DOI] [PubMed] [Google Scholar]
- 56.Fecchi K, Volonte D, Hezel MP, Schmeck K, Galbiati F. Spatial and temporal regulation of GLUT4 translocation by flotillin-1 and caveolin-3 in skeletal muscle cells. FASEB J. 2006;20(6):705–707. doi: 10.1096/fj.05-4661fje. [DOI] [PMC free article] [PubMed] [Google Scholar]
- 57.Morrow IC, et al. Flotillin-1/Reggie-2 traffics to surface raft domains via a Golgi-independent pathway: identification of a novel membrane targeting domain and a role for palmitoylation. J Biol Chem. 2002;277(50):48834–48841. doi: 10.1074/jbc.M209082200. [DOI] [PubMed] [Google Scholar]
- 58.Rodighiero C, Aman AT, Kenny MJ, Moss J, Lencer WI, Hirst TR. Structural basis for the differential toxicity of cholera toxin and Escherichia coli heat-labile enterotoxin. Construction of hybrid toxins identifies the A2-domain as the determinant of differential toxicity. J Biol Chem. 1999;274(7):3962–3969. doi: 10.1074/jbc.274.7.3962. [DOI] [PubMed] [Google Scholar]
- 59.Lencer WI, Moe S, Rufo PA, Madara JL. Transcytosis of cholera toxin subunits across model human intestinal epithelia. Proc Natl Acad Sci U S A. 1995;92(22):10094–10098. doi: 10.1073/pnas.92.22.10094. [DOI] [PMC free article] [PubMed] [Google Scholar]
- 60.De Luca HE, Lencer WI. A biochemical method for tracking cholera toxin transport from plasma membrane to Golgi and endoplasmic reticulum. Methods Mol Biol. 2006;341:127–139. doi: 10.1385/1-59745-113-4:127. [DOI] [PubMed] [Google Scholar]
- 61.Folch J, Lees M, Sloane-Stanly J. A simple method for the isolation and purification of total lipids from animal tissue. J Biol Chem. 1957;226(1):497–509. [PubMed] [Google Scholar]
- 62.Ullman MD, McCluer RH. Quantitative analysis of brain gangliosides by high performance liquid chromatography of their perbenzoyl derivatives. J Lipid Res. 1985;26(4):501–506. [PubMed] [Google Scholar]
Associated Data
This section collects any data citations, data availability statements, or supplementary materials included in this article.