Abstract
The measurement of blood-plasma absolute velocity distributions with high spatial and temporal resolution in vivo is important for the investigation of embryonic heart at its early stage of development. We introduce a novel method to measure absolute blood flow velocity based on high speed spectral domain optical coherence tomography (OCT) and apply it to measure velocities across the heart outflow tract (OFT) of a chicken embryo (stage HH18). First, we use the OCT system to acquire 4D [(x,y,z) + t] images of the OFT in vivo. Second, we reconstruct the 4D microstructural images and obtain the orientation of the OFT at its maximum expansion, from which the centerline of the OFT is calculated based on the OFT boundary segmentation. Assuming flow is parallel to the vessel orientation, the obtained centerline indicates the flow direction. Finally, the absolute flow velocity is evaluated based on the direction given by the centerline and the axial velocity obtained from Doppler OCT. Using this method, we compare flow velocity profiles at various positions along the chicken embryo OFT.
OCIS codes: (170.4500) Optical coherence tomography, (170.3880) Medical and biological imaging, (110.4155) Multiframe image processing
1. Introduction
Embryonic heart development is a dynamic process involving genetic, mechanical, chemical, and biological factors. Recent studies showed that blood flow pattern influences the structural development of the embryonic heart, e.g [1,2]. Thus, cardiac embryonic heart flow measurements are important for morphogenetic studies. In this work, we used the chicken embryo as our animal model of cardiac development because at its early stages, the cardiac development in chicken is similar to that in humans [3], the chick embryonic heart is relatively easy to access, and chick embryos develop faster than most other animal models [4]. We focused on the heart outflow tract (OFT) of Hamburger-Hamilton (HH) developmental stage 18 (~3 days of incubation) [5], in which the chick heart is tubular and has no valves, because at this stage the heart, and especially the heart OFT, is particularly sensitive to blood flow conditions. Altered blood flow dynamics through the heart at HH18 has been shown to lead to structural cardiac defects and result in congenital heart disease. The OFT is the distal region of the embryonic heart – connecting the ventricle with the arterial system. The OFT functions as a primitive valve, limiting blood flow regurgitation (also referred to as backflow, or blood-flow reversal) through contraction. The OFT is a crucial cardiac segment to study since a large portion of congenital heart defects originate in the OFT [6] and blood flow conditions play an important role in the development of the OFT at early developmental stages.
It is very challenging to image blood flow through the embryonic heart because the heart is tiny (<1mm), and beats fast (~2 beats per second). Further, accurate measurement of spatial velocity fields is required for determining the wall shear stress on the surface of the embryonic heart. Wall shear stress is proportional to the gradient of velocity in a direction perpendicular to the wall, and is known to affect cardiovascular growth and remodeling, and thus it is an important hemodynamic factor during cardiac development. In this paper, we present a methodology to measure blood flow velocity during the cardiac cycle using optical coherence tomography (OCT) images and Doppler OCT.
A number of technologies have been applied and developed for obtaining blood flow velocities in the embryonic heart at its early stages of development. Laser Doppler velocimetry (LDV) [7] is a mature technique for flow measurement with high sensitivity and dynamic range. However, it does not provide spatial resolution, which limits its application if distributions of wall shear stresses are sought. Currently, LDV is often used as a trigger signal for synchronization purposes in other imaging methods [8]. High-frequency ultrasound (40~55MHz) provides 2D structural images in vivo with axial and lateral resolutions as high as 28 and 62 µm respectively [9,10]. It can also measure Doppler blood flow velocity in a small volume over time. High-frequency ultrasound is commonly used to image embryonic mouse hearts and to assess their cardiac function [11,12]. There are, however, some disadvantages of high-frequency ultrasound in imaging early stage embryonic hearts. Though noninvasive, ultrasound techniques require the transducer to be in acoustic contact with the sample. The resolution of ultrasound, especially its lateral resolution, is not sufficient enough to accurately measure developing hearts that are < 1mm in length. Additionally, the Doppler angle of ultrasound is visually set on the screen using a longitudinal structural image, making the measurement of velocity largely operator-dependent. Micro particle image velocimetry (µPIV) can be used to measure whole-field blood flow velocity by tracking the motion of injected tracers, such as fluorescent liposomes [13]. This is, however, an invasive method that may alter blood flow dynamics in the developing heart and with unknown cytotoxic effects on the embryo development.
OCT [14] is a non-invasive imaging modality with high resolution (5 to 20µm). OCT has been shown to be well suited for imaging embryonic hearts. Yelbuz et al. studied cardiac development in chick embryos in vitro using time domain OCT in 2002 [15]. In their study, they focused on structural changes between diastole and systole. Furthermore, OCT can provide flow velocity information by calculating the Doppler frequency shift, i.e., Doppler OCT. Yang et al. measured heart blood flow velocities of stage 47 Xenopus tadpole by time domain OCT in 2003 [16]. In this method, the Doppler angle was measured using longitudinal scanning. Recently, spectral domain OCT (SDOCT) is becoming more and more popular because of its high sensitivity and high acquisition speed [17–20]. Using SDOCT, Davis et al. monitored early stage embryonic chicken heart development (HH9 to HH15) [21]. They acquired a sequence of 3D volume data (~9.8 seconds each acquisition) and the process of heart development was documented, including heart tube fusion (HH8+/9-), heart tube formation (HH10), and heart tube expansion and bending.
Beating is always an important issue in imaging embryonic heart. If the imaging system is not fast enough, synchronization is necessary for better imaging results. Jenkins et al. performed prospective-gated OCT imaging of the heart of an early developing chicken embryo, triggering image acquisition with signals obtained by LDV from a vitelline vessel [8]. Mariampillai et al. performed retrospective-gated OCT imaging of a chick embryonic heart using Doppler velocities: during acquisition of B-mode structural images of the chick heart, they simultaneously collected Doppler signals from an aortic arch with a separate Doppler OCT system. Then, Doppler data were used to synchronize B-mode image sequences [22]. Liebling et al. proposed a retrospective gating on OCT images based on B-mode structural similarity [23]. Liu et al. introduced a 4D non-gated post-acquisition method to synchronize heart beating at different positions along the heart using structural similarity and a shift correction to account for peristaltic-like motion of the developing heart [24]. These studies mainly focused on structural imaging, but not on measuring the blood flow velocity. It is known that Doppler SDOCT provides accurate measurement of the blood flow velocity along the probe beam direction, i.e., the velocity portion projected on the axial (Z) direction in the OCT system [25]. The main problem, however, is how to get the absolute blood flow velocity from the measured data set. To meet this challenge, the Doppler angle (the angle formed by the axial direction and the flow direction) of the blood flow must be obtained. This task is difficult when the heart is beating. Davis et al. [26] proposed a method that relied on image reconstruction to evaluate the Doppler angle. In their approach, 3D volume data was acquired in vivo first, and subsequently reconstructed using a 3D software package. After volume rendering, the blood flow direction was measured approximately, based on the rendering results. This method, however, is labor intensive and can only be used before the embryonic heart starts to beat (<HH9) – since distortions in the volume rendering would appear due to the beating heart dynamics. Thus, the method is not practical when the embryonic heart beats fast.
In this paper, we present a novel method to measure absolute blood flow velocity in vivo using Doppler SDOCT, and we apply it to measure velocities in the chicken embryo heart OFT at stage HH18. Our method is based on the assumption that blood flow is parallel to the blood vessel orientation. After 4D image reconstruction, we calculate the centerline of the chicken embryo OFT when the OFT is most expanded. Then we calculate the slope of the centerline at each position, which is consequently used to calculate the absolute blood flow velocity. Comparing with visually setting the Doppler angle, a common practice when using ultrasound, our method is more precise and less dependent on the operator.
2. Material and system
2.1 Chicken embryos
Fertilized White Leghorn eggs were incubated until they reached the desired developmental stage, HH18. A small part of the egg shell and chorionic membrane was removed to establish optical access to the embryo. To maintain a constant temperature of 37.5°C, an organic glass cube was built in which the egg was situated with the optical beam access from the top. Additionally, a heat blanket was set in the cube and its heating was controlled by the embryonic temperature, measured by a thermocouple near the embryo.
2.2 Spectral domain optical coherence tomography system
This study employed an SDOCT system which is based on an InGaAs line scan camera operating at 47kHz line rate (Fig. 1 ). This system utilizes a broad band superluminescent diode with 1321.5 nm central wavelength and 52 nm bandwidth, to offer ~14 µm axial resolution in air. The light emitted from the light source was split into sample arm and reference arm through a 2 × 2 fiber coupler. In the sample arm, the light was delivered onto the sample through an optical probe, which contains a collimator, an X-Y 2D galvanometer scanning system, and an objective lens. We used a 50 mm focal length objective lens to achieve ~16 μm lateral resolution. The output light from the interferometer was routed to a home-built spectrometer, which had a designed spectral resolution of ~0.088 nm that provided a detectable depth range of ~4.6 mm on each side of the zero delay line. The line rate of the camera was 47,000 per second. With this imaging speed, the signal to noise ratio was measured at ~105 dB with a light power on the sample at ~3 mW.
Fig. 1.
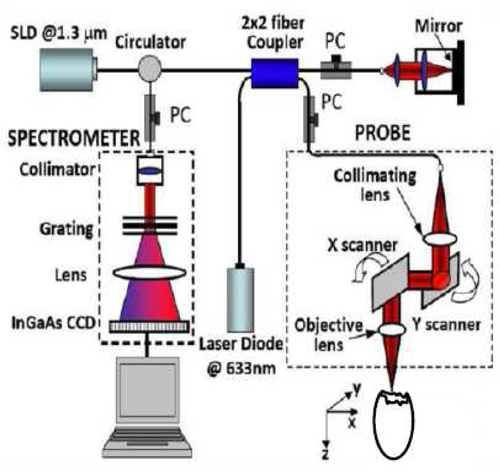
Schematic of our spectral-domain OCT system.
3. Methods
To calculate absolute flow velocity, we assume that blood flow direction is the same as the tangent of the OFT centerline. Since Doppler SDOCT provides the projection flow velocity in the axial (Z) direction, we can achieve absolute blood flow velocity using the flow direction (effectively the Doppler angle) with the projection velocity. We used four steps to obtain absolute blood flow velocity: (1) 4D scan of the OFT; (2) 4D synchronized reconstruction (the main purpose of the first two steps is to compensate for artifacts caused by the heart beating); (3) determination of the OFT centerline based on the OFT boundary segmentation on each cross-sectional image; and (4) absolute blood flow velocity calculation (using the flow direction and the projection velocity).
3.1 4D scan strategy
The strategy for non-gated 4D imaging is illustrated in Fig. 2 . In X-direction, the X-scanner was driven by a saw tooth function. During one lateral B-scan cycle, 256 axial (Z-direction) A-lines were acquired to cover ~1.1 mm on the chicken embryo heart. The overlap between adjacent two A-scans was about 75% (lateral diameter of sampling light focus point is ~16 µm), which was sufficient for Doppler spectral domain OCT measurement. With the camera running at 47 kHz line rate, the acquisition rate for B-scan frames was 140 frames per second (fps). In Y-direction, the Y-scanner was driven by a step function. The whole C-scan was divided into 163 steps to cover ~1.1 mm on Y-direction. At each step, 200 repeated B-scans were acquired (for duration of ~1.5 sec). In total, each 4D scanning took ~12 minutes because of the limitation of the hard drive data saving speed.
Fig. 2.
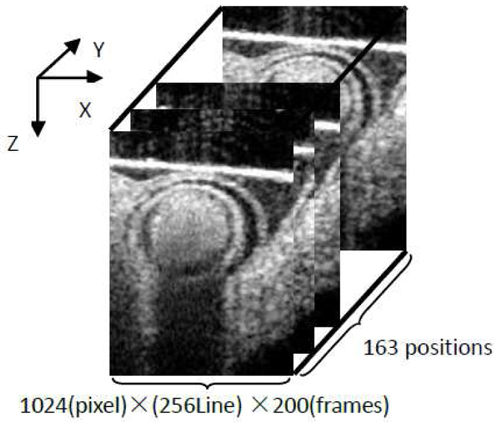
Schematic 4D scan strategy (non-gated). Spatial volume: 4.6 (Z) × 1.1(X) × 1.1(Y) mm3. Each position: 200 frames (~1.5 sec).
3.2 4D synchronized reconstruction
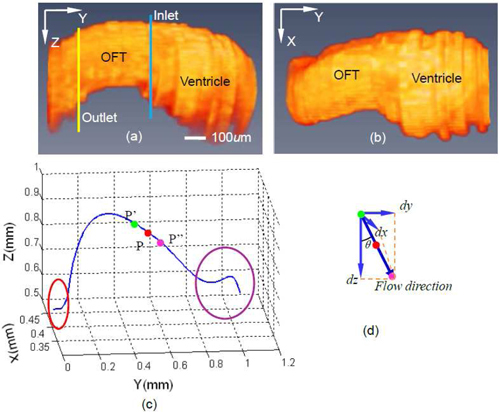
Our 4D scan was performed in a non-gated way, which means that the acquired image sequences were out-of-phase, i.e. they were not synchronized. Therefore, to reconstruct 4D images of the heart, image sequences needed to be synchronized, that is: the phase relationship between imaging sequences had to be determined. Our synchronization procedure has been described before by Liu et al. in 2009 [24]. Briefly, it consists of five steps: (1) cardiac period determination for each image sequence; (2) determination of relative phase shift between adjacent image sequence (adjacent in Y-direction); (3) absolute phase shift determination of a given image sequence relative to the first image sequence; (4) estimation and adjustment of phase lags between image sequences introduced by peristaltic-like motions of the heart wall; (5) synchronization of image sequence and reconstruction of the 4D image. After reconstruction, we obtained 3D images of the OFT at different, discrete phases of the cardiac cycle. A synchronized 3D image data set is shown in Figs. 3(a) and 3(b) (after segmentation) for a phase in which the OFT is expanded.
Fig. 3.

3D views of segmented chicken embryonic OFT and the OFT centerline. Side view (a) and top view (b) of segmented chicken embryonic OFT, when the OFT walls are most expanded. Blue line and yellow line in (a) correspond to inlet and outlet of OFT . (c) Calculated centerline corresponding to (a) and (b), Red circle corresponds to the region of OFT near the aortic sac, purple circle corresponds to the ventricle; (d) schematic representation of calculation of flow direction.
3.3 Centerline calculation
To calculate the OFT center line, we selected a set of 3D images – corresponding to maximum expansion of the OFT walls (Fig. 3). For each position (Y-direction), a snake algorithm [27] was employed to segment (delineate) the OFT wall boundary. At HH18, the OFT wall consists of an outer myocardial tube-like layer in direct contact with the pericardial fluid, a middle layer of extracellular matrix called the cardiac jelly, and an inner endocardial layer in contact with the blood [Fig. 4(a) ]. Those three layers are almost homocentric when the OFT walls are expanded. In this study, we selected the myocardial tube as the segmentation target because its shape is more regular than that of the other two layers resulting in more stable segmentations [Fig. 4(b)]. 3D images of segmented chicken embryonic OFT, at a phase when the OFT walls are most expanded, are shown in Fig. 3(a) (side view) and Fig. 3(b) (top view). Since the boundary of the OFT myocardium is a closed curve [Fig. 4(c)], we calculated the geometrical center point (Xc, Zc) of the region within the curve using the following equations:
| (1) |
| (2) |
where I is a binary matrix that represents each pixel in the image and contains ‘ones’ inside the OFT region [the white part in Fig. 4(d)] and ‘zeros’ outside; and are the X and Z coordinates of each pixels; N is the total number of pixels that lie inside the OFT region. By connecting those center points at different positions along the OFT (Y-direction), we then obtained the centerline of the OFT [Fig. 3(c)]. As we mentioned before, the OFT is the distal part of the heart, and connects the ventricle with the arterial system. The red circle in Fig. 3(c) denotes a region of the OFT adjacent to the aortic sac and the purple circle denotes a region close to the ventricle. The centerline in both of these two regions is not accurate because the heart tissue is too deep for OCT imaging, and boundaries are hard to discern. We thus focused on the accurate middle part of the centerline, and its tangent direction which served as flow direction in our methods.
Fig. 4.
Boundary segmentation of chicken embryonic OFT walls: (a) Structural image; (b) boundary segmentation; (c) segmented boundary curve; (d) region within the curve (geometrical center of the region serves as blood vessel center point).
3.4 Absolute blood flow velocity calculation
SDOCT signal provides magnitude and phase information simultaneously. The magnitude gives the structural image while the phase provides a flow velocity image (Doppler SDOCT). In Doppler SDOCT, the phase difference () between two adjacent A-scans is introduced by the motion (the velocity in the axial (Z) direction, Vz), and the relationship is:
| (3) |
where λ is the center wavelength of the light source; n is the refractive index of tissue (~1.3); τ is the time duration between the two A-scans (47,000Hz line rate was applied in our study); θ is the Doppler angle, i.e. the angle between the incident light and the flow direction; is the projection of the blood flow velocity V in Z-direction, i.e., the probe beam direction. Thus, absolute flow velocity V is then:
| (4) |
where , is the Doppler angle factor. The phase difference can be calculated directly from SDOCT data, and then using the SDOCT configuration parameters we can obtain Vz. According to Eq. (4), we also need DF to quantify absolute velocity. Assuming blood flow direction is parallel to the centerline, we calculated the DF at a given point [P in Fig. 3(c)] on the centerline:
| (5) |
where P’ and P” are points adjacent to P [Fig. 3(c)] on the centerline of the OFT; ,,,,,are the coordinates of these points shown in Fig. 3(c) and 3(d). The calculated DF along the OFT (Y-direction) is shown in Fig. 5 . There are three special anomalous regions on the DF curve (circled in red in Fig. 5). Region 1 is near the arterial system and region 3 is in the ventricle. As we mentioned before (Section 3.3), the centerline is not precise in these two regions. Thus, the calculated DFs are not accurate there since they are derived from the centerline. Region 2 corresponds to a section of the OFT in which the OFT walls bend and the Doppler angles are close to π/2. This makes the DF too sensitive to small angle changes [see Eq. (4)] and the measured Vz too small and noisy to be used. Except for those 3 regions, however, the DFs are available for absolute flow velocity calculation in the HH18 chicken embryonic OFT.
Fig. 5.
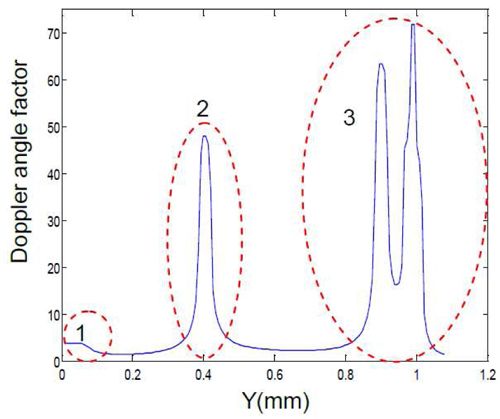
Doppler angle factor (DF) distribution at different positions along the chicken embryo OFT. Region 1: OFT near the arterial system; region 2: bended region of OFT; region 3: ventricle. Doppler angle factors in region 1 and 3 are inaccurate because the boundaries of the OFT in the structural image are not clear (Section 3.3). Doppler angle factors in region 2 are not useful because the Doppler angles here are close to π/2 (Section 3.4).
4. Results and discussion
Using our method, we compared flow patterns between inlet and outlet of the OFT. The inlet position considered (Y coordinate) corresponds to the blue line in Fig. 3(a) and ~0.6 mm in Fig. 5. At this position, the Doppler angle is about 73.8°, DF is 3.59, and the lumen cross-sectional area is approximately 0.34mm2, when the OFT walls are expanded. From our 4D scan protocol, at this position we have a sequence of 200 frames (2D images) of raw data. For our analysis, we selected a phase (time) in which the OFT had maximum flow velocity. This selected phase is shown with a white line in Fig. 6(a) –an M-mode image extracted (post-processed) from the acquired sequence of cross sectional images, along the middle line of the OFT lumen. For the phase selected, we had both a structural image [Fig. 6(b)] and a Doppler SDOCT velocity distribution image, from which the projection of the blood flow velocity in the axial direction (Vz) can be calculated. We corrected the velocity distribution within the OFT, Vz, using the calculated DF to get the absolute blood flow velocity distribution in the OFT [Fig. 6(c)]. Further, blood flow velocity was quantified along a horizontal line [Fig. 6(d)] that approximately cut the OFT cross-sectional image in half [white line in Fig. 6(c)].
Fig. 6.
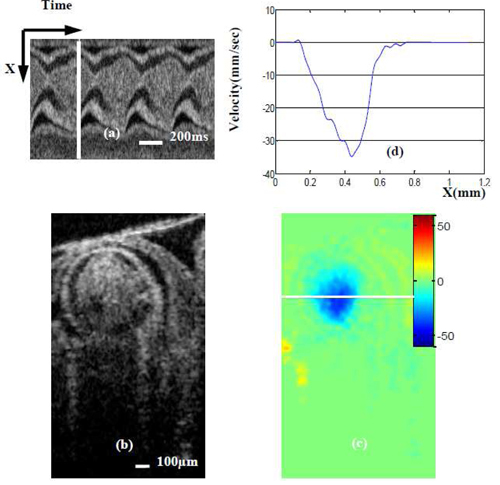
Maximum blood flow velocity near the OFT inlet. (a) M-mode image extracted from the sequence of cross-sectional images (one row over time). White line in (a) denotes the phase (time) of the cross-sectional images (b) and (c); (b) OCT structural image; (c)absolute velocity distribution image (obtained from Doppler SDOCT after correction for DF); (d) velocity profile across the white line [on (b)] of OFT.
For the OFT outlet (corresponding position is shown in Fig. 3(a) (yellow line) and ~0.25 mm in Fig. 5), the Doppler angle is 68.9°, DF is 2.78 and lumen cross-sectional area is approximately 0.25mm2. We performed the same data processing procedures described for the OFT inlet position to get the absolute blood flow velocity and velocity profile in the OFT outlet position when the OFT was expanded and blood flow velocity was maximal (see Fig. 7 ).
Fig. 7.
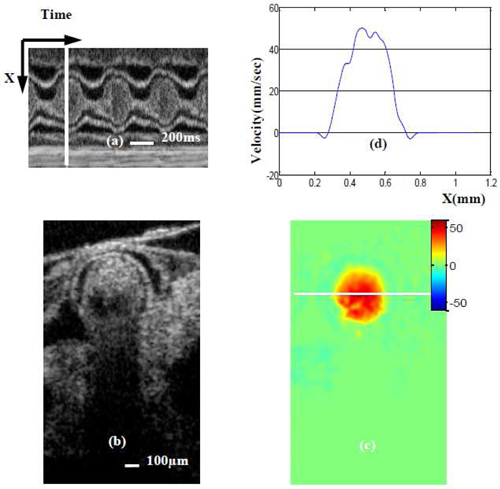
Maximum blood flow velocity near the OFT outlet. (a) M-mode image extracted from the sequence of cross-sectional images (one row over time). White line in (a) denotes the phase (time) of the cross-sectional images (b) and (c); (b) OCT structural image; (c)absolute velocity distribution image (obtained from Doppler SDOCT after correction for DF); (d) velocity profile across the white line [on (b)] of OFT.
Comparing Figs. 6(c) and 7(c), we observe that the blood flow direction is negative (blue) at the OFT inlet while the flow direction is positive (red) at the OFT outlet. This is because the OFT bends, and thus blood flows ‘up’ (negative direction) at the inlet and ‘down’ (positive direction) at the outlet. The maximum absolute blood flow velocity at the inlet is ~35 mm/sec [Fig. 6(d)] while at the outlet it is ~50 mm/sec [Fig. 7(d)]. Thus the outlet of the OFT has a higher maximum blood flow velocity than the inlet, trend that was also observed in our ultrasound data (not published). This is probably because the OFT tapers toward the outlet and as a result the cross-sectional area of the lumen at the inlet, ~0.34mm2 [Fig. 6(b)] is larger than that at the outlet [Fig. 7(b)], ~0.25mm2.
We also analyzed an image at the OFT outlet that showed maximum backflow velocity (when blood flows from the arterial system backs to the OFT). The position of this image (Y direction) is the same as that shown in Fig. 7 and Fig. 4(a) yellow line, but the phase is different [see Fig. 8(a) ]. Comparing white lines in Fig. 7(a) and Fig. 8(a), we observe that maximum backflow appears a little earlier than maximum forward flow. Maximum backflow velocity is ~18 mm/sec [Fig. 8(d)], which is smaller than maximum forward flow velocity. From our observations, backflow is generally larger at the outlet than at the inlet of the OFT. In some embryos, further, there is no backflow at the OFT inlet, such as in the case analyzed here.
Fig. 8.
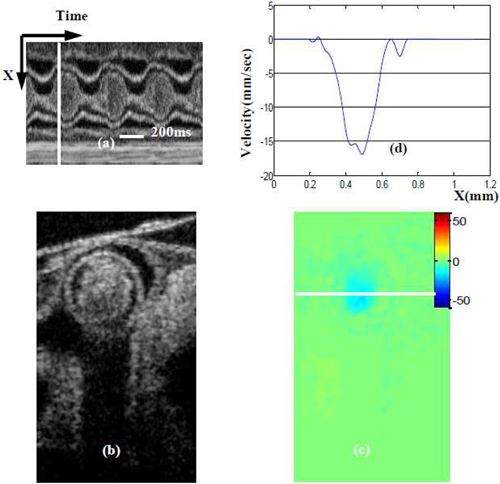
Maximum backward blood flow velocity near the OFT outlet. (a) M-mode image extracted from the sequence of cross-sectional images (one row over time). White line in (a) denotes the phase (time) of the cross-sectional images (b) and (c); (b) OCT structural image; (c)absolute velocity distribution image (obtained from Doppler SDOCT after correction for DF); (d) velocity profile across the white line [on (b)] of OFT.
Our method to calculate blood flow velocity, needs to segment the OFT boundary from SDOCT structural images to calculate the flow direction. Thus, the quality of the structural images is important for the accuracy of our method. At early stages of chicken embryo development, embryonic heart tissue is transparent. Furthermore, in order to make deep heart structures more clear we adjusted the position of the probe beam focus point to 800µm beneath the match point. This allows OCT to achieve relatively better defined structures at larger imaging depths. Image wash-out, however, is a phenomenon that deteriorates image quality. It appears as a shadow under the flowing medium in structural images affecting mainly the deeper heart OFT image boundaries. Image wash-out is determined by the flow velocity, especially the projection velocity in the Z direction (Vz), as well as the OCT imaging speed. In the current study, imaging speed was 47,000 A-scan per second, which determined the maximum measurable velocity was 12 mm/s (in probe beam direction). The early stage chicken embryo heart (HH18) is tiny and blood flow speed is not fast. Additionally, the Doppler angle of the blood flow in the OFT is ~70°, which makes Vz even smaller. Thus, the effect of image wash-out is not significant in our application and we can discern the deeper boundary of the OFT in most cases.
Doppler based flow measurement techniques (laser Doppler, ultrasound and Doppler OCT) always face the problems of Doppler angle correction. Generally, one representative longitudinal 2D image is used to set the Doppler angle in ultrasound. Similar methods were used in Doppler OCT [28]. However, precision is the main issue of these methods, especially when trying to determine the Doppler angle of the beating embryonic heart. The chicken embryonic OFT at HH18 stage of development is a tube, but the shape of it is not regular. Figures 9(a) and 9(b) show different views of a segmented OFT of a chicken embryo. The OFT shows two bends in different directions, and the presence of these bends makes it difficult to get a good longitudinal image to determine the Doppler angle. For example, Fig. 9(c) shows a 2D longitudinal scan image, in which it is observed that the boundary at the left is cut (the OFT bends there). Using such longitudinal image to determine the Doppler angle, may introduce errors. Additionally, if the Doppler angle is measured ‘visually’ (e.g. on the screen), operator-related errors will be introduced. This is even worse for the case of the beating heart, because the Doppler angle is constantly changing due to the heart motion. Further, because DF is sensitive to small variation in Doppler angle, especially when the angle is relatively big (~> 70°), a small imprecision in the Doppler angle measurement may affect the final result seriously. Comparing with the traditional method of measuring the Doppler angle, our method obtained Doppler angle by first reconstructing 3D images of the OFT at a specific phase of interest, then calculating the center line(thus including variations due to 3D bending), and finally calculating DF from the obtained center line. As a result, our method of determining the Doppler angle and the associated DF is more precise than traditional methods.
Fig. 9.
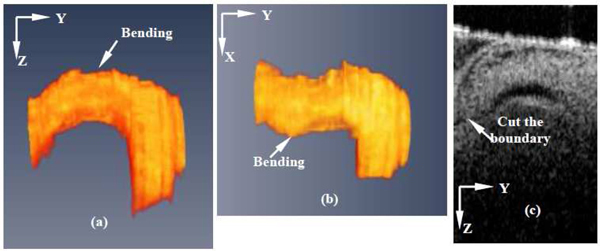
Chicken embryo OFT bending. (a) Side view of segmented OFT; (b) Top view of segmented OFT ; (c) Longitudinal 2D scan of OFT. The OFT is bending in two direction, so it is difficult to get a longitudinal cut of OFT.
In order to get the Doppler angle, Davis et al. [21,26]acquired three-dimensional volume data of the chicken embryonic heart in vivo using SDOCT. Their 3D data were acquired over ~9.8 sec and processed by Amira software to render the heart surface, from which they measured the Doppler angle. An advantage of their method is the use of 3D data, which renders more precise values of the Doppler angle than using a 2D longitudinal image. The drawback of their method is that motion artifacts arise in the 3D image when the heart beats fast. For example, at HH18, the cardiac period of the chicken embryonic heart is about 0.3 to 0.5 seconds. Using our system, ~1.2 seconds are needed for a 3D scan (faster than the 9.8 seconds in the system of Davis et al). A 3D volume data set comprising multiple cross-sectional images along the OFT will then be imaged over 34 cardiac cycles, and therefore the volumetric reconstructions will not be accurate. Obviously, the measured Doppler angle from these kind of data sets are subjected to errors. In our method, to circumvent this problem and get accurate 3D volume data over the cardiac cycle (that is, 3D images that represent the geometry of the heart at different phases of the cardiac cycle) we use a 4D scan strategy and synchronization procedure [24]. Therefore our method can be applied when the heart is beating.
Yeh et.al [29] presented a method to measure three components of an arbitrary velocity vector based on SDOCT in 2007. A beam divider, which divides a probe beam into five independent view points and path length delays, was designed. By inserting the divider into the sampling arm and using certain phase-resolved algorithm, they quantified the three-dimensional velocity vector. The advantage of their method is obvious, i.e. it can achieve three-dimensional velocity by one scan. However, it is difficult to measure the chicken embryo OFT blood flow velocity using this method because of sample size requirements. In their method, one sample was shifted and imaged to five view points, i.e. five structural images were spread over the measurable range of SDOCT. In our SDOCT images, the deeper OFT borders were located at 1.5~2mm depth. That means that, even in ideal condition (neglect structures beneath the OFT), we need 7.5~10mm measurable range SDOCT system in order to successfully use the method described by Yeh et al. Our system can only provide at most 4.6mm measurable range, and thus structural overlap is unavoidable, and the method cannot be successfully implemented in our current system for the measurement of the heart OFT at HH18.
As we mentioned before (Section 3.4), Doppler SDOCT uses phase differences () between two adjacent A-scans to calculate the projected blood flow velocity Vz [Eqs. (3) and (4)]. However, the range of is [-π,π]. Thus, initially, as Vz increases, increases proportionally, until reaches the value of π and suddenly jumps to -π. This is called phase “wrapping” and can lead to incorrect velocity measurements. From Eq. (4) we can see that the measurable range of the projection velocity Vz is limited by the camera scan speed (τ) since λ( = 1321.5nm) and n( = 1.3 in tissue) are constants. For our system, the measurable range of Vz is [-12,12] mm/s when the camera runs at maximum rate (47,000Hz). Thus, if the projection velocity exceeds this range, wrapping will appear. Figure 10(a) shows an example of the phase wrapping in the chicken embryonic OFT at forward blood flow phase. The wrapping (blue) area corresponds to the region in which Vz exceeds 12mm/s. According to the color bar, we can see that blue denotes negative velocity, and this is obviously incorrect. We introduce a constant phase (π or -π, depending on the flow direction) to the second A-line before the phase difference calculation, after phase difference calculation we subtract this constant phase back. Using this method, we can shift the phase difference () range to [0, 2π] (or to [-2π, 0]. Consequently, the measurable range of the projection velocity is doubled, i.e., [-24, 24] mm/sec. The unwrapping result is shown in Fig. 10(b), the wrapping area [blue Fig. 10(a)] has been corrected (red) and the corresponding Vz are higher than 12mm/sec.
Fig. 10.
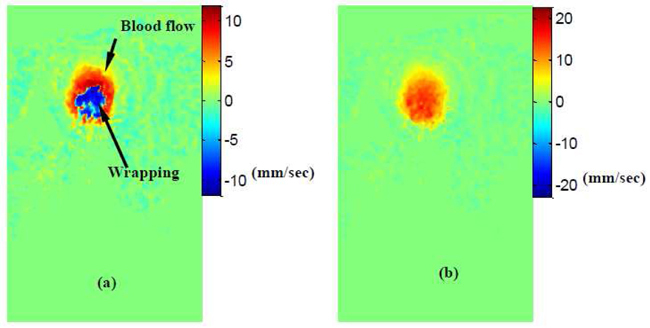
Phase unwrapping. (a) Forward blood flow with wrapping; (b) Forward blood flow with wrapping correct. Measurable range shifted from [-12, 12] mm/sec ((a))to [0, 24]mm/sec((b)).
Our developed method to measure blood flow velocities is suitable to study blood flow dynamics in the hearts of developing embryos, when the heart is tubular. Because the method proposed calculates the Doppler angle from 3D volume images of the heart at specific phases during the cardiac cycle, variations in the orientation of the heart due to cardiac motion are taken into account. This allows for an accurate estimation of the Doppler angle and the Doppler factor, DF, in the three-dimensional space and over the cardiac cycle. The method works best when blood flows in the direction of the heart center line, and therefore when flow velocities normal to the centerline are negligible. Velocities perpendicular to the tubular heart wall could occur due to secondary flows and wall motions (contraction, expansion and rigid body motion) during the cardiac cycle. While a careful analysis might be needed to determine whether flow velocities normal to the center line are negligible, this is also a problem that other Doppler velocity measurements face. In the case considered here, for the calculation of blood flow velocity in the OFT of an HH18 chicken embryo, the OFT is expanded and wall motion is minimal (see Figs. 6 and 7). Even during backflow, when the OFT walls are expanding (see Fig. 8), the wall velocity – as estimated from the M-mode image – is about 2 mm/sec, negligible compared to the maximum backflow velocity of ~18 mm/s. Further, velocity profiles were calculated along the X-direction (Figs. 6, 7, and 8), where the effects of expanding wall motions in Vz are minimized. Because Doppler OCT gives the spatial distribution of blood-flow velocities, our method could be employed in the calculation of wall shear stresses in the developing heart using signals from scattered red blood cells.
5. Conclusion
We present a new method to quantify absolute blood flow velocity based on Doppler spectral domain OCT, and we applied this method to measure blood flow velocity in the heart OFT of an early stage (HH18) chicken embryo. Our presented method is more precise than traditional Doppler velocity methods in which the Doppler angle is estimated from 2D longitudinal sections, but more time consuming. Using our method, we quantified the blood flow velocity profiles at the inlet and outlet of the OFT. We found that, as the OFT tapers towards the outlet, maximum blood flow velocities increase. The proposed method provides absolute blood flow distributions at most parts of the cardiac OFT section. We also corrected phase wrapping, which is generally present in SDOCT flow measurements. Our method is superior to other Doppler velocity measurements in that the Doppler angle and DF are accurately calculated. Further, Doppler OCT measurements combined with our developed method offer high resolution and precision, while being non-invasive.
Acknowledgments
This work was supported by a National Institutes of Health (NIH), grant number R01HL094570, from the National Heart, Blood and Lung Institute.
References and links
- 1.Hove J. R., Köster R. W., Forouhar A. S., Acevedo-Bolton G., Fraser S. E., Gharib M., “Intracardiac fluid forces are an essential epigenetic factor for embryonic cardiogenesis,” Nature 421(6919), 172–177 (2003). 10.1038/nature01282 [DOI] [PubMed] [Google Scholar]
- 2.Ursem N. T., Stekelenburg-de Vos S., Wladimiroff J. W., Poelmann R. E., Gittenberger-de Groot A. C., Hu N., Clark E. B., “Ventricular diastolic filling characteristics in stage-24 chick embryos after extra-embryonic venous obstruction,” J. Exp. Biol. 207(9), 1487–1490 (2004). 10.1242/jeb.00902 [DOI] [PubMed] [Google Scholar]
- 3.Moorman A. F. M., Christoffels V. M., “Cardiac chamber formation: development, genes, and evolution,” Physiol. Rev. 83(4), 1223–1267 (2003). [DOI] [PubMed] [Google Scholar]
- 4.Ruijtenbeek K., De Mey J. G. R., Blanco C. E., Ehmke H., “The chicken embryo in developmental physiology of the cardiovascular system: a traditional model with new possibilities,” Am. J. Physiol. Regul. Integr. Comp. Physiol. 283(2), R549–R550, author reply R550–R551 (2002). [DOI] [PubMed] [Google Scholar]
- 5.Hamburger V., Hamilton H. L., “A series of normal stages in the development of the chick embryo,” J. Morphol. 88(1), 49–92 (1951). 10.1002/jmor.1050880104 [DOI] [PubMed] [Google Scholar]
- 6.Gittenberger-de Groot A. C., Bartelings M. M., Deruiter M. C., Poelmann R. E., “Basics of cardiac development for the understanding of congenital heart malformations,” Pediatr. Res. 57(2), 169–176 (2005). 10.1203/01.PDR.0000148710.69159.61 [DOI] [PubMed] [Google Scholar]
- 7.Wang C. P., “Laser Doppler velocimetry,” J. Quant. Spectrosc. Radiat. Transf. 40(3), 309–319 (1988). 10.1016/0022-4073(88)90122-7 [DOI] [Google Scholar]
- 8.Jenkins M. W., Chughtai O. Q., Basavanhally A. N., Watanabe M., Rollins A. M., “In vivo gated 4D imaging of the embryonic heart using optical coherence tomography,” J. Biomed. Opt. 12(3), 030505 (2007). 10.1117/1.2747208 [DOI] [PubMed] [Google Scholar]
- 9.Foster F. S., Zhang M. Y., Zhou Y. Q., Liu G., Mehi J., Cherin E., Harasiewicz K. A., Starkoski B. G., Zan L., Knapik D. A., Adamson S. L., “A new ultrasound instrument for in vivo microimaging of mice,” Ultrasound Med. Biol. 28(9), 1165–1172 (2002). 10.1016/S0301-5629(02)00567-7 [DOI] [PubMed] [Google Scholar]
- 10.McQuinn T. C., Bratoeva M., Dealmeida A., Remond M., Thompson R. P., Sedmera D., “High-frequency ultrasonographic imaging of avian cardiovascular development,” Dev. Dyn. 236(12), 3503–3513 (2007). 10.1002/dvdy.21357 [DOI] [PubMed] [Google Scholar]
- 11.Phoon C. K., Aristizabal O., Turnbull D. H., “40 MHz Doppler characterization of umbilical and dorsal aortic blood flow in the early mouse embryo,” Ultrasound Med. Biol. 26(8), 1275–1283 (2000). 10.1016/S0301-5629(00)00278-7 [DOI] [PubMed] [Google Scholar]
- 12.Phoon C. K., Aristizábal O., Turnbull D. H., “Spatial velocity profile in mouse embryonic aorta and Doppler-derived volumetric flow: a preliminary model,” Am. J. Physiol. Heart Circ. Physiol. 283(3), H908–H916 (2002). [DOI] [PubMed] [Google Scholar]
- 13.Vennemann P., Kiger K. T., Lindken R., Groenendijk B. C., Stekelenburg-de Vos S., ten Hagen T. L., Ursem N. T., Poelmann R. E., Westerweel J., Hierck B. P., “In vivo micro particle image velocimetry measurements of blood-plasma in the embryonic avian heart,” J. Biomech. 39(7), 1191–1200 (2006). 10.1016/j.jbiomech.2005.03.015 [DOI] [PubMed] [Google Scholar]
- 14.Huang D., Swanson E. A., Lin C. P., Schuman J. S., Stinson W. G., Chang W., Hee M. R., Flotte T., Gregory K., Puliafito C. A., Fujimoto J. G., “Optical coherence tomography,” Science 254(5035), 1178–1181 (1991). 10.1126/science.1957169 [DOI] [PMC free article] [PubMed] [Google Scholar]
- 15.Yelbuz T. M., Choma M. A., Thrane L., Kirby M. L., Izatt J. A., “Optical coherence tomography: a new high-resolution imaging technology to study cardiac development in chick embryos,” Circulation 106(22), 2771–2774 (2002). 10.1161/01.CIR.0000042672.51054.7B [DOI] [PubMed] [Google Scholar]
- 16.Yang V. X. D., Gordon M. L., Seng-Yue E., Lo S., Qi B., Pekar J., Mok A., Wilson B. C., Vitkin I. A., “High speed, wide velocity dynamic range Doppler optical coherence tomography (Part II): Imaging in vivo cardiac dynamics of Xenopus laevis,” Opt. Express 11(14), 1650–1658 (2003). 10.1364/OE.11.001650 [DOI] [PubMed] [Google Scholar]
- 17.Leitgeb R., Hitzenberger C. K., Fercher A. F., “Performance of fourier domain vs. time domain optical coherence tomography,” Opt. Express 11(8), 889–894 (2003). 10.1364/OE.11.000889 [DOI] [PubMed] [Google Scholar]
- 18.Choma M. A., Sarunic M., Yang C., Izatt J., “Sensitivity advantage of swept source and Fourier domain optical coherence tomography,” Opt. Express 11(18), 2183–2189 (2003). 10.1364/OE.11.002183 [DOI] [PubMed] [Google Scholar]
- 19.de Boer J. F., Cense B., Park B. H., Pierce M. C., Tearney G. J., Bouma B. E., “Improved signal-to-noise ratio in spectral-domain compared with time-domain optical coherence tomography,” Opt. Lett. 28(21), 2067–2069 (2003). 10.1364/OL.28.002067 [DOI] [PubMed] [Google Scholar]
- 20.Huber R., Adler D. C., Fujimoto J. G., “Buffered Fourier domain mode locking: Unidirectional swept laser sources for optical coherence tomography imaging at 370,000 lines/s,” Opt. Lett. 31(20), 2975–2977 (2006). 10.1364/OL.31.002975 [DOI] [PubMed] [Google Scholar]
- 21.Davis A. M., Rothenberg F. G., Shepherd N., Izatt J. A., “In vivo spectral domain optical coherence tomography volumetric imaging and spectral Doppler velocimetry of early stage embryonic chicken heart development,” J. Opt. Soc. Am. A 25(12), 3134–3143 (2008). 10.1364/JOSAA.25.003134 [DOI] [PubMed] [Google Scholar]
- 22.Mariampillai A., Standish B. A., Munce N. R., Randall C., Liu G., Jiang J. Y., Cable A. E., Vitkin I. A., Yang V. X. D., “Doppler optical cardiogram gated 2D color flow imaging at 1000 fps and 4D in vivo visualization of embryonic heart at 45 fps on a swept source OCT system,” Opt. Express 15(4), 1627–1638 (2007). 10.1364/OE.15.001627 [DOI] [PubMed] [Google Scholar]
- 23.Liebling M., Forouhar A. S., Gharib M., Fraser S. E., Dickinson M. E., “Four-dimensional cardiac imaging in living embryos via postacquisition synchronization of nongated slice sequences,” J. Biomed. Opt. 10(5), 054001 (2005). 10.1117/1.2061567 [DOI] [PubMed] [Google Scholar]
- 24.Liu A., Wang R. K., Thornburg K. L., Rugonyi S., “Efficient postacquisition synchronization of 4-D nongated cardiac images obtained from optical coherence tomography: application to 4-D reconstruction of the chick embryonic heart,” J. Biomed. Opt. 14(4), 044020 (2009). 10.1117/1.3184462 [DOI] [PubMed] [Google Scholar]
- 25.Zhang J., Chen Z., “In vivo blood flow imaging by a swept laser source based Fourier domain optical Doppler tomography,” Opt. Express 13(19), 7449–7457 (2005). 10.1364/OPEX.13.007449 [DOI] [PubMed] [Google Scholar]
- 26.Davis A., Izatt J., Rothenberg F., “Quantitative measurement of blood flow dynamics in embryonic vasculature using spectral Doppler velocimetry,” Anat. Rec. (Hoboken) 292(3), 311–319 (2009). 10.1002/ar.20808 [DOI] [PMC free article] [PubMed] [Google Scholar]
- 27.Kass M., Witkin A., Terzopoulos D., “Snakes: Active Contour Models,” Int. J. Comput. Vis. 1(4), 321–331 (1988). 10.1007/BF00133570 [DOI] [Google Scholar]
- 28.Rugonyi S., Shaut C., Liu A., Thornburg K., Wang R. K., “Changes in wall motion and blood flow in the outflow tract of chick embryonic hearts observed with optical coherence tomography after outflow tract banding and vitelline-vein ligation,” Phys. Med. Biol. 53(18), 5077–5091 (2008). 10.1088/0031-9155/53/18/015 [DOI] [PubMed] [Google Scholar]
- 29.Ahn Y. C., Jung W., Chen Z., “Quantification of a three-dimensional velocity vector using spectral-domain Doppler optical coherence tomography,” Opt. Lett. 32(11), 1587–1589 (2007). 10.1364/OL.32.001587 [DOI] [PubMed] [Google Scholar]


