Abstract
Purpose: The authors report a noninvasive technique and instrumentation for visualizing vasculature in the breast in three dimensions without using either ionizing radiation or exogenous contrast agents, such as iodine or gadolinium. Vasculature is visualized by virtue of its high hemoglobin content compared to surrounding breast parenchyma. The technique is compatible with dynamic contrast-enhanced studies.
Methods: Photoacoustic sonic waves were stimulated in the breast with a pulsed laser operating at 800 nm and a mean exposure of 20 mJ∕pulse over an area of ∼20 cm2. These waves were subsequently detected by a hemispherical array of piezoelectric transducers, the temporal signals from which were filtered and backprojected to form three-dimensional images with nearly uniform k-space sampling.
Results: Three-dimensional vascular images of a human volunteer demonstrated a clear visualization of vascular anatomy with submillimeter spatial resolution to a maximum depth of 40 mm using a 24 s image acquisition protocol. Spatial resolution was nearly isotropic and approached 250 μm over a 64×64×50 mm field of view.
Conclusions: The authors have successfully visualized submillimeter breast vasculature to a depth of 40 mm using an illumination intensity that is 32 times less than the maximum permissible exposure according to the American National Standard for Safe Use of Lasers. Clearly, the authors can achieve greater penetration depth in the breast by increasing the intensity and the cross-sectional area of the illumination beam. Given the 24 s image acquisition time without contrast agent, dynamic, contrast-enhanced, photoacoustic breast imaging using optically absorbing contrast agents is conceivable in the future.
Keywords: photoacoustic, computed, tomography, breast, cancer
INTRODUCTION
Breast cancer is the second most commonly diagnosed malignancy in women in the United States, with a one-in-eight lifetime risk.1 The American Cancer Society estimates that in 2008, 182 460 women were diagnosed with breast cancer and 40 480 will die of the disease.2 X-ray mammography remains the imaging standard for breast cancer screening, demonstrating an overall sensitivity of ∼80% and a specificity of ∼90%. However, studies have shown repeatedly that sensitivity decreases with decreasing age and increasing breast density, and that breast fibroglandular tissue, more prominent in younger women (<50 yr), limits mammography, where sensitivity for breast cancer may be as low as 45% compared to almost 100% for predominantly fatty breasts.3, 4, 5 Thus, alternative imaging modalities (e.g., MRI, which consistently demonstrates higher sensitivity than mammography, albeit with decreased specificity) continue to be explored for improving diagnostic accuracy in women with dense breasts and other populations.6 In 2007, the American Cancer Society recommended annual screening with breast MR imaging for women with greater than 20% lifetime risk of breast cancer.7 Of all the MR imaging techniques used for the assessment of breast cancer, dynamic contrast-enhanced MR imaging using gadolinium-based agents is the most established and widely used.8 Dynamic contrast-enhanced subtraction mammography9 and dynamic contrast-enhanced CT (DCE-CT) (Ref. 10) have been proposed as adjuncts to x-ray mammography. The rationale for employing these dynamic contrast-enhanced methodologies is to look for angiogenic biomarkers of cancer.
The development of alternative technologies to look for angiogenic biomarkers of breast cancer based on hemoglobin absorption in the near infrared (NIR) is an area of intense research interest. Hemoglobin is a strong optical absorber in the near infrared and its presence in breast neoplasms is correlated with angiogenesis and elevated microvessel density. The absorption coefficient of hemoglobin in whole blood (150 g∕l) is ∼0.85 cm−1 at 800 nm,11 whereas hemoglobin-free breast tissue parenchyma has a reported absorption coefficient of only 0.04–0.05 cm−1 at the same wavelength and the effective scattering coefficient of all breast tissue is between 8 and 12 cm−1.12, 13 Of note, the resulting effective optical attenuation coefficient for an average breast is therefore ∼1.0–1.3 cm−1, which is only slightly greater than that reported at mammographic x-ray energies (0.5–0.8 cm−1),14 yet the differential contrast between hemoglobin-rich (tumors and blood vessels) and hemoglobin-deprived (fat and glandular) tissues is significantly greater than the differential contrast between tumor and surrounding breast tissue at x-ray energies. Realizing this, several groups have hypothesized that breast cancer can be detected without the need for exogenous contrast agents using photoacoustic imaging at near infrared wavelengths by virtue of a tumor’s elevated hemoglobin (blood) content, a result of angiogenic vascular growth.
Diffuse optical imaging technologies were developed over the years to interrogate the optical absorption and scattering properties of breast tissue via diffuse optical transmission and∕or reflectance, usually incorporating multispectral optical sources. Average levels of hemoglobin have been reported to be about a factor of 2 higher in malignant masses relative to “normal” breast tissues,15 but spatial resolution is very poor and the resulting volume-averaging effects mask the likely heterogeneous distribution of hemoglobin within malignant tumors, reduce SNR, and render characterizing a tumor’s morphology moot for all but large tumors.
A laser-based optoacoustic imaging system (LOIS) for detecting breast cancer was proposed over a decade ago by Oraevsky.16 The original device has undergone several iterations since that time. A recent publication describes a 64-element-annular array of rectangular transducer elements (20×3 mm) surrounding a hemicylindrical volume in which a breast is suspended.17 An alexandrite laser operating at 755 nm illuminates the breast normal to the imaging plane and a single plane through the breast is captured at a time. Spatial resolution within the imaging plane is reported to be 0.5 mm, a significant improvement over diffuse optical imaging, but cross-plane spatial resolution is relatively poor. Imaging multiple planes requires rotating the device relative to the breast, thus precluding dynamic 3D image acquisition.
Another common approach to photoacoustic imaging is to incorporate a pulsed light source into a conventional medical ultrasound probe, e.g., the optoacoustic plus ultrasound system developed by Haisch et al.18 Their device has the convenient property that spatially coregistered ultrasound and optoacoustic images are captured with a single device. Dynamic acquisition is possible, too, albeit over a single imaging plane. And as with the LOIS device, cross-plane spatial resolution is poor.
The Twente Photoacoustic Mammoscope, introduced by Manohar et al.19 in 2004, produces 3D images over a 90 mm field of view (FOV). It consists of a planar array of 590 PVDF detectors. The side of the compressed breast opposite the detector plane is scanned slowly with a 16 mm diameter laser beam as the array is repeatedly read out. The scan time is reported to be 30 min and the spatial resolution is 2.3–3.9 mm. Given the long scan time, dynamic imaging is not possible and the spatial resolution is poor relative to MRI and CT.
Indocyanine green (ICG), approved for human use, has an absorption comparable to hemoglobin in the NIR, binds to blood proteins, and acts as a blood pool agent.20 These properties make ICG an attractive optical contrast agent for visualizing blood flow dynamics in tumors and associated vasculature. Wang et al.21 demonstrated that ICG produces optical absorption that rivals that of hemoglobin and can be visualized through 6.2 times the 1∕e optical penetration depth (0.8 cm) in chicken muscle. As ICG is cleared efficiently by the liver, rapid dynamic imaging is required to visualize tumor dynamics following a bolus injection.
All these technologies are attractive from safety and cost perspectives, but none have the concurrent spatial and temporal resolutions required to visualize tumor morphology and blood flow dynamics with sensitivity that competes with other approaches. To meet this need, we are developing a unique, 3D photoacoustic tomography (PAT) system for imaging hemoglobin distribution in the breast and capable of dynamic, contrast-enhanced breast angiography for detecting and characterizing breast neoplasms.
APPROACH
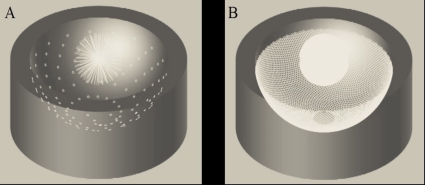
Building on our previous experience with PAT,22, 23, 24, 25, 26 we have developed a second generation small animal PAT scanner that employs a hemispherical array of transducers that allows us to capture 128 uniformly spaced radial “projections” at a time. The conceptual design for this scanner is illustrated in Fig. 1a. The device consists of an array of 128 3 mm diameter transducers (5 MHz center frequency) laid out in a spiral pattern on a hemispherical surface with a 100 mm radius of curvature. Each element of the array captures a radial projection through k-space. Rotating the array to multiple angular positions allows us to increase the density of k-space sampling while maintaining uniform angular sampling [Fig. 1b].
Figure 1.
(a) PAT transducer array captures 128 projections through k-space (white lines). (b) Increased k-space sampling after rotation of the array about its vertical axis.
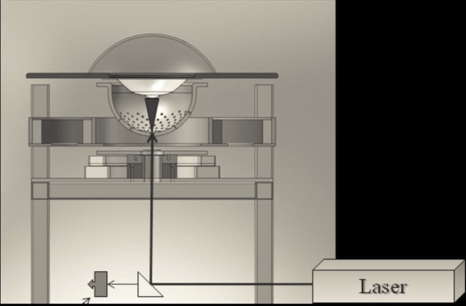
The animal to be imaged is placed in a custom plastic holder suspended above the bowl-array. The bowl is filled with fluid and illuminated from below through a −12 mm planoconvex lens by a tunable (680–950 nm) OPO laser operating at 10 Hz and 20 mJ∕pulse, as illustrated in Fig. 2. The physical width of the light beam measured ∼20 mm at the center-of-curvature of the bowl-array. The fluid-filled bowl-array is rotated continuously and radial projections are collected at a rate of 1280∕s, while the mouse remains stationary. A full set of data is acquired in 6, 12, or 24 s, corresponding to 7680, 15 360, or 30 720 radial projections.
Figure 2.
Pulsed light enters the liquid-filled imaging bowl along its vertical axis through an aperture at the bottom. The radius of the bowl is 100 mm. The bowl and liquid rotate continuously during data acquisition. A spectrometer monitors the wavelength and pulse power during data acquisition.
IMAGE RECONSTRUCTION
Time-dependent signals are recorded for each transducer i and angle j (i=1,…,128 and j=1,…,N, where N=60, 120, or 240) following each laser pulse. These signals are captured in parallel at a rate of 20 MHz and digitized to 12 bit precision. These recorded signals are related to the actual photoacoustic pressure signals pij(t) according to , where h(t) is the impulse response of the transducers and “ *” indicates convolution. Assume we do not know the impulse response of the transducer directly, but rather , the signal recorded due to the photoacoustic pressure p0(t) from a photoacoustic point source. We can then write . Assuming we measure and , Wang et al.27 have shown that the photoacoustic imaging equation takes the following form:
| (1) |
where ∮∫|rij|=ctA(r)dS are the projections of the optical absorption distribution A(r) over spherical surfaces and and are the Fourier transforms of and , respectively. Note that knowledge of the actual impulse response h(t) of the system is not required. The parameters Cp, β, c, k are the specific heat, coefficient of thermal volume expansion, speed of sound, and a proportionality constant that depends on the illumination geometry and the absorption and scattering properties of the tissue. The optical absorption distribution can then be reconstructed using a filtered backprojection algorithm, provided a sufficient number of projections have been acquired. We use a Fourier filter function of the form F(ω)=−(ω∕ωC)α(1+cos(πω∕ωC)), where 1≤α≤2 and ωC is the cutoff frequency of the filter.
The value of α is varied to change the degree of high spatial frequency enhancement in the final image. Filtered projections are then backprojected over spherical surfaces.
METHODS
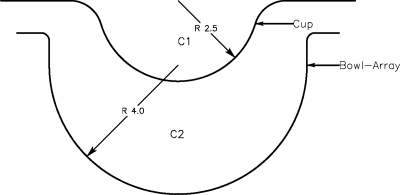
We modified our small animal scanner in two ways to image human breasts. First, we installed a 60° holographic diffuser (Edmunds, Edmunds Optical, Barrington, NJ, PN 53871) at the base of the imaging bowl-array, just above the planoconvex lens, to spread out the illumination beam. Second, we installed a 5 in. diameter, hemispherical, semirigid “cup” molded from .020 in. thick clear PETG above the imaging bowl, as illustrated in Fig. 3. This stationary cup, which is optically and acoustically transparent, was suspended in the water bath that filled the imaging bowl-array. The purpose of this cup is to separate the breast from the water bath, which rotates, and to immobilize the breast during imaging. The shape of the cup also defines the shape of the breast margins.
Figure 3.
Plastic breast holder (cup) suspended above the water-filled imaging bowl-array. The speed of sound, C2, in the imaging bowl is known based on its temperature. The unknown speed of sound in the breast, C1, is assumed to be uniform and may differ from that of water.
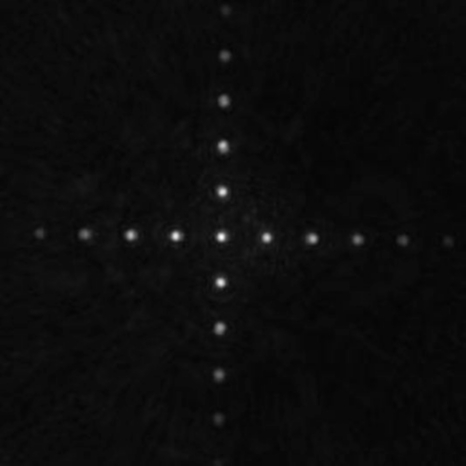
We fabricated a 2D target consisting of 0.8 mm diameter black dots imprinted on clear plastic and arrayed as a cross on 5 mm centers spanning 51.2 mm to obtain a map of the incident light field and assess the spatial uniformity of the resulting image. This target was placed in the water-filled cup and imaged at 800 nm using a 6 s scan (60 angles). A 3D image was reconstructed using the filtered backprojection algorithm described above with a cutoff frequency of ωC=4.0 MHz.
Prior to patient imaging, the water bath was heated to 30–32 °C for patient comfort. A small amount of water was placed in the cup prior to breast positioning to couple the breast to the bowl-array acoustically. The patient volunteer stood next to the PAT scanner, bent over, and placed one of her breasts into the plastic cup. The patient was instructed to remain still, but was allowed to breathe normally during the imaging procedure. The breast was then imaged at 800 nm using a 24 s scan protocol (240 angles).
A two-component velocity-of-sound algorithm was used to calculate the times of flight used in the breast reconstructions. We first calculated the velocity of sound within the water bath, based on a temperature calibration we performed in our laboratory. We then assumed that the velocity of sound within the breast was uniform, but different from that of water. Since the location of the breast-water boundary was determined by the supporting hemispherical cup geometry, we were able to calculate the times of flight based on the distances traversed through water and breast tissue between each voxel and each detector location. We chose an “optimum” breast sound velocity by comparing vessel visibility qualitatively following image reconstruction.
The 3D breast images were reconstructed in the same manner as the black dot phantom. The phantom was reconstructed on a grid of 0.2×0.2×0.2 mm3 voxels, whereas breast images were reconstructed on a grid of 0.125×0.125×0.125 mm3 voxels. The only additional processing was to form maximum intensity projections (MIPs) for display.
RESULTS
A maximum intensity projection image was computed from the 3D image of the illumination phantom along the vertical axis. The resulting image (51.2×51.2 mm2) is shown in Fig. 4 and indicates that the illumination pattern spans a diameter of approximately 50 mm. The mean illumination fluence within this region was estimated to be ∼1 mJ∕cm2. Note that the breast skin margin and imaging cup are not well-visualized as their absorption is significantly lower than hemoglobin in the blood.
Figure 4.
PAT image of crossed-dot pattern with 5 mm spacing showing spatial light distribution across the center 51.2×51.2 mm2 FOV.
Two MIPs of the left breast of a 57 yr old patient volunteer are shown in Fig. 5a (lateral projection) and Fig. 5b (anterior-posterior projection). Figures 5a, 5b have 64×50 and 64×64 mm2 fields of view, respectively. Submillimeter vessels are visible to a depth of 40 mm [Fig. 5a, hollow arrow] beneath the front of the breast [Fig. 5a, two arrows]. The diameter of the largest vessel visualized is less than 1 mm. Two MIP movies, depicting the rotation of the 3D breast around two orthogonal axes, can be viewed at http://www.optosonics.com/breast-images.html.
Figure 5.
MIPs of the left breast of a 57 yr old patient volunteer in (a) lateral projection and (b) anterior-posterior projection. The white box in the upper left of (a) represents 1×1 cm2. Two MIP movies, depicting rotation of the 3D breast around two orthogonal axes, can be viewed at http://www.optosonics.com/breast-images.html.
DISCUSSION
We have demonstrated, for the first time, detailed vascular anatomy in the breast without the use of a contrast agent and with spatial resolution that is competitive with clinical MRA or DCE-CT.
To achieve these results, we had to account for the difference in the speed of sound between the breast and the surrounding water within the imaging bowl. Imaging results were compromised if only a single velocity of sound for both breast tissue and water was enfolded into the reconstruction. For the image shown in Fig. 5, we used 1.51 and 1.47 mm∕μs sound velocities within the water and breast, respectively. These results suggest that using a two-component sound velocity reconstruction may provide satisfactory results, though we need greater experience with a range of breast types before we can say this approach will always suffice.
Surprisingly, we were able to capture a significantly wider FOV than one might have expected by considering the directivity function of our transducers alone. If we consider only the center frequency (5 MHz, λ=0.3 mm) of our 3 mm diameter detectors, we would predict a ±7 mm FOV (−6 dB) at the level of the breast. In contradistinction to ultrasonic imaging, however, the temporal frequency content of our photoacoustic signals is dictated not only by the frequency response of our transducers, but also by the spatial distribution of optical absorbers within the FOV. Neglecting the transducer’s frequency response for the moment, a 0.5 mm diameter tube, e.g., will produce a PA spectrum from 0 to 3.5 MHz, with a peak at 1.75 MHz. For such a structure, the FOV is increased to ±18 mm (−6 dB) for a 3 mm, flat-faced detector. A 1 mm diameter vessel would have a peak PA signal at 0.9 MHz with an additional doubling of the FOV. Currently, the peak response of our 5 MHz transducer lies outside the 4.0 MHz passband of our reconstruction filter and above the predominant, photoacoustic temporal frequencies generated by vascular structures within the breast. We would likely have had greater imaging sensitivity (SNR) had we used a transducer with a lower center frequency. This will be the subject of future investigations.
We have successfully visualized submillimeter breast vasculature to a depth of 40 mm using an illumination intensity that is 32 times less than the maximum permissible exposure at 800 nm according to the American National Standard for Safe Use of Lasers.28 Clearly, we can achieve greater penetration depth in the breast by increasing the intensity and cross-sectional area of the illuminating laser beam. To image the entire breast volume, however, it will be necessary to redesign our detector array to achieve a wider field of view. Lastly, our 24 s image acquisition time is compatible with dynamic imaging using an optical contrast agent, e.g., indocyanine green.
ACKNOWLEDGMENTS
This work was sponsored in part by funding from the National Institutes of Health, Grant No. 5R44102891.
References
- Ries L. A. G.et al. , SEER Cancer Statistics Review, 1975–2005. National Cancer Institute, Bethesda, MD. Available at http://seer.cancer.gov/scr/1975_2005/.
- American Cancer Society, Cancer Facts and Figures 2008 (American Cancer Society, Atlanta, 2008). [Google Scholar]
- Carney P. A. et al. , “Individual and combined effects of age, breast density, and hormone replacement therapy use on the accuracy of screening mammography,” Ann. Intern Med. 138(3), 168–175 (2003). [DOI] [PubMed] [Google Scholar]
- Rosenberg R. D. et al. , “Effects of age, breast density, ethnicity, and estrogen replacement therapy on screening mammographic sensitivity and cancer stage at diagnosis: Review of 183,134 screening mammograms in Albuquerque, New Mexico,” Radiology 209(2), 511–518 (1998). [DOI] [PubMed] [Google Scholar]
- Kerlikowske K. et al. , “Likelihood ratios for modern screening mammography. Risk of breast cancer based on age and mammographic interpretation,” JAMA, J. Am. Med. Assoc. 276(1), 39–43 (1996). 10.1001/jama.276.1.39 [DOI] [PubMed] [Google Scholar]
- Berg W. A. et al. , “Diagnostic accuracy of mammography clinical examination, US, and MR imaging in pre-operative assessment of breast cancer,” Radiology 233, 830–849. 10.1148/radiol.2333031484 [DOI] [PubMed] [Google Scholar]
- Saslow D. et al. , “American Cancer Society guidelines for breast screening with MRI as an adjunct to mammography,” Ca-Cancer J. Clin. 57, 75–89 (2007). 10.3322/canjclin.57.2.75 [DOI] [PubMed] [Google Scholar]
- Moon M., Cornfeld D., and Weinreb J., “Dynamic contrast-enhanced breast MR imaging,” Magn. Reson Imaging Clin. N. Am. 17, 351–362 (2009). 10.1016/j.mric.2009.01.010 [DOI] [PubMed] [Google Scholar]
- Dromain C., Balleyguier C., Adler G., Garbay J. R., and Delaloge S., “Contrast-enhanced digital mammography,” Eur. J. Radiol. 69(1), 34–42 (2009). 10.1016/j.ejrad.2008.07.035 [DOI] [PubMed] [Google Scholar]
- Brix G., Griebel J., Kiessling F., and Wenz F., “Tracer kinetic modeling of tumour angiogenesis based on dynamic contrast-enhanced CT and MRI measurements,” Eur. J. Nucl. Med. Mol. Imaging 37(S1), S30–S51 (2010). 10.1007/s00259-010-1448-7 [DOI] [PubMed] [Google Scholar]
- Wray S., Cope M., Delpy D. T., Wyatt J. S., and Reynolds E. O. R., Biochim. Biophys. Acta 933, 184–192 (1988). 10.1016/0005-2728(88)90069-2 [DOI] [PubMed] [Google Scholar]
- Pifferi A. et al. , “Spectroscopic time-resolved diffuse reflectance and transmittance measurements of the female breast at different interfiber distances,” J. Biomed. Opt. 9(6), 1143–1151 (2004). 10.1117/1.1802171 [DOI] [PubMed] [Google Scholar]
- Cerussi A., Shah N., Hsiang D., Durkin A., Butler J., and Tromberg B. J., “In vivo absorption, scattering, and physiologic properties of 58 malignant breast tumors determined by broadband diffuse optical spectroscopy,” J. Biomed. Opt. 11(4), 044005 (2006). 10.1117/1.2337546 [DOI] [PubMed] [Google Scholar]
- Heine J. J. and Thomas J. A., “Effective x-ray attenuation coefficient measurements from two full field digital mammography systems for data calibration applications,” Biomed. Eng. Online 7, 13 (2008). 10.1186/1475-925X-7-13 [DOI] [PMC free article] [PubMed] [Google Scholar]
- Tromberg B. J. et al. , “Assessing the future of diffuse optical imaging technologies for breast cancer management,” Med. Phys. 35(6), 2443–2451 (2008). 10.1118/1.2919078 [DOI] [PMC free article] [PubMed] [Google Scholar]
- Oraevsky A. A., Esenaliev R. O., Jacques S. L., Tittel F. K., and Medina D., in Trends in Optics and Photonics, edited by Alfano R. R. and Fujimoto J. G. (OSA, Washington, D.C., 1996), pp. 316–321. [Google Scholar]
- Ermilov S. A. et al. , “Laser optoacoustic imaging system for detection of breast cancer,” J. Biomed. Opt. 14(2), 024007–024014 (2009). 10.1117/1.3086616 [DOI] [PubMed] [Google Scholar]
- Haisch C. et al. , “Combined optoacoustic/ultrasound system for tomographic absorption measurements: Possibilities and limitations,” Anal. Bioanal. Chem. 397, 1503–1510 (2010). 10.1007/s00216-010-3685-9 [DOI] [PubMed] [Google Scholar]
- Manohar S., Kharine A., van Hespen J. C. G., Steenbergen W., and van Leeuwen T. G., “Photoacoustic mammography laboratory prototype: Imaging of breast tissue phantoms,” J. Biomed. Opt. 9, 1172–1181 (2004). 10.1117/1.1803548 [DOI] [PubMed] [Google Scholar]
- Cherrick G. R. et al. , “Indocyanine green: Observations on its physical properties, plasma decay and hepatic extraction,” J. Clin. Invest. 39(4), 592–600 (1960). 10.1172/JCI104072 [DOI] [PMC free article] [PubMed] [Google Scholar]
- Ku F. and Wang L. V., “Deeply penetrating photoacoustic tomography in biological tissues enhanced with an optical contrast agent,” Opt. Lett. 30(5), 507–509 (2005). 10.1364/OL.30.000507 [DOI] [PubMed] [Google Scholar]
- Kruger R. A. and Liu P. -Y., “Photoacoustic ultrasound: Pulse production and detection in 0.5% Liposyn,” Med. Phys. 21(7), 1179–1184 (1994). 10.1118/1.597399 [DOI] [PubMed] [Google Scholar]
- Kruger R. A., Liu P. -Y., and Fang Y., “Photoacoustic ultrasound (PAUS)—Reconstruction tomography,” Med. Phys. 22(10), 1605–1609 (1995). 10.1118/1.597429 [DOI] [PubMed] [Google Scholar]
- W.Kiser, Jr. and Kruger R. A., “Thermoacoustic computed tomography—Imaging simulations,” Proc. SPIE 3659, 895–904 (1999). 10.1117/12.349572 [DOI] [Google Scholar]
- Kruger R. A., Miller K. D., Reynolds H. E., W. L.Kiser, Jr., Reinecke D. R., and Kruger G. A., “Contrast enhancement of breast cancer in vivo using thermoacoustic CT at 434 MHz,” Radiology 216, 279–283 (2000). [DOI] [PubMed] [Google Scholar]
- Kruger R. A., W. L.Kiser, Jr., Reinecke D. R., Kruger G. A., and Miller K. D., “Thermoacoustic optical molecular imaging of small animals,” Mol. Imaging 2(2), 113–123 (2003). 10.1162/153535003322331993 [DOI] [PubMed] [Google Scholar]
- Wang Y., Zeng Y., and Chen Q., “Photoacoustic imaging with deconvolution algorithm,” Phys. Med. Biol. 49, 3117–3124 (2004). 10.1088/0031-9155/49/14/006 [DOI] [PubMed] [Google Scholar]
- ANSI, Z136.1-2007.


