

Abstract
Although malfunctioning of inhibitory processes is proposed as a pathophysiological mechanism in schizophrenia and has been studied extensively with the P50 gating paradigm, the brain regions involved in generating and suppressing the P50 remain unclear. The current investigation used EEG source analysis and the standard S1-S2 paradigm to clarify the neural structures associated with P50 gating in16 schizophrenia patients and 14 healthy subjects. Based on prior research, the superior temporal gyrus, hippocampus, dorsolateral prefrontal cortex, thalamus, and their dipole moments were evaluated. In modeling the P50, a neural network involving all four brain regions provided the best goodness-of-fit across both groups. In healthy subjects, the P50 ratio score correlated positively with the hippocampal dipole moment ratio whereas a significant association with the DLPFC dipole moment ratio was observed in schizophrenia patients. In each instance, the neural structure was found to account for unique variance in explaining the P50 ratio, along with some suggestion of DLPFC involvement in healthy subjects.
Keywords: schizophrenia, sensory gating, inhibitory deficits, EEG source analysis, hippocampus, dorsolateral prefrontal cortex
Deficits in the ability to filter relevant from irrelevant information are thought to contribute to many of the difficulties experienced by individuals with schizophrenia (Freedman et al., 1996; Turetsky et al., 2007; Venables, 1964), ranging from an inability to maintain focus during a conversation to feeling bombarded and overwhelmed by the physical environment. Although malfunctioning of inhibitory processes is proposed as a pathophysiological mechanism in schizophrenia (Freedman et al., 1996) and has been studied extensively with the P50 sensory gating paradigm (see Bramon, Rabe-Hesketh, Sham, Murray, & Frangou. 2004), the brain regions involved and their associated neural dynamics remain unclear. Some progress has been made but results from brain mapping research are quite varied and often deviate from those obtained with invasive studies of humans and animals. Such discrepancies may reflect procedural differences or reliance on neuroimaging techniques that are sensitive to different and potentially non-overlapping aspects of the sensory gating process.
The predominant method for demonstrating impaired sensory gating in humans is the paired-stimulus P50 paradigm, during which a brief, initial stimulus (“Stimulus 1”) activates an inhibitory mechanism to minimize the disruptive effects of an identical second stimulus (“Stimulus 2”) that occurs 500 ms later (Adler et al., 1982; Freedman et al., 1987; Freedman et al., 1996; Freedman, Adler, Waldo, Pachtman, & Franks, 1983). Patients with schizophrenia have consistently been shown to exhibit deficient inhibitory processing relative to healthy individuals with poor suppression of P50 to Stimulus 2, although methodological differences may contribute to some heterogeneity in results (Bramon et al., 2004; de Wilde, Bour, Dingemans, Koelman, & Linszen, 2007a; Heinrichs, 2001; Patterson et al., 2008). The objectives of this study were to utilize high-density EEG source analysis and the standard P50 paradigm to evaluate potential neural generators associated with P50 generation and suppression in healthy subjects and patients with schizophrenia.
Multiple lines of animal research implicate the CA3 region of the hippocampus in P50 suppression, with a particular role of the alpha7-nicotinic receptor (Adler et al., 1998; Bickford-Wimer etal., 1990). This receptor is particularly abundant in the CA3 region of the rat hippocampus (Cullum et al., 1993), with blockade of the receptor resulting in loss of suppression of the animal analogue of the human hippocampal P50 wave (Luntz-Leybman, Bickford, & Freedman, 1992). Involvement of the hippocampus in sensory gating has also been demonstrated in earlier studies using depth electrodes with human epilepsy patients (Goff, Williamson, VanGilder, Allison, & Fisher, 1980; Wilson, Babb, Halgreen, Wang, & Crandall, 1984), although some more recent investigations have questioned hippocampal contributions to the P50 (e.g., Boutros et al., 2008; Rosburg et al., 2008). One constraint associated with studies relying on patients with suspected hippocampal pathologies is that they may not be representative of normal processes in healthy individuals or even abnormal functioning in schizophrenia patients.
Another candidate region is the nucleus reticularis thalami, an additional area with an abundance of alpha7-nicotinic receptors (Freedman, Adams, & Leonard, 2000) involved in regulating inhibitory feedback control of thalamic to cortical pathways (Scheibel, 1997). Notably, Court et al. (1999) observed a 25% reduction of the alpha7-nicotinic receptors in this neural structure in schizophrenia patients compared to healthy subjects. Further support for thalamic involvement comes from studies with cats (Hinman & Buchwald, 1983), given the correspondence between human and cat midlatency ERP responses (Erwin & Buchwald, 1987).
Using trains of auditory stimuli, magnetoencephalogram (MEG) studies with non-psychiatric populations have generally localized the M50, the MEG analogue of P50, to the STG or the nearby primary auditory cortex (Huotilainen et al., 1998; Kanno, Nakasato, Murayama, & Yoshimoto, 2000; Makela, Hamalainen, Hari, & McEvoy, 1994; Onitsuka, Ninomiya, Sato, Yamamoto, & Tashiro, 2003; Reite, Teale, Zimmerman, Davis, & Whalen, 1988a; Yoshiura, Ueno, Iramina, & Masuda, 1995). Godey, Schwartz, de Graaf, Chauvel, and Liegeois-Chauvel (2001) confirmed these neural sources using MEG as well as intracerebral depth electrodes implanted in the auditory cortex of epilepsy patients. Sources in the STG or the primary auditory cortex also have been demonstrated in patients with schizophrenia in response to trains of auditory stimuli (Reite et al., 1988b) as well as in response to paired stimuli (Huang et al., 2003; Thoma et al., 2003).
Involvement of prefrontal brain areas is suggested by evidence of P50 suppression deficits in neurological patients with lesions in this region (Knight, Scabini, & Woods, 1989). Covering temporal and frontal lobe brain areas with intracranial microelectrode grids, Korzyukov and colleagues (2007) detected significant contributions to P50 generation from both regions in a significant proportion of epilepsy patients. Utilizing EEG source analysis with the paired-stimulus paradigm in healthy individuals, Weisser and colleagues (2001) obtained evidence to corroborate contributions from the mid-frontal cortex in P50 gating although a specific neural structure was not specified.
Synthesis of these divergent findings is provided by recent fMRI studies, suggesting that a neural network subserves the generation of P50 and sensory gating. Relying on a modified P50 gating paradigm, Tregellas and colleagues (2007) determined that the STG, hippocampus, thalamus and dorsolateral prefrontal cortex (DLPFC) are all associated with the P50 response. Relative to healthy individuals, schizophrenia patients exhibited greater activation in the hippocampus, thalamus, and DLPFC but no group difference in the STG during the modified gating paradigm. Across healthy participants and schizophrenia patients, the P50 ratio score was found to be positively correlated with activation in the hippocampus, thalamus, and DLPFC. The authors noted that failure to detect group differences may have resulted from reliance on a modified P50 paradigm and on a summed hemodynamic response. These associations were largely replicated in a subsequent study using urban white noise as the stimulus (Tregellas, Ellis, Shatti, Du, & Rojas, 2009). Similarly, Mayer and colleagues (2009) showed distinct contributions from auditory cortices, prefrontal cortex and thalamus when evaluating the hemodynamic response in healthy subjects.
Results from these human brain mapping and animal studies highlight several key brain regions that may contribute to P50 and its suppression as well as the P50 gating deficit in schizophrenia. The present investigation aimed to build on these earlier findings and to utilize high-density EEG source analysis and the paired-stimulus P50 paradigm to further evaluate the potential neural generators associated with P50 gating in healthy subjects and patients with schizophrenia. EEG source analysis provides a unique opportunity to evaluate the association between a neural network involving the STG, hippocampus, DLPFC, and thalamus, and EEG-derived measures of P50 that constitute much of the research literature on sensory gating in schizophrenia.
Methods
Participants
Sixteen patients with schizophrenia were entered into the study. All patients were clinically stable as reflected by the Brief Psychiatric Rating Scale (BPRS) (Ventura et al., 1993) and receiving antipsychotic medication at the time of testing. Thirteen schizophrenia patients were treated with second-generation antipsychotic medications, two patients received first-generation antipsychotics, and one patient received both. Antiparkinsonian medications were discontinued at least 24 hours before testing due to potential anticholinergic effects on the dependent measures. Patients were drawn from participants originally recruited for the UCLA Developmental Processes in Schizophrenic Disorder project (Nuechterlein et al., 1992). Diagnoses were made with the Structured Clinical Interview for DSM-IV (SCID; Ventura, Liberman, Green, Shaner, & Mintz, 1998).
Seventeen healthy comparison subjects were recruited from the community, screened with the SCID, and excluded if a past or current major psychiatric disorder was reported for the participant or a first-degree relative. Exclusion criteria for both groups included substance or alcohol abuse in the last 3 months, a history of head trauma, a major medical condition or loss of consciousness for more than 5 minutes, and mental retardation. Data were excluded from 2 healthy participants due to an insufficient number of artifact-free trials. Data from an additional comparison subject were excluded because the P50 to Stimulus 1 was below 0.5 microvolts (μV) and could not be measured reliably. Thus, the final sample consisted of 14 healthy individuals. After providing a complete description of the study, written informed consent was obtained from all participants. Demographic and clinical characteristics are summarized in Table 1.
Table 1.
Demographic and Clinical Characteristics of Participants
| Healthy Comparison Subjects (n = 14) |
Schizophrenia Patients (n = 16) |
|||||
|---|---|---|---|---|---|---|
| M | SD | M | SD | Statistic | p | |
| Age (years) | 23.4 ± 4.4 | 27.6 ± 7.0 | F(1,28)=3.62 | .07 | ||
| Education (years) | 14.6 ± 1.4 | 13.5 ± 1.5 | F(1,28)=3.91 | .06 | ||
| Parental Education (years) | 14.3 ± 2.3a | 12.2 ± 4.3 | F(1,25)=2.13 | .16 | ||
| Antipsychotic medication Dosage (Cpz Equiv in mg) | NA | 263 ± 145 | - | - | ||
| Duration of illness (years) | NA | 4.8 ± 6.0 | - | - | ||
| BPRS 24-item total score | NA | 34.2 ± 9.1 | - | - | ||
|
n |
n |
|||||
| Gender | X2(1)=.20 | .65 | ||||
| Male | 9 | 9 | ||||
| Female | 5 | 7 | ||||
| Race | X2(4)=5.89 | .21 | ||||
| Asian | 1 | 2 | ||||
| African American | 5 | 1 | ||||
| Hispanic or Latina/o | 4 | 6 | ||||
| White | 3 | 7 | ||||
| Mixed | 1 | 0 | ||||
| Diagnosis | - | - | ||||
| Schizophrenia | NA | 13 | ||||
| Schizoaffective | NA | 2 | ||||
| Schizophreniform | NA | 1 | ||||
Cpz Equiv, Chlorpromazine Equivalents; BPRS, Brief Psychiatric Rating Scale
n = 11
Psychophysiological Recording Methods and Apparatus
EEG recordings were obtained using an elastic cap containing 124 Ag-AgCl sintered electrodes (Falk Minow Services, Herrsching, Germany) with an equidistant layout. All electrode sites, including the right earlobe, were referenced to the left earlobe during data acquisition and re-referenced offline to averaged earlobes. The electrooculogram (EOG) was recorded by placing electrodes above and below the right eye and near the outer canthi of the eyes. All impedances were below 10 kOhms. Signals were collected with a SynAmps system (Neuroscan, Charlotte, NC) at a sampling rate of 1000 Hz and using a bandpass of 0.5 Hz to 200 Hz. The EEG was amplified 2,500 times and EOG signals were amplified 500 times with a resolution of .03μV and .17μV per least significant bit, respectively.
Auditory stimuli
Stimuli were delivered using the STIM presentation unit (Neuroscan, Charlotte, NC) and presented through foam-insert earphones. Threshold levels for each ear were determined separately and stimuli were delivered at 55-dB SPL above each subject’s sound threshold. Stimuli were 3 ms in duration and presented in pairs with an interstimulus interval of 500 ms. The ITI between pairs of stimuli varied between 9 and 12 s.
Procedure
To verify normal hearing, audiometric screening was conducted by presenting participants with a range of sound intensities (40 to 0 decibels [dB] in 5-dB decrements) at different frequencies (250, 1000, 2000, 4000, and 8000 Hz). All participants were able to detect sounds above 30 dB SPL at each frequency with each ear. After instructing participants to sit quietly in a sound-attenuated room, they were presented with 80 trials of paired stimuli, with a 30-s rest period after 40 trials.
Waveform and scalp component analysis
After single trials were screened to exclude movement artifact, blind source separation by extended Infomax independent component analysis (ICA) was performed in Matlab (The Mathworks, Inc., Natick, MA) to correct for eye movement and heart rate artifact (Jung et al., 2001; Lee, Girolami, & Sejnowski, 1999). On average, 5.94 % (SD = 2.56 %) and 4.79 % (SD = 1.87 %) of the data were removed from healthy subjects and schizophrenia patients, respectively, with no significant difference between the groups (F = 1.99, df = 1, 28, p = .17). Non-cerebral artifacts were identified and removed according to standardized criteria by technicians blind to diagnostic status. Possible artifact activity in an independent component was required to correspond temporally to artifact activity visible in the raw data prior to removal. All trials were then filtered at 10-50 Hz for measuring the P50 ERP while minimizing contributions from N100. A prestimulus baseline of -200 to 0 ms was subtracted from each average waveform before ERP scoring, but not prior to EEG source analysis. A minimum of 60 trials was included in each ERP average.
For standard ERP component scoring, a computer algorithm was implemented. P50 was measured at Cz and identified as the most positive peak between 35 and 75 ms after stimulus onset. P50 amplitude was measured as the difference between the P50 amplitude and the N40 amplitude. The N40 was determined as the most negative peak between the P30 and P50 latency. The P30 was identified as the most positive component between 20 and 40 ms after stimulus onset. As noted above, one healthy subject was excluded from all analyses because P50 amplitude to Stimulus 1 was less than .5 μV, and it is difficult to discriminate such a small signal from noise in the data. In the absence of a discernable P50 peak in response to Stimulus 2, it was scored as having zero amplitude and interpreted as reflecting complete suppression. All scoring was subsequently verified by trained raters who were blind to group membership. The P50 suppression ratio was calculated as P50 amplitude to Stimulus 2 divided by P50 amplitude to Stimulus 1.
EEG Source Analysis
All source analysis computations were carried out using CURRY V5.0 software (Neuroscan, Charlotte, NC). To reconstruct the generators of the measured scalp data, a realistically-shaped boundary element model (BEM) was generated using the standardized MRI dataset available in CURRY (Fuchs, Kastner, Wagner, Hawes, & Ebersole, 2002). To co-register EEG data with the standardized MRI dataset from the Montreal Neurological Institute (MNI), three-dimensional coordinates of the electrode positions and three fiducial landmarks (the nasion, and the left and right preauricular points) were determined for each participant with an Isotrak spatial digitizer. For source localization, landmarks and electrode positions were then aligned with the standardized MRI image.
The BEM model contains 3 layers, which represent the scalp, skull, and brain. Standard conductivities of 0.33, 0.0042, and 0.33 S/m were used for the cerebrospinal fluid, skull, and skin, respectively. For dipole fitting, a time interval was selected for each individual by including activity between the two time points of the filtered and trial-averaged P50 waveform that corresponded to a signal amplitude of 50% of the P50 peak amplitude relative to the value of the preceding and subsequent negative peaks. The average strength of a source or “dipole moment” was determined over this latency range. Due to the restrictive filter settings, risk of tapping into the N100 should be minimal. Fixed dipoles were seeded based on prior empirical findings as described above. Specifically, dipoles were seeded bilaterally and allowed to vary within a 1 cm radius around the center of the seeded position (right and left x, y, z coordinates provided in MNI space) at a) STG (right: 49.2, 4.9, 52.4; left: -51.1, -.6, 54.3), hippocampus (right: 27.4, 7.3, 28.6; left: -27.6, 7.3, 28.6), DLPFC (right: 36.3, 71.1, 59.8; left: -35.5, 67.7, 59.8), and thalamus (right: 10.9, 7.9, 65.0; left: -10.2, 7.9, 65.0). Dipoles were fitted simultaneously, and dipole orientations were allowed to vary.
Considering the increased risk of producing an overdetermined model when seeding a number of dipoles, the goodness-of-fit (Gof) of the proposed model was validated by comparing it to a model using 8 theoretically-unrelated dipoles. If the Gof of the proposed dipole model is due solely to the seeding of a large number of dipoles rather than the capture of a valid solution, there should be no difference in the amount of variance explained by the two models. If, however, the proposed model explains more of the variance than the model consisting of theoretically-unrelated dipoles, it can be inferred that the proposed neural regions are more likely involved in P50 generation. Using the same seeding procedure described above, dipoles for the second model were seeded at (x,y,z MNI coordinates) dipole 1 (-18.2, -69.0, 58.0), dipole 2 (28.8, -42.0, 12.4), dipole 3 (0.0, 63.1, 27.2), dipole 4 (-40.3, 16.1, 100.2), dipole 5 (17.3, -66.5, 62.5), dipole 6 (28.8, -39.4, 97.0), dipole 7 (34.5, 31.7, 102.3), dipole 8 (-16.3, 36.6, 81.4). To gain confidence in whether each neural region is a component of the proposed neural network, the individual contributions of the STG, hippocampus, thalamus, and DLPFC also were examined by comparing each region against theoretically-unrelated bilateral dipoles. The fidelity of the proposed source model was further evaluated by examining the number of dipoles localized to the edge of the 1cm search radius. A dipole was considered to have reached the edge when any of its MNI coordinates (i.e., x, y, z) fell within .5 millimeters of the outer search window. This analysis was conducted separately for each group and stimulus.
Data analysis
Analyses of variance (ANOVA) were conducted to examine traditional EEG indices of P50 suppression. To determine if group differences were present, the P50 ratio score was examined with one between-subjects factor, group (healthy comparison subjects versus schizophrenia patients). P50 amplitude data were subjected to ANOVA using one within-subjects fully crossed factor, stimulus (Stimulus 1 versus Stimulus 2), and one between-subjects factor, group, to provide a difference score measure of suppression. Greenhouse-Geisser corrected p values were used throughout (Geisser & Greenhouse, 1958).
The Gof of the dipole models was expressed as the percentage of explained variance that the dipole solution fit the observed P50 to Stimulus 1 and Stimulus 2. To test for group differences, a repeated-measures ANOVA was applied with one within-subjects factor, stimulus, and one between-subjects factor, group. A one-way ANOVA was calculated for each stimulus separately to compare the Gof of 1) the proposed dipole model with the model consisting of 8 theoretically-unrelated dipoles, and 2) each neural region (i.e., STG, hippocampus, DLPFC, and thalamus) individually with bilateral theoretically-unrelated dipoles. To examine potential changes in dipole moments between Stimulus 1 and Stimulus 2, a repeated-measures ANOVA was conducted with two within-subjects factors, neural structure (STG vs. hippocampus vs. thalamus vs. DLPFC) and stimulus, and one between-subjects factor, group. Post hoc analyses were performed throughout using t-tests at a 95% level of confidence.
An analogue to the P50 suppression ratio was calculated for each neural structure (dipole moment 2/dipole moment 1) in order to assess the relationships between dipole moments and the P50 suppression ratio. Pearson correlations were computed to evaluate these relationships.
Results
Demographic and Clinical Characteristics
As shown in Table 1, the schizophrenia patient group was matched to the healthy comparison group on level of parental education, sex, and race. The patient sample tended to be somewhat older and their education levels were slightly lower than the healthy group, as reflected by statistical trend effects. Average ratings on the BPRS indicate that the patients exhibited low symptom levels overall, as might be expected of a clinically stabilized sample.
P50 Suppression Ratio and P50 Amplitudes
Grand-average ERP waveforms are presented in Figure 1. As expected, schizophrenia patients exhibited impaired P50 suppression (M = .59, SD = .31) relative to healthy comparison subjects (M = .35, SD = .20) on the ratio measure (F = 6.26, df = 1, 28, p < .05). P50 suppression ratios and amplitudes obtained for the two groups are illustrated in Figure 2. Although the group by stimulus interaction was not statistically significant (F = .47, df = 1, 28, p = .50), the significant P50 ratio score difference between groups can be attributed largely to differences in Stimulus 2 amplitude (schizophrenia patients: M = 2.51, SD = 1.44; healthy comparison subjects: M = 1.55, SD = 1.16; F = 3.92, df = 1, 28, p = .058) as amplitude differences to Stimulus 1 were not evident between the groups (schizophrenia patients: M = 4.56, SD = 2.63; healthy comparison subjects: M = 4.06, SD = 2.46; F = .29, df = 1, 28, p = .60).
Figure 1.
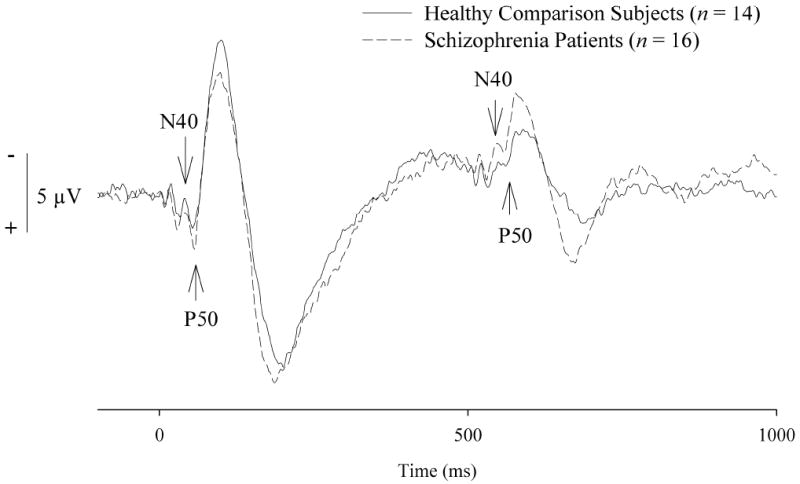
Grand average event-related potential waveforms at the Cz recording site. Waveforms are unfiltered, and the N40 and P50 components are indicated with arrowheads.
Figure 2.
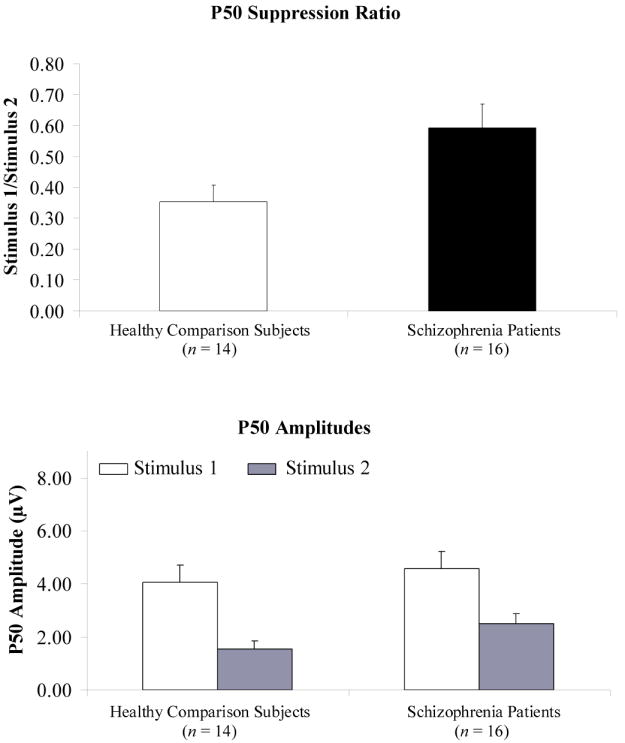
Mean P50 suppression ratios and P50 amplitudes to paired stimuli for healthy comparison subjects and schizophrenia patients.
Evaluation of Dipole Model
To assess Gof of the proposed dipole model, the total amount of variance explained was examined. A considerable percentage of the variance was accounted for in healthy subjects: (Stimulus 1 = 94.89%, Stimulus 2 = 94.39%) and patients with schizophrenia (Stimulus 1 = 93.70%, Stimulus 2 = 91.02%). No effects involving group or stimulus approached statistical significance. To validate the adequacy of the proposed model, an anatomically-unconstrained dipole was added but was not found to contribute substantial power in explaining the total variance (i.e., less than one-half percent). Moreover, the individual contribution of each region within the proposed neural network accounted for a significantly greater proportion of the total variance than that of theoretically-unrelated dipoles (all p-values less than .05). The proposed dipole model was also found to explain significantly more of the total variance when compared to the model consisting of 8 theoretically-unrelated dipoles for Stimulus 1 (M’s = 94.26% vs. 91.90%, respectively; F = 10.07, df = 29, p < .01) and Stimulus 2 (M’s = 92.59% vs. 88.90%, respectively; F = 16.67, df = 29, p < .001). Lastly, relatively few dipoles were localized at the edge of the search window. Across the x, y, and z coordinates, 91.35 % of Stimulus 1 and 88.46 % of Stimulus 2 dipoles did not reach the search radius edge for healthy individuals. Similarly, 95.31 % of Stimulus 1 and 85.16 % of Stimulus 2 dipoles fell below the search radius limit for patients with schizophrenia.
Evaluation of Dipole Moments
Comparison of Stimulus 1 and Stimulus 2 dipole moments across the STG, hippocampus, thalamus, and DLPFC revealed a significant main effect for neural structure (F = 42.50, df = 3, 84, p < .001, ε = .43), with the hippocampus and thalamus showing the greatest source strength across both groups (see Figure 3). Consistent with the inverse-square law, this pattern of findings is to be expected as deep structures require large current flows to be detected at distant scalp sites. There were no significant interaction effects involving group, neural structure or stimulus.
Figure 3.
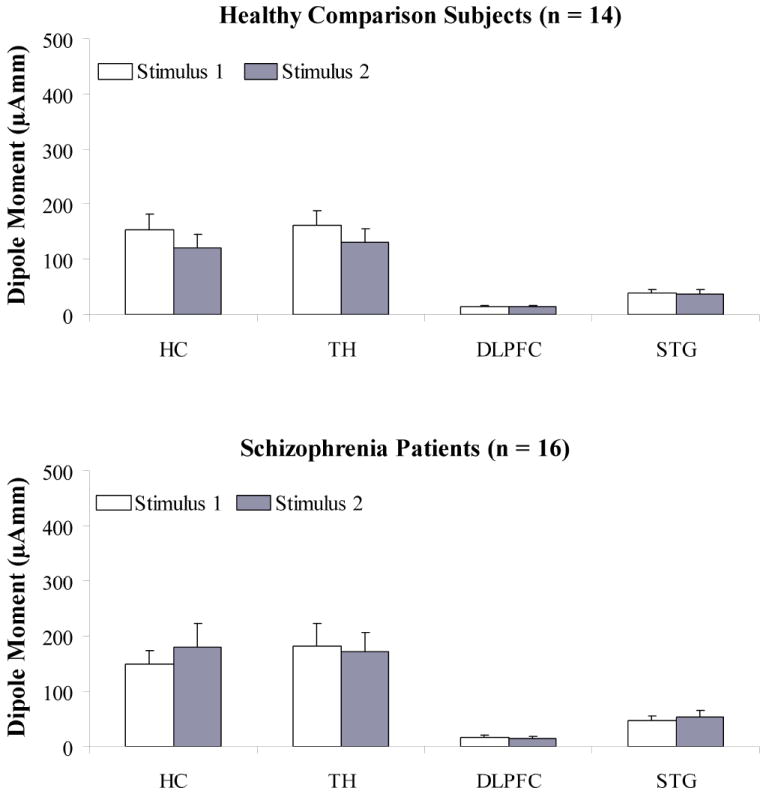
Mean dipole moments to paired stimuli for the hippocampus, thalamus, dorsolateral prefrontal cortex, and superior temporal gyrus for healthy comparison subjects and schizophrenia patients.
Note: μAmm, micro Ampere per millimeter; HC, Hippocampus; TH, Thalamus; DLPFC, Dorsolateral prefrontal cortex; STG, Superior temporal gyrus
Examination of the relationship between the ratio of the dipole moment of each neural structure and P50 suppression for healthy comparison subjects revealed that the hippocampal dipole moment ratio significantly correlated with the P50 suppression ratio (r = .69, p < .01; see Figure 4, top panel). Although not statistically significant, there also was some suggestion of an association between the DLPFC dipole moment ratio and the P50 suppression ratio (r = .46, p = .10). STG and thalamic dipole moment ratios were not significantly correlated with the P50 suppression ratio (r = .41, p = .15; r = .23, p = .44, respectively).
Figure 4.
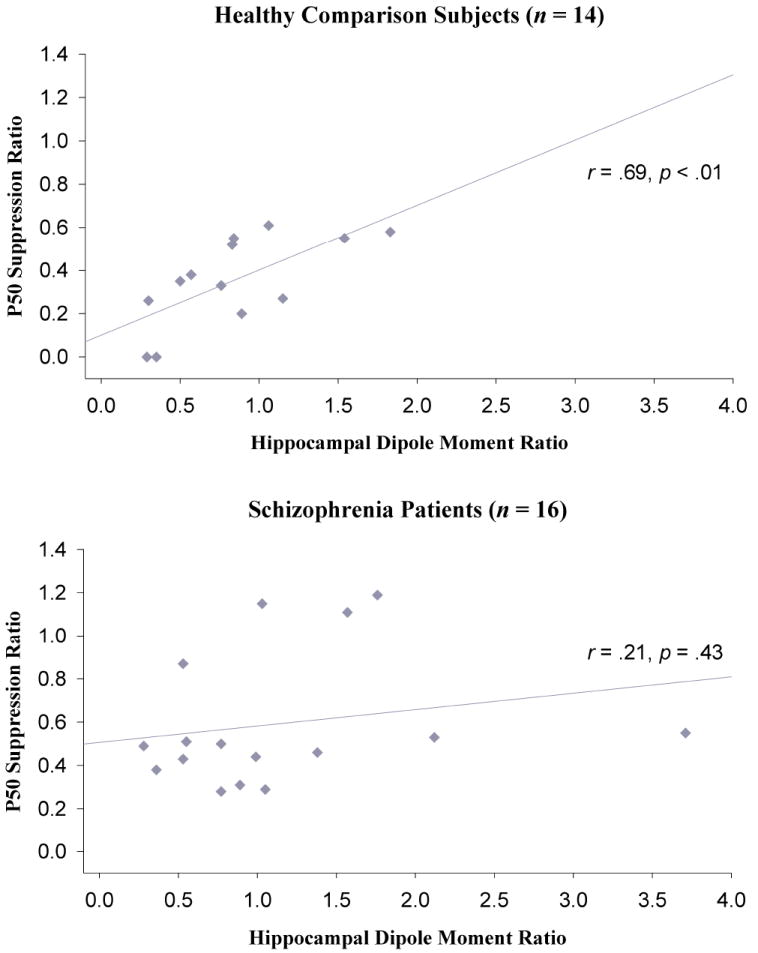
Associations between the P50 suppression ratio and the hippocampal dipole moment ratio for healthy comparison subjects and schizophrenia patients.
A somewhat different pattern of associations emerged for schizophrenia patients. In contrast to healthy subjects, patients did not exhibit a significant correlation between the hippocampal dipole moment ratio and the P50 suppression ratio (r = .21, p = .43; see Figure 4, bottom panel). A significant association was observed between the DLPFC dipole moment ratio and the P50 suppression ratio (r = .61, p < .05). Similar to healthy individuals, correlations between the P50 ratio and the STG or the thalamic dipole moment ratios were not statistically significant (r = .06, p = .82; r = .00, p = .99, respectively).
Planned comparisons were conducted to examine whether the groups differed statistically in the strength of the relationships between the dipole moment ratio for each neural source and the P50 ratio score. For the association between the hippocampal dipole moment ratio and the P50 suppression ratio, the group difference fell just short of conventional levels of statistical significance (p = .06, one-tailed). There were no significant group differences in the strength of relationships between DLPFC, STG or thalamus and the P50 ratio (all p’s > .18, one-tailed). Among healthy subjects, the strength of the associations also did not differ reliably between the four neural structures (p’s > .15 one-tailed), with the possible exception of a marginally significant effect involving the hippocampus and thalamus (p=.08, one-tailed). For patients with schizophrenia, the P50 ratio score correlated more strongly with the DLPFC dipole moment ratio than with the STG or thalamic dipole moment ratios (all p’s < .05).
In order to assess whether hippocampal and DLPFC dipole moment ratios accounted for unique variance in the P50 ratio score, hierarchical linear regression analyses were performed separately for the two groups. In each of the regression analyses, STG and thalamic dipole moment ratios were entered in the first step because both neural structures are implicated in basic auditory processing. As a second step, the hippocampal or DLPFC dipole moment ratio was entered. For healthy subjects, the regression model including the STG, thalamus, and hippocampus accounted for significantly more variance than the model including only STG and thalamus (F change (1, 10) = 7.90, p < .05). When the DLPFC dipole moment ratio was entered during the second step, a statistical trend was observed (F change (1, 10) = 3.94, p = .08). For schizophrenia patients, the regression model including the STG, thalamus, and hippocampus was not significant relative to the model involving only STG and thalamus (F change (1, 12) = 1.37, p = .26). However, the DLPFC dipole moment ratio accounted for unique variance when added to the STG and thalamic dipole moment ratios (F change (1, 12) = 7.29, p < .05).
Discussion
The present study used EEG source localization to evaluate the neural processes associated with a distributed neural network, involving the STG, hippocampus, DLPFC, and thalamus, which has been proposed to be involved in the generation of P50 and its suppression in healthy individuals and schizophrenia patients. Prior research has produced diverse findings regarding the neural generators associated with P50. The current results provide additional evidence to support an integrated perspective, consistent with results from non-traditional P50 paradigms that were developed for use with fMRI (Tregellas et al., 2007, 2009; Mayer et al., 2009). Diverging from results obtained from fMRI, however, the present data suggest that schizophrenia patients and healthy comparison subjects differ in the relative contributions made by different neuronal sources in the suppression of the P50.
Because the correlation coefficients between dipole moment ratios and the P50 gating ratio did not differ significantly across all four neural structures in healthy individuals, it appears likely that the STG, hippocampus, DLPFC, and thalamus all contributed to the generation of P50 and its suppression. Nonetheless, it was noteworthy that the hippocampal dipole moment ratio may have been more strongly associated with P50 suppression in healthy subjects. These results corroborate previous research implicating the CA3 region of the hippocampus in P50 suppression (Bickford-Wimer et al., 1990; Cullum et al. 1993; Luntz-Leybman et al., 1992). Specifically, Adler and colleagues (1998) describe a neurophysiological pathway for P50 suppression with the hippocampus as the central site of neural activation. In response to Stimulus 1, projections to the CA3 region appear to stimulate inhibitory interneurons through the opening of alpha7-nicotinic receptors. Release of GABA from the interneurons then facilitates inhibition of postsynaptic pyramidal cells, particularly due to long-lasting inhibition via GABAB receptors on postsynaptic cells. Thus, when excitation as a result of Stimulus 2 arrives in the CA3 region, it is automatically suppressed through the lasting inhibition produced by Stimulus 1.
A different pattern of relationships between P50 suppression and dipole moments emerged for schizophrenia patients. For this group, the hippocampal dipole moment ratio was not found to be significantly associated with P50 suppression. A statistical trend for a group difference in correlation coefficients further suggests that hippocampal functioning may have had a smaller impact on P50 suppression in schizophrenia patients relative to healthy subjects. However, the DLPFC dipole moment ratio was significantly associated with the P50 ratio in patients. Although not statistically significant, a moderate correlation between the DLPFC dipole moments and the P50 suppression ratio also was observed in healthy participants. The absence of group differences in correlation coefficients further indicates that both groups likely relied to some extent on DLPFC for P50 suppression. Consistent with such an interpretation, frontal areas have been implicated in P50 suppression in several studies involving non-psychiatric subjects (Boutros et al., 2008; Knight et al., 1989; Korzyukov et al., 2007; Weisser et al., 2001).
While still speculative, a possible interpretation of these findings is that the DLPFC may be particularly critical for P50 suppression in schizophrenia patients. Such an association is further suggested by the finding of a significantly stronger relationship between the DLPFC dipole moment ratio and the P50 ratio score as compared to associations involving STG or the thalamus. However, given poorer P50 suppression in schizophrenia, this pattern may also reflect the DLPFC’s general inefficiency in suppressing the P50. Such possibilities are consistent with the ability of schizophrenia patients to transiently normalize deficits in P50 suppression when directing voluntary attention to Stimulus 1 and presumably further engaging prefrontal activity (Yee et al., 2010).
These inferences do need to be considered in light of sample sizes that may have been insufficient for detecting significant correlations between STG or thalamic dipole moment ratios and the P50 suppression ratio. The absence of significant differences in correlation coefficients between dipole moment ratios and the P50 suppression ratio across neural structures in healthy subjects, for example, suggests that the STG and thalamus may also be contributing to the P50 suppression effect. With greater statistical power, it should then be possible to determine the degree to which healthy subjects and patients with schizophrenia are relying upon the same or different brain regions during P50 gating.
The absence of an association between the ratio computed from hippocampal dipole moments and the P50 suppression ratio in the patient group is consistent with hippocampal dysfunction in schizophrenia. Hippocampal volume reductions have been documented in schizophrenia patients across numerous studies (Narr et al., 2004; Szeszko et al., 2003; Velakoulis et al., 1999; Thoma et al., 2008). Moreover, research suggests that the hippocampus provides important inputs to the DLPFC and vice versa (Goldman-Rakic, Selemon, & Schwartz, 1984), with schizophrenia patients exhibiting abnormalities in the neural connections between these two structures (Friston, 1998). While highly speculative, the present results may reflect a similar pattern of dysfunctional connectivity between two structures that appear to contribute to P50 suppression.
To assess the possibility that the proposed dipole solution was merely the result of an overdetermined model, a comparison was conducted with a model consisting of theoretically-unrelated dipoles. If the Gof represents solely non-meaningful variance, one would expect to observe comparable Gof values between the two models. Our results indicated significant differences between the models and validated the proposed model as reflecting the neural network underlying P50 suppression. Moreover, systematic evaluation of the amount of variance explained by the four brain regions under consideration indicated they fitted the data better, individually and collectively, than theoretically-unrelated sources.
Another consideration is the prevailing view that EEG is unlikely to detect signals from deeper brain structures, including the hippocampus and thalamus. However, there is now substantial research to dispute this perspective. Relying on MEG source analysis, multiple empirical studies have provided evidence for its capacity to detect hippocampal activity (Breier, Simos, Zouridakis, & Papanicolaou, 1999; Gordon, Rennie, & Collins, 1990; Hanlon et al., 2003, 2005; Horiguchi, Ohta, & Nishikawa, 2003; Ioannides et al., 1995; Kikuchi et al., 1997; Kimora, Ozaki, Hashimoto, 2008; Luo, Holroyd, Jones, Hendler, & Blair, 2007; Maestu et al., 2003; Miller, 2008; Moses et al., 2009; Nishitani, 2003; Nishitani et al., 1999; Nishitani, Nagamine, Fujiwara, Yazawa, & Shibasaki, 1998; Okada, Kaufman, & Williamson, 1983; Rogers, Basile, Papanicolaou, & Eisenberg, 1993; Simos, Basile, & Papanicolaou, 1997; Tesche, 1996, 1997; Tesche & Karhu, 1999; Tesche & Karhu, 2000; Tesche, Karhu, & Tissari, 1996). To date, however, MEG studies of sensory gating in schizophrenia have not focused on the hippocampus (Huang et al., 2003; Thoma et al., 2003). Utilizing EEG, the present study relied upon a 124-channel recording montage that provided coverage of most of the scalp, including electrodes positioned a few centimeters below the temporal lobe area, and should facilitate detection of activity from deeper brain sources. Taken together, there is a basis for inferring that neural activity ascribed to the hippocampus and thalamus can be detected with densely-arrayed EEG sensors.
Beyond sample size, other methodological limitations need to be considered. Dipoles were seeded and, consequently, created a confirmatory bias. Without a theoretical or empirical basis for seeding additional anatomically-constrained dipoles, it is possible that other key neural regions were overlooked. It also is the case that associations detected between P50 ratio scores and dipole sources were correlational and should be interpreted with some caution. Because the present study sought to confirm prior source analyses, filter settings were implemented that have been the standard for P50 research. Recent studies, however, support the utility of examining a broader range of EEG frequencies (Hong et al, 2008; Jansen, Hedge, & Boutros, 2004) and they would be complemented by source analysis. A statistically significant group-by-stimulus interaction effect on P50 amplitude also was not detected. Despite the absence of this interaction, the presence of a significant group difference in the P50 ratio measure suggests a suppression deficit in the schizophrenia patients. It is possible that our ability to distinguish statistically between the patient and control samples with the amplitude measure was constrained by the beneficial effects of some second-generation antipsychotic medications on P50 gating (Adler et al., 2004; Light, Geyer, Clementz, Cadenhead, & Braff, 2000; Yee et al., 1998). Additionally, the average duration of illness in the present sample was less than 5 years and there is evidence indicating that the P50 deficit may be less pronounced during the early course of schizophrenia (de Wilde, Bour, Dingemans, Koelman, & Linszen, 2007b; Yee et al., 2010).
In sum, current results suggest that a dynamic interplay exists between brain regions involved in P50 gating, with treatment implications for targeting the DLPFC and attention (Yee et al., 2010) to compensate for inhibitory deficits in schizophrenia. More broadly, our findings support a neural connectivity approach to understanding the regulation of sensory gating in future investigations of schizophrenia.
Acknowledgments
This study was supported in part by grants MH57322, MH37705, and Center grant P50 MH066286 from the National Institute of Mental Health, Bethesda, MD. We thank Marilyn Kesler/West, Ph.D. for assistance with study procedures.
References
- Adler LE, Olincy A, Cawthra EM, McRae KA, Harris JG, Nagamoto HT, Waldo MC, Hall MH, Woodward L, Ross RG, Freedman R. Varied effects of atypical neuroleptics on P50 auditory gating in schizophrenia patients. American Journal of Psychiatry. 2004;161:1822–8. doi: 10.1176/ajp.161.10.1822. [DOI] [PubMed] [Google Scholar]
- Adler LE, Olincy A, Waldo M, Harris JG, Griffith J, Stevens K, Flach K, et al. Schizophrenia, sensory gating, and nicotinic receptors. Schizophrenia Bulletin. 1998;24:189–202. doi: 10.1093/oxfordjournals.schbul.a033320. [DOI] [PubMed] [Google Scholar]
- Adler LE, Pachtman E, Franks RD, Pecevich M, Waldo MC, Freedman R. Neurophysiological evidence for a defect in neuronal mechanisms involved in sensory gating in schizophrenia. Biological Psychiatry. 1982;17:639–54. [PubMed] [Google Scholar]
- Bickford-Wimer PC, Nagamoto H, Johnson R, Adler LE, Egan M, Rose GM, Freedman R. Auditory sensory gating in hippocampal neurons: a model system in the rat. Biological Psychiatry. 1990;27:183–92. doi: 10.1016/0006-3223(90)90648-l. [DOI] [PubMed] [Google Scholar]
- Boutros NN, Mears R, Pflieger ME, Moxon KA, Ludowig E, Rosburg T. Sensory gating in the human hippocampal and rhinal regions: regional differences. Hippocampus. 2008;18:310–6. doi: 10.1002/hipo.20388. [DOI] [PubMed] [Google Scholar]
- Bramon E, Rabe-Hesketh S, Sham P, Murray RM, Frangou S. Meta-analysis of the P300 and P50 waveforms in schizophrenia. Schizophrenia Research. 2004;70:315–29. doi: 10.1016/j.schres.2004.01.004. [DOI] [PubMed] [Google Scholar]
- Breier JI, Simos PG, Zouridakis G, Papanicolaou AC. Lateralization of cerebral activation in auditory verbal and non-verbal memory tasks using magetoencephalography. Brain Topography. 1999;12:89–97. doi: 10.1023/a:1023458110869. [DOI] [PubMed] [Google Scholar]
- Court J, Spurden D, Lloyd S, McKeith I, Ballard C, Cairns N, Kerwin R. Neuronal nicotinic receptors in dementia with Lewy bodies and schizophrenia: alpha-bungarotoxin and nicotine binding in the thalamus. Journal of Neurochemistry. 1999;73:1590–7. doi: 10.1046/j.1471-4159.1999.0731590.x. [DOI] [PubMed] [Google Scholar]
- Cullum CM, Harris JG, Waldo MC, Smernoff E, Madison A, Nagamoto HT, Griffith J, et al. Neurophysiological and neuropsychological evidence for attentional dysfunction in schizophrenia. Schizophrenia Research. 1993;10:131–41. doi: 10.1016/0920-9964(93)90048-n. [DOI] [PubMed] [Google Scholar]
- De Wilde OM, Bour LJ, Dingemans PM, Koelman JH, Linszen DH. A meta-analysis of P50 studies in patients with schizophrenia and relatives: differences in methodology between research groups. Schizophrenia Research. 2007a;97:137–51. doi: 10.1016/j.schres.2007.04.028. [DOI] [PubMed] [Google Scholar]
- De Wilde OM, Bour LJ, Dingemans PM, Koelman JH, Linszen DH. Failure to find P50 suppression deficits in young first-episode patients with schizophrenia and clinically unaffected siblings. Schizophrenia Bulletin. 2007b;33:1319–23. doi: 10.1093/schbul/sbm001. [DOI] [PMC free article] [PubMed] [Google Scholar]
- Erwin RJ, Buchwald JS. Midlatency auditory evoked responses in the human and the cat model. Electroencephalogry and Clinical Neurophysiology Supplement. 1987;40:461–7. [PubMed] [Google Scholar]
- Freedman R, Adams CE, Leonard S. The alpha7-nicotinic acetylcholine receptor and the pathology of hippocampal interneurons in schizophrenia. Journal of Chemical Neuroanatomy. 2000;20:299–306. doi: 10.1016/s0891-0618(00)00109-5. [DOI] [PubMed] [Google Scholar]
- Freedman R, Adler LE, Gerhardt GA, Waldo M, Baker N, Rose GM, Drebing C, et al. Neurobiological studies of sensory gating in schizophrenia. Schizophrenia Bulletin. 1987;13:669–78. doi: 10.1093/schbul/13.4.669. [DOI] [PubMed] [Google Scholar]
- Freedman R, Adler LE, Myles-Worsley M, Nagamoto HT, Miller C, Kisley M, McRae K, et al. Inhibitory gating of an evoked response to repeated auditory stimuli in schizophrenic and normal subjects. Archives of General Psychiatry. 1996;53:1114–1121. doi: 10.1001/archpsyc.1996.01830120052009. [DOI] [PubMed] [Google Scholar]
- Freedman R, Adler LE, Waldo MC, Pachtman E, Franks RD. Neurophysiological evidence for a defect in inhibitory pathways in schizophrenia: comparison of medicated and drug-free patients. Biological Psychiatry. 1983;18:537–551. [PubMed] [Google Scholar]
- Friston KJ. The disconnection hypothesis. Schizophrenia Research. 1998;30:115–25. doi: 10.1016/s0920-9964(97)00140-0. [DOI] [PubMed] [Google Scholar]
- Fuchs M, Kastner J, Wagner M, Hawes S, Ebersole JS. A standardized boundary element method volume conductor model. Clinical Neurophysiology. 2002;112:701–12. doi: 10.1016/s1388-2457(02)00030-5. [DOI] [PubMed] [Google Scholar]
- Geisser S, Greenhouse SW. An extension of Box’s results on the use of the F distribution in multivariate analysis. Annals of Mathematics and Statistics. 1958;29:886–891. [Google Scholar]
- Godey B, Schwartz D, de Graaf JB, Chauvel P, Liegeois-Chauvel C. Neuromagnetic source localization of auditory evoked fields and intracerebral evoked potentials: a comparison of data in the same patients. Clinical Neurophysiology. 2001;112:1850–1859. doi: 10.1016/s1388-2457(01)00636-8. [DOI] [PubMed] [Google Scholar]
- Goff WR, Williamson PD, VanGilder JC, Allison T, Fisher TC. Neural origins of long latency evoked potentials recorded from the cortical surface of the brain in man. In: Desmedt JE, editor. Clinical Uses of Cerebral, Brain Stem and Spinal Somatosensory Evoked Potentials. New York: S Krager; 1980. pp. 126–145. [Google Scholar]
- Goldman-Rakic PS, Selemon LD, Schwartz ML. Dual pathways connecting the dorsolateral prefrontal cortex with the hippocampal formation and parahippocampal cortex in the rhesus monkey. Neuroscience. 1984;12:719–43. doi: 10.1016/0306-4522(84)90166-0. [DOI] [PubMed] [Google Scholar]
- Gordon E, Rennie C, Collins L. Magnetoencephalography and late component ERPs. Clinical and Experimental Neurology. 1990;27:113–20. [PubMed] [Google Scholar]
- Hanlon FM, Weisend MP, Huang M, Lee RR, Moses SN, Paulson KM, Thoma RJ, et al. A non-invasive method for observing hippocampal function. Neuroreport. 2003;14:1957–60. doi: 10.1097/00001756-200310270-00015. [DOI] [PubMed] [Google Scholar]
- Hanlon FM, Weisend MP, Yeo RA, Huang M, Lee RR, Thoma RJ, Moses SN, et al. A specific test of hippocampal deficit in schizophrenia. Behavioral Neuroscience. 2005;119:863–875. doi: 10.1037/0735-7044.119.4.863. [DOI] [PubMed] [Google Scholar]
- Heinrichs RW. In Search of Madness: Schizophrenia and Neuroscience. 2001. [Google Scholar]
- Hinman CL, Buchwald JS. Depth evoked potential and single unit correlates of vertex midlatency auditory evoked responses. Brain Research. 1983;264:57–67. doi: 10.1016/0006-8993(83)91120-4. [DOI] [PubMed] [Google Scholar]
- Hong LE, Summerfelt A, Mitchell BD, McMahon RP, Wonodi I, Buchanan RW, Thaker GK. Sensory gating endophenotype based on its neural oscillatory pattern and heritability estimate. Archives of General Psychiatry. 2008;65:1008–16. doi: 10.1001/archpsyc.65.9.1008. [DOI] [PMC free article] [PubMed] [Google Scholar]
- Horiguchi T, Ohta K, Nishikawa T. An MEG study of P300 activity during a color discrimination task 2: source localization study. Brain Development. 2003;25:241–4. doi: 10.1016/s0387-7604(02)00218-8. [DOI] [PubMed] [Google Scholar]
- Huang MX, Edgar JC, Thoma RJ, Hanlon FM, Moses SN, Lee RR, Paulson KM, et al. Predicting EEG responses using MEG sources in superior temporal gyrus reveals source asynchrony in patients with schizophrenia. Clinical Neurophysiology. 2003;114:835–50. doi: 10.1016/s1388-2457(03)00041-5. [DOI] [PubMed] [Google Scholar]
- Huotilainen M, Winkler I, Alho K, Escera C, Virtanen J, Ilmoniemi RJ, Jaaskelainen IP, et al. Combined mapping of human auditory EEG and MEG responses. Electroencephalography and Clinical Neurophysiology. 1998;108:370–379. doi: 10.1016/s0168-5597(98)00017-3. [DOI] [PubMed] [Google Scholar]
- Ioannides AA, Liu MJ, Liu LC, Bamidis PD, Hellstrand E, Stephan KM. Magnetic field tomography of cortical and deep processes: examples of “real-time mapping” of averaged and single trial MEG signals. International Journal of Psychophysiology. 1995;20:161–75. doi: 10.1016/0167-8760(95)00031-3. [DOI] [PubMed] [Google Scholar]
- Jansen BH, Hedge A, Boutros NN. Contribution of different EEG frequencies to auditory evoked potential abnormalities in schizophrenia. Clinical Neurophysiology. 2004;115:523–33. doi: 10.1016/j.clinph.2003.10.016. [DOI] [PubMed] [Google Scholar]
- Jung TP, Makeig S, Westerfield M, Townsend J, Courchesne E, Sejnowski TJ. Analysis and visualization of single-trial event-related potentials. Human Brain Mapping. 2001;14:166–85. doi: 10.1002/hbm.1050. [DOI] [PMC free article] [PubMed] [Google Scholar]
- Kanno A, Nakasato N, Murayama N, Yoshimoto T. Middle and long latency peak sources in auditory evoked magnetic fields for tone bursts in humans. Neuroscience Letters. 2000;293:187–190. doi: 10.1016/s0304-3940(00)01525-1. [DOI] [PubMed] [Google Scholar]
- Kikuchi Y, Endo H, Yoshizawa S, Kait M, Nishimura C, Tanaka M, Kumagai T, Takeda T. Human cortico-hippocampal activity related to auditory discrimination revealed by neuromagnetic field. Neuroreport. 1997;8:1657–61. doi: 10.1097/00001756-199705060-00020. [DOI] [PubMed] [Google Scholar]
- Kimora T, Ozaki I, Hashimoto I. Impulse propagation along thalamocortical fibers can be detected magnetically outside the human brain. Journal of Neuroscience. 2008;28:12535–8. doi: 10.1523/JNEUROSCI.3022-08.2008. [DOI] [PMC free article] [PubMed] [Google Scholar]
- Knight RT, Scabini D, Woods DL. Prefrontal cortex gating of auditory transmission in humans. Brain Research. 1989;504:338–42. doi: 10.1016/0006-8993(89)91381-4. [DOI] [PubMed] [Google Scholar]
- Korzyukov O, Pflieger M, Wagner M, Bowyer S, Rosburg T, Sundaresan K, Elger C. Generators of the intracranial P50 response in auditory sensory gating. Neuroimage. 2007;35:814–26. doi: 10.1016/j.neuroimage.2006.12.011. [DOI] [PMC free article] [PubMed] [Google Scholar]
- Lee TW, Girolami M, Sejnowski TJ. Independent component analysis using an extended infomax algorithm for mixed subgaussian and supergaussian sources. Neural Computation. 1999;11:417–41. doi: 10.1162/089976699300016719. [DOI] [PubMed] [Google Scholar]
- Light GA, Geyer MA, Clementz BA, Cadenhead KS, Braff DL. Normal P50 suppression in schizophrenia patients treated with atypical antipsychotic medications. American Journal of Psychiatry. 2000;157:767–71. doi: 10.1176/appi.ajp.157.5.767. [DOI] [PubMed] [Google Scholar]
- Luntz-Leybman V, Bickford PC, Freedman R. Cholinergic gating of response to auditory stimuli in rat hippocampus. Brain Research. 1992;587:130–6. doi: 10.1016/0006-8993(92)91437-j. [DOI] [PubMed] [Google Scholar]
- Luo Q, Holroyd T, Jones M, Hendler T, Blair J. Neural dynamics for facial threat processing as revealed by gamma band synchronization using MEG. Neuroimage. 2007;34:839–47. doi: 10.1016/j.neuroimage.2006.09.023. [DOI] [PMC free article] [PubMed] [Google Scholar]
- Maestu F, Arrazola J, Fernandez A, Simos PG, Amo C, Gil-Gregorio P, Fernandez S, Papanicolaou A, Ortiz T. Do cognitive patterns of brain magnetic activity correlate with hippocampal atrophy in Alzheimer’s disease? Journal of Neurological and Neurosurgical Psychiatry. 2003;74:208–12. doi: 10.1136/jnnp.74.2.208. [DOI] [PMC free article] [PubMed] [Google Scholar]
- Makela JP, Hamalainen M, Hari R, McEvoy L. Whole-head mapping of middlelatency auditory evoked magnetic fields. Electroencephalography and Clinical Neurophysiology. 1994;92:414–421. doi: 10.1016/0168-5597(94)90018-3. [DOI] [PubMed] [Google Scholar]
- Mayer AR, Hanlon FM, Franco AR, Teshiba TM, Thoma RJ, Clark VP, Canive JM. The neural networks underlying sensory gating. Neuroimage. 2009;44:182–9. doi: 10.1016/j.neuroimage.2008.08.025. [DOI] [PMC free article] [PubMed] [Google Scholar]
- Miller GA. Localization for hippocampal abnormality: Hunting deep structures with MEG. Presentation at 4-D Neuroimaging 3rd Annual International Users Group Meeting; Barcelona. 2008. [Google Scholar]
- Moses SN, Ryan JD, Bardouille T, Kovacevic N, Hanlon FM, McIntosh AR. Semantic information alters neural activation during transverse patterning performance. Neuroimage. 2009;46:863–873. doi: 10.1016/j.neuroimage.2009.02.042. [DOI] [PMC free article] [PubMed] [Google Scholar]
- Narr KL, Thompson PM, Szeszko P, Robinson D, Jang S, Woods RP, Kim S, et al. Regional specificity of hippocampal volume reductions in first-episode schizophrenia. Neuroimage. 2004;21:1563–75. doi: 10.1016/j.neuroimage.2003.11.011. [DOI] [PubMed] [Google Scholar]
- Nishitani N. Dynamics of cognitive processing in the human hippocampus by neuromagnetic and neurochemical assessments. Neuroimage. 2003;20:561–71. doi: 10.1016/s1053-8119(03)00280-5. [DOI] [PubMed] [Google Scholar]
- Nishitani N, Ikeda A, Nagamine T, Honda M, Mikuni N, Taki W, Kimura J, et al. The role of the hippocampus in auditory processing studied by event-related electric potentials and magnetic fields in epilepsy patients before and after temporal lobectomy. Brain. 1999;122:687–707. doi: 10.1093/brain/122.4.687. [DOI] [PubMed] [Google Scholar]
- Nishitani N, Nagamine T, Fujiwara N, Yazawa S, Shibasaki H. Cortical-hippocampal auditory processing identified by magnetoencephalography. Journal of Cognitive Neuroscience. 1998;10:231–47. doi: 10.1162/089892998562672. [DOI] [PubMed] [Google Scholar]
- Nuechterlein KH, Dawson ME, Gitlin MJ, Ventura J, Goldstein MJ, Snyder KS, Yee CM, et al. Developmental processes in schizophrenic disorders: Longitudinal studies of vulnerability and stress. Schizophrenia Bulletin. 1992;18:387–425. doi: 10.1093/schbul/18.3.387. [DOI] [PubMed] [Google Scholar]
- Okada YC, Kaufman L, Williamson SJ. The hippocampal formation as a source of the slow endogenous potentials. Electroencephalography and Clinical Neurophysiology. 1983;55:417–426. doi: 10.1016/0013-4694(83)90130-x. [DOI] [PubMed] [Google Scholar]
- Onitsuka T, Ninomiya H, Sato E, Yamamoto T, Tashiro N. Differential characteristics of the middle latency auditory evoked magnetic responses to interstimulus intervals. Clinical Neurophysiology. 2003;114:1513–1520. doi: 10.1016/s1388-2457(03)00110-x. [DOI] [PubMed] [Google Scholar]
- Patterson JV, Hetrick WP, Boutros NN, Jin Y, Sandman C, Stern H, Potkin S, et al. P50 sensory gating ratios in schizophrenics and controls: a review and data analysis. Psychiatry Research. 2008;158:226–247. doi: 10.1016/j.psychres.2007.02.009. [DOI] [PubMed] [Google Scholar]
- Reite M, Teale P, Zimmerman J, Davis K, Whalen J. Source location of a 50 msec latency auditory evoked field component. Electroencephalography and Clinical Neurophysiology. 1988a;70:490–498. doi: 10.1016/0013-4694(88)90147-2. [DOI] [PubMed] [Google Scholar]
- Reite M, Teale P, Zimmerman J, Davis K, Whalen J, Edrich J. Source origin of a 50-msec latency auditory evoked field component in young schizophrenic men. Biological Psychiatry. 1988b;24:495–506. doi: 10.1016/0006-3223(88)90160-6. [DOI] [PubMed] [Google Scholar]
- Rogers RL, Basile LF, Papanicolaou AC, Eisenberg HM. Magnetoencephalography reveals two distinct sources associated with late positive evoked potentials during visual oddball task. Cerebral Cortex. 1993;3:163–9. doi: 10.1093/cercor/3.2.163. [DOI] [PubMed] [Google Scholar]
- Rosburg T, Trautner P, Ludowig E, Helmstaedter C, Bien CG, Elger CE, Boutros NN. Sensory gating in epilepsy – effects of the lateralization of hippocampal sclerosis. Clinical Neurophysiology. 2008;119:1310–9. doi: 10.1016/j.clinph.2008.02.007. [DOI] [PubMed] [Google Scholar]
- Scheibel AB. The thalamus and neuropsychiatric illness. The Journal of Neuropsychiatry and Clinical Neurosciences. 1997;9:342–53. doi: 10.1176/jnp.9.3.342. [DOI] [PubMed] [Google Scholar]
- Simos PG, Basile LF, Papanicolaou AC. Source localization of the N400 response in a sentence-reading paradigm using evoked magnetic fields and magnetic resonance imaging. Brain Research. 1997;762:29–39. doi: 10.1016/s0006-8993(97)00349-1. [DOI] [PubMed] [Google Scholar]
- Szeszko PR, Goldberg E, Gunduz-Bruce H, Ashtari M, Robinson D, Malhotra AK, Lencz T. Smaller anterior hippocampal formation volume in antipsychotic-naive patients with first-episode schizophrenia. American Journal of Psychiatry. 2003;160:2190–7. doi: 10.1176/appi.ajp.160.12.2190. [DOI] [PubMed] [Google Scholar]
- Tesche CD. MEG imaging of neuronal population dynamics in the human thalamus. Electroencephalography and Clinical Neurophysiology Supplement. 1996;47:81–90. [PubMed] [Google Scholar]
- Tesche CD. Non-invasive detection of ongoing neuronal population activity in the normal human hippocampus. Brain Research. 1997;749:53–60. doi: 10.1016/s0006-8993(96)01286-3. [DOI] [PubMed] [Google Scholar]
- Tesche CD, Karhu J. Interactive processing of sensory input and motor output in the human hippocampus. Journal of Cognitive Neuroscience. 1999;11:424–36. doi: 10.1162/089892999563517. [DOI] [PubMed] [Google Scholar]
- Tesche CD, Karhu J. Theta oscillations index human hippocampal activation during a working memory task. Proceedings of the National Academy of Sciences USA. 2000;97:919–24. doi: 10.1073/pnas.97.2.919. [DOI] [PMC free article] [PubMed] [Google Scholar]
- Tesche CD, Karhu J, Tissari SO. Non-invasive detection of neuronal population activity in human hippocampus. Brain Research Cognitive Brain Research. 1996;4:39–47. doi: 10.1016/0926-6410(95)00044-5. [DOI] [PubMed] [Google Scholar]
- Thoma RJ, Hanlon FM, Moses SN, Edgar JC, Huang M, Weisend MP, Irwin J, et al. Lateralization of auditory sensory gating and neuropsychological dysfunction in schizophrenia. American Journal of Psychiatry. 2003;160:1595–605. doi: 10.1176/appi.ajp.160.9.1595. [DOI] [PubMed] [Google Scholar]
- Thoma RJ, Hanlon FM, Petropoulos H, Miller GA, Moses SN, Smith A, Parks L, et al. Schizophrenia diagnosis and anterior hippocampal volume make separate contributions to sensory gating. Psychophysiology. 2008;45:926–35. doi: 10.1111/j.1469-8986.2008.00692.x. [DOI] [PMC free article] [PubMed] [Google Scholar]
- Tregellas JR, Davalos DB, Rojas DC, Waldo MC, Gibson L, Wylie K, Du YP, et al. Increased hemodynamic response in the hippocampus, thalamus and prefrontal cortex during abnormal sensory gating in schizophrenia. Schizophrenia Research. 2007;92:262–72. doi: 10.1016/j.schres.2006.12.033. [DOI] [PMC free article] [PubMed] [Google Scholar]
- Tregellas JR, Ellis J, Shatti S, Du YP, Rojas DC. American Journal of Psychiatry. Vol. 166. 2009. Increased hippocampal, thalamic, and prefrontal hemodynamic response to an urban noise stimulus in schizophrenia; pp. 354–60. [DOI] [PMC free article] [PubMed] [Google Scholar]
- Turetsky BL, Calkins ME, Light GA, Olincy A, Radant AD, Swerdlow NR. Neurophysiological endophenotypes of schizophrenia: the viability of selected candidate measures. Schizophrenia Bulletin. 2007;33:69–94. doi: 10.1093/schbul/sbl060. [DOI] [PMC free article] [PubMed] [Google Scholar]
- Velakoulis D, Pantelis C, McGorry PD, Dudgeon P, Brewer W, Cook M, Desmond P. Hippocampal volume in first-episode psychoses and chronic schizophrenia: A high-resolution magnetic resonance imaging study. Archives of General Psychiatry. 1999;56:133–41. doi: 10.1001/archpsyc.56.2.133. [DOI] [PubMed] [Google Scholar]
- Venables PH. Input dysfunction in schizophrenia. In: Maher BA, editor. Progress in Experimental Personality Research. Vol. 1. New York: Academic Press; 1964. pp. 1–47. [PubMed] [Google Scholar]
- Ventura J, Liberman R, Green M, Shaner A, Mintz J. Training and quality assurance with the Structured Clinical Interview for DSM-IV (SCID-I/P) Psychiatry Research. 1998;79:163–73. doi: 10.1016/s0165-1781(98)00038-9. [DOI] [PubMed] [Google Scholar]
- Ventura J, Lukoff D, Nuechterlein KH, Liberman RP, Green MF, Shaner A. Brief Psychiatric Rating Scale (BPRS), Expanded Version (4.0): Scales, anchor points, and administration manual. International Journal of Methods in Psychiatric Research. 1993;3:227–243. [Google Scholar]
- Weisser R, Weisbrod M, Roehrig M, Rupp A, Schroeder J, Scherg M. Is frontal lobe involved in the generation of auditory evoked P50? Neuroreport. 2001;12:3303–7. doi: 10.1097/00001756-200110290-00031. [DOI] [PubMed] [Google Scholar]
- Wilson CL, Babb TL, Halgreen E, Wang ML, Crandall PH. Habituation of human limbic neuronal response to sensory stimulation. Experimental Neurology. 1984;84:74–97. doi: 10.1016/0014-4886(84)90007-4. [DOI] [PubMed] [Google Scholar]
- Yee CM, Nuechterlein KH, Morris SE, White PM. P50 suppression in recent-onset schizophrenia: clinical correlates and risperidone effects. Journal of Abnormal Psychology. 1998;107:691–8. doi: 10.1037//0021-843x.107.4.691. [DOI] [PubMed] [Google Scholar]
- Yee CM, Williams TJ, White PM, Nuechterlein KH, Wirshing DA, Subotnik KL. Attentional modulation of the P50 suppression deficit in recent-onset and chronic schizophrenia. Journal of Abnormal Psychology. 2010;119:31–39. doi: 10.1037/a0018265. [DOI] [PMC free article] [PubMed] [Google Scholar]
- Yoshiura T, Ueno S, Iramina K, Masuda K. Source localization of middle latency auditory evoked magnetic fields. Brain Research. 1995;703:139–144. doi: 10.1016/0006-8993(95)01075-0. [DOI] [PubMed] [Google Scholar]