

Abstract
Two families manifesting Glut1 deficiency syndrome (Glut1 DS) as an autosomal recessive trait are described. In one family, a severely affected boy inherited a mutated allele from his asymptomatic heterozygous mother. A de novo mutation developed in the paternal allele producing compound heterozygosity. In another family, two mildly affected sisters inherited mutations from their asymptomatic heterozygous consanguineous parents. RBC glucose uptake residual activity, a surrogate of haploinsufficiency, correlated with the clinical severity. These cases demonstrate that Glut1 DS may present as an autosomal recessive trait. The clinical pattern of inheritance is determined by the relative pathogenicity of the mutation and the resulting degree of haploinsufficiency.
Background
Glut1 deficiency syndrome (Glut1 DS) results from impaired glucose transport into the brain. Facilitated glucose transport is mediated by Glut1, a transmembrane protein encoded by the GLUT1 gene.1 The hallmark of Glut1 DS is low cerebrospinal fluid (CSF) glucose.2 The classic presentation includes epilepsy, developmental delay, acquired microcephaly, spasticity and ataxia. The expanded phenotype includes paroxysmal movement disorders2, 3 and atypical Childhood Absence Epilepsy.4
Glut1 DS often presents as a sporadic disease, with de novo mutations producing haploinsufficiency and conferring symptomatic heterozygosity.5 An autosomal dominant pattern of inheritance has been the mendelian rule..6–8 In a haploinsufficient knockout mouse model for Glut1 DS, homozygosity confers embryonic lethality and heterozygous mice show phenotypic similarities to the human condition.9–10
We report two families in which the probands have two mutated alleles. The parents are clinically asymptomatic heterozygous carriers. The inheritance pattern is consistent with an autosomal recessive trait.
Methods
The Columbia Neurological Score (CNS)
The patients were assessed for phenotypic severity using the CNS, a semi-quantitative tool to summarize the clinical evaluation.11 The instrument rates physical and neurologic findings as normal or abnormal. The summary of these findings comprises the CNS ranging from 0 to76, with 76 being perfect.
Glut1 Protein and DNA investigations
Investigations included 3-O-methyl-D-glucose (3-OMG) uptake into freshly isolated red blood cells (RBCs), zero-trans influx studies of 3-OMG into Xenopus oocytes, and mutational analysis of the GLUT1 Gene. All studies were performed as described previously.12–14
SNP Oligonucleotide Microarray Analysis (SOMA) of copy number variations was performed using the Affymetrix Genome Wide Human SNP Array 6.0, the GeneChip® Instrument System hardware and Affymetrix Genotyping Console software (Affymetrix, Santa Clara, CA).
Family 1
The male proband was seen initially at age 3 years.13, 15. Recurrent limb stiffening associated with cyanosis began at age 6 weeks. Other seizures included tonic eye deviation, staring spells, myoclonic jerks, and prolonged and refractory generalized tonic clonic seizures.. He developed head control at 12 months, crawled at 24 months and sat independently by 36 months. Vocalization started at age 3.5 years. Head circumference was 50th percentile at 3 months and below the 3rd percentile by one year. CSF analysis demonstrated hypoglycorrhachia (Table 1). The ketogenic diet improved awareness and controlled seizures. When seen at age 6 years his developmental quotient was 42. He was microcephalic with mild dysmorphic features. He stood with assistance, took a few steps, had axial hypotonia and severe ataxia. He showed limb spasticity, increased tendon reflexes, Babinski signs and distal lower limb dystonia. The CNS score was 45, placing him in the severe phenotypic range (40–49). The mother, father, and 9 year old sister were all healthy.
Table 1.
Cerebrospinal fluid findings and 3-O-methyl-D-glucose RBC uptake studies.
| Family | Member | Blood Glucose (mg/dl) | CSF Glucose (mg/dl) | CSF/Blood ratio | CSF Lactate (mmol/l) | Uptake (%) | Vmax (%) | Km (%) |
|---|---|---|---|---|---|---|---|---|
| 1 | proband | 83 | 31 | 0.37 | - | 36 | 43 | 90 |
| 1 | father | - | - | - | - | 100 | - | - |
| 1 | mother | - | - | - | - | 87 | - | - |
| 2 | Older sister | 82 | 36 | 0.44 | 1.09 | 66 | 50 | 83 |
| 2 | Younger sister | 78 | 36 | 0.46 | 1.08 | 63 | - | - |
| 2 | mother | - | - | - | - | 84 | 75 | 92 |
| 2 | father | - | - | - | - | 83 | 75 | 83 |
RBC uptake values represent % of control value. An intra-assay control sample was used in the family 2 assay.
Family 2
The two probands are sisters ages 6 and 2.5 years when examined. The parents are healthy double first cousins.. The older sister walked at age 1 year. First words were uttered at age 2 years. She later talked in 2–3 word sentences. Parents recall occasional eye fluttering at age 6 months and head drops for a few months around. age 1 year. At age 18 months she developed episodes of intermittent ataxia lasting for a few hours. CSF analysis of both sisters demonstrated hypoglycorrhachia (Table 1). The ketogenic diet eliminated the episodes. When seen by us, she was normocephalic, had articulation difficulties and could not write her name. She manifested strabismus, poor eye pursuit, hypotonia, increased tone and tendon reflexes in her left leg, bilateral Babinski signs, .mild dysmetria, and clumsiness with a tendency to fall during tandem gait. Her CNS score was 62, falling in the mild phenotypic range (60–69).
The younger sister had normal motor performance and walked at 15 months.. She currently has only a few words and articulation difficulties. Parents recall one episode of eye fluttering at age 6 months. At 1 year she had startle myoclonus evident for a few months. The ketogenic diet improved her alertness and physical activity. When examined at age 2.5 years, she was microcephalic, hypotonic and hyperreflexic. Her CNS score was 71.5, falling in a minimal/normal phenotypic range (70–76).
Results
Family 1
The 3-OMG RBC uptake in mother was 87%. The father served as the family’s control (100%). The patient’s 3-OMG RBC uptake was 36% (Table 1). Analysis of the GLUT1 gene revealed a heterozygous 945A>G substitution in exon 6 causing a K256V missense mutation in the patient and his mother (Fig 1). The patient also had a second heterozygous 556G>T substitution in exon 4 causing an R126L missense mutation in the paternally derived allele, producing compound heterozygosity. The father’s gene sequencing showed no abnormality. Site-directed mutagenesis studies in xenopus oocytes demonstrated 3.2% 3-OMG uptake by the R126L mutant Glut1 protein and 12.7% uptake by the K256V mutant Glut1 protein.
Figure 1.
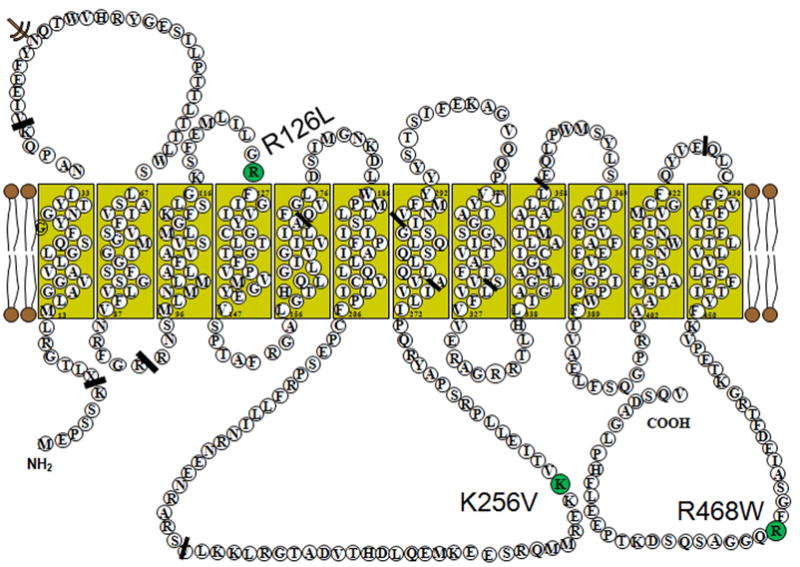
The proposed Glut1 protein transmembrane configuration with the locations of the R126L, K256V and R468W missense mutations.
Family 2
3-OMG RBC uptake studies in the older and younger sisters were 66% and 63%, and the mother’s and father’s uptake values were 84% and 83%, compared with an intra-assay control (Table 1). Both parents had a heterozygous 1402C>T substitution in exon 10 of the GLUT1 gene causing a R468W missense mutation (Fig 1). Both daughters were homozygous for the same mutation. Microarray analysis did not show any significant copy number changes across the family genome.
Discussion
There is a narrow margin of safety for glucose transport across the blood brain barrier to meet the needs of cerebral function.16, 17 Accumulating observations indicate that increasing haploinsufficiency is associated with worsening neurological performance. Glut1 protein expression in the range of 75–100% causes little or no clinical symptoms (Fig 2). Paroxysmal events such as seizures, exercise induced dyskinesias and intermittent ataxia correlate with mild protein expression reductions in the range of 65%, while 50 % reduction, as is seen classically in the autosomal dominant and sporadic Glut 1 DS cases, is associated with fixed brain signs of varying severity such as mental retardation, microcephaly, intractable epilepsy and dystonia.2 Little or no Glut1 expression is embryonic lethal as confirmed in the Glut1-DS mouse model.9 This haploinsufficiency spectrum, until now, has presented as an autosomal dominant pattern of inheritance. However, the pattern of inheritance and the degree of haploinsufficiency will be determined by the relative pathogenicity of the disease-causing mutation. The compound heterozygous proband in family 1 has a severe clinical phenotype. The maternally inherited K256V mutation causes a mild decrease in Glut1 protein expression (probably around 85%) and no clinical symptoms. Consistent with this speculation, the RBC uptake values of all three carrier parents are essentially identical. The Xenopus oocyte system is used to study structure-function relationships of the glucose transporter family and to assess the functional disturbances of specific GLUT1 gene mutations. 14 Here we studied the pathogenicity of the R126L and K256V missense mutations. The K256V mutant Glut1 protein retained significant residual catalytic activity (12.7 %). The R126L mutation had only 3.2 % residual activity. We have not encountered a patient with the heterozygous R126L missense mutation but we have encountered patients with other R126 mutations (R126C, R126H). The RBC uptake studies in patients carrying R126C and R126H mutations range from 54–72% of controls.6 Clinically, the observed R126 phenotype is a classic presentation with CNS scores ranging 47 to 71. These scores are higher than the 45 score in the family 1 proband. Also, the other patients were ambulatory and verbal in contrast to the proband.6 These comparisons suggest that the compound heterozygous state is more severe than the expected heterozygous R126L phenotype. The combination of the two mutant alleles probably causes a haploinsufficient state around 25% and a severe clinical phenotype. The RBC uptake of 36% is consistant with this prediction.
Figure 2.
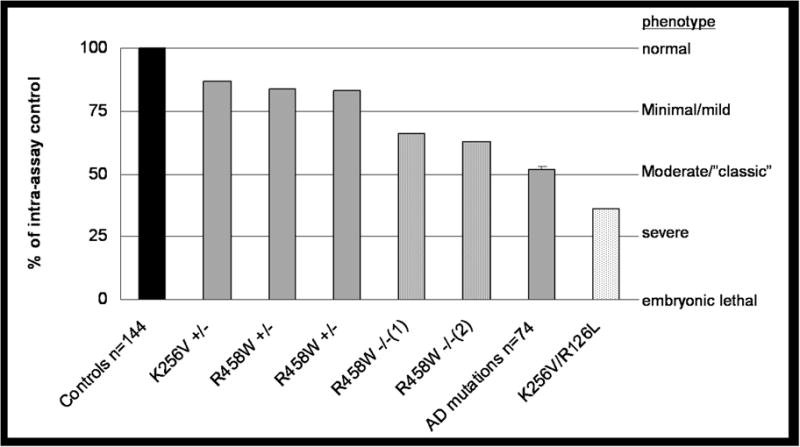
Relative 3-OMG RBC glucose uptake values in homozygous affected patients, heterozygous (AD) and compound heterozygous affected patients, heterozygous unaffected patients and healthy controls RBC 3-O-methyl-D-glucose uptake was performed as described elsewhere (12). The data are expressed as the percent of uptake compared with an intra-assay control sample. Activities of the described two family members are shown individually. The individual assays were performed in triplicate and the results were averaged. The average uptake for 74 patients with an autosomal dominant (AD) pattern of inheritance is 52% ± 8.94. A total of 144 normal subjects were used as controls in the individual patient assays that have been performed over the past decade. The intra-assay uptake values were normalized to the respective control sample. The residual RBC glucose uptake (left vertical axis) is a surrogate marker for the degree of haploinsufficiency.
The increasing severity of the clinical phenotypes correlating with the degree of presumed haploinsufficiency is listed on the right vertical axis.
In family 2, the R468W mutation apparently causes only mild haploinsufficiency. This speculation is reinforced by the RBC uptake data. The consanguineous asymptomatic heterozygous parents show an uptake of 83 and 84%. The homozygous daughters show an uptake of 63 and 66%,, mild to minimal phenotypes, and an autosomal recessive pattern of inheritance. The R468W mutation is located at the C-terminal end of the Glut1 protein (Fig 1). Structural analysis of the Glut1 C-terminus domain has shown normal protein activity with deletions of 24 amino acids. Deletion of 25 amino acids including R468, as well as a site-directed R468L mutation, showed reduced transport activity.19 The RBC uptake studies are a surrogate measure of glucose uptake across the blood-brain barrier as the Glut1 protein is immunochemically identical in these two membranes.18 These assays correlated well with the clinical status of the subjects (Fig 2). The carrier parents in the two families had uptake values of 87%, 84% and 83% suggesting a residual Glut1 function above 75% and no clinical symptoms. The two children in family 2 had RBC uptake values of 64% and 63% and mild clinical symptoms. The compound heterozygous proband in family 1 had an RBC uptake of 36% suggesting residual Glut1 function between 25–50% and a severe clinical phenotype. Our population of patients presenting with an autosomal dominant inheritance pattern showed average uptake values around 50% compared to their relative controls (Fig 2).
These two families present further proof of concept that the severity of neurological symptoms correlate directly with residual Glut1 function2 and reinforce the speculation that Glut1 transport is a critical rate limiting function determining brain growth and function.
Acknowledgments
Dr. Rotstein receives research support from the Pediatric Neurotransmitter Disease Association (fellowship grant).
Dr. De Vivo serves on scientific advisory boards for Spinal Muscular Atrophy (SMA) Foundation, the Colleen Giblin Foundation, the Pediatric Neurotransmitter Disease Association, and the International Reye Syndrome Foundation; receives royalties from publishing The Molecular Basis and Genetic Basis of Neurologic and Psychiatric Disease, 4th ed. (Lippincott Williams & Wilkins, 2008); and receives research support from the NIH [#1 UL1 RR024156-01 (investigator), NINDS #5K12NS01698 (program director) and #5R01NS37949 (principal investigator), and NICHD #5P01HD32062 (principal investigator)], the SMA Foundation, the Will Foundation and the Colleen Giblin Foundation.
References
- 1.Wang D, Pascual JM, Yang H, et al. Glut1 deficiency syndrome: Clinical, genetic, and therapeutic aspects. Ann Neurol. 2005;57:111–118. doi: 10.1002/ana.20331. [DOI] [PubMed] [Google Scholar]
- 2.De Vivo DC, Wang D. Glut1 deficiency: CSF glucose. How low is too low? Rev Neurol (Paris) 2008;164:877–880. doi: 10.1016/j.neurol.2008.10.001. [DOI] [PubMed] [Google Scholar]
- 3.Pons R, Collins A, Rotstein M, et al. The spectrum of movement disorders in Glut-1 deficiency. Mov Disord. 2010;25:275–281. doi: 10.1002/mds.22808. [DOI] [PubMed] [Google Scholar]
- 4.Suls A, Mullen SA, Weber YG, et al. Early-onset absence epilepsy caused by mutations in the glucose transporter GLUT1. Ann Neurol. 2009;66:415–9. doi: 10.1002/ana.21724. [DOI] [PubMed] [Google Scholar]
- 5.Wang D, Kranz-Eble P, De Vivo DC. Mutational analysis of GLUT1 (SLC2A1) in Glut-1 deficiency syndrome. Hum Mutat. 2000;16:224–231. doi: 10.1002/1098-1004(200009)16:3<224::AID-HUMU5>3.0.CO;2-P. [DOI] [PubMed] [Google Scholar]
- 6.Brockmann K, Wang D, Korenke CG, et al. Autosomal dominant Glut-1 deficiency syndrome and familial epilepsy. Ann Neurol. 2001;50:476–85. doi: 10.1002/ana.1222. [DOI] [PubMed] [Google Scholar]
- 7.Klepper J, Willemsen M, Verrips A, et al. Autosomal dominant transmission of GLUT1 deficiency. Hum Mol Genet. 2001;10:63–8. doi: 10.1093/hmg/10.1.63. [DOI] [PubMed] [Google Scholar]
- 8.Ho YY, Wang D, Hinton V, et al. Glut-1 deficiency syndrome: Autosomal dominant transmission of the R126C missense mutation. Ann Neurol. 2001;50:S125. doi: 10.1002/ana.1222. [DOI] [PubMed] [Google Scholar]
- 9.Wang D, Pascual JM, Yang H, et al. A mouse model for Glut-1 haploinsufficiency. Hum Mol Genet. 2006;15:1169–79. doi: 10.1093/hmg/ddl032. [DOI] [PubMed] [Google Scholar]
- 10.Ullner PM, Di Nardo A, Goldman JE, et al. Murine Glut-1 transporter haploinsufficiency: postnatal deceleration of brain weight and reactive astrocytosis. Neurobiol Dis. 2009;36:60–9. doi: 10.1016/j.nbd.2009.06.014. [DOI] [PMC free article] [PubMed] [Google Scholar]
- 11.Kaufmann P, Shungu DC, Sano MC, et al. Cerebral lactic acidosis correlates with neurological impairment in MELAS. Neurology. 2004;62:1297–302. doi: 10.1212/01.wnl.0000120557.83907.a8. [DOI] [PubMed] [Google Scholar]
- 12.Klepper J, Garcia-Alvarez M, O’Driscoll KR, et al. Erythrocyte 3-O-methyl-D-glucose uptake assay for diagnosis of glucose-transporter-protein syndrome. J Clin Lab Anal. 1999;13:116–121. doi: 10.1002/(SICI)1098-2825(1999)13:3<116::AID-JCLA5>3.0.CO;2-C. [DOI] [PMC free article] [PubMed] [Google Scholar]
- 13.Wang D, Kranz-Eble P, De Vivo DC. Mutational analysis of GLUT1 (SLC2A1) in Glut-1 deficiency syndrome. Hum Mutat. 2000;16:224–231. doi: 10.1002/1098-1004(200009)16:3<224::AID-HUMU5>3.0.CO;2-P. [DOI] [PubMed] [Google Scholar]
- 14.Wang D, Pascual JM, Iserovich P, et al. Functional studies of threonine 310 mutations in Glut1: T310I is pathogenic, causing Glut1 deficiency. J Biol Chem. 2003;278:49015–49021. doi: 10.1074/jbc.M308765200. [DOI] [PubMed] [Google Scholar]
- 15.Wang D, Pascual JM, Ho Y-Y, et al. Glut-1 deficiency syndrome (Glut-1 DS): a severe phenotype associated with compound heterozygosity in trans. Ann Neurol. 2001;50:S125. [Google Scholar]
- 16.Barros LF, Bittner CX, Loaiza A, Porras OH. A quantitative overview of glucose dynamics in the gliovascular unit. Glia. 2007;55:1222–37. doi: 10.1002/glia.20375. [DOI] [PubMed] [Google Scholar]
- 17.Carruthers A, Dezutter J, Ganguly A, Devaskar SU. Will the Original Glucose Transporter Isoform Please Stand Up! Am J Physiol Endocrinol Metab. 2009;297:836–848. doi: 10.1152/ajpendo.00496.2009. [DOI] [PMC free article] [PubMed] [Google Scholar]
- 18.Kalaria RN, Gravina SA, Schmidley JW, et al. The glucose transporter of the human brain and blood-brain barrier. Ann Neurol. 1988;24:757–64. doi: 10.1002/ana.410240610. [DOI] [PubMed] [Google Scholar]
- 19.Muraoka A, Hashiramoto M, Clark AE, et al. Analysis of the structural features of the C-terminus of GLUT1 that are required for transport catalytic activity. Biochem J. 1995;311(2):699–704. doi: 10.1042/bj3110699. [DOI] [PMC free article] [PubMed] [Google Scholar]